Is there a way to recreate the rHR / HRV chart used in myithlete?
https://www.myithlete.com/how-to-use-the-ithlete-pro-training-guide/
5 Likes
Not currently but thats an interesting chart and writeup. Might have to build something similar … 
5 Likes
Wow! I agree that this is a very nice and user-friendly way of representing the data. Daily training advice in one quick look at a single chart.
I’ve been checking this and trying to figure out how it exactly works. It’s not clear what values are used in the chart.
For RHR it’s clear: the origin is the 30 or 60 day rolling avg and the interpreted value is the daily measurement.
For HRV, things are less clear. The origin is also the 30 or 60 day rolling avg. But I can’t make out if the interpreted value is the daily measurement or the 7-day baseline or both. I would think that it is 7-day baseline to avoid to much jumping around but that would mean that de daily value is not considered at all and that would be strange.
Anyone around here using ithlete pro that can shed some light on this?
I asked Alan Couzens for an explanation.
[The axes values are] the individual athlete’s z-score, i.e. the number of standard deviations away from their long term mean. E.g. if my mean HRV is 80 and my standard deviation of all scores is 10, a morning reading of 90 would give me a score of +1.
1 Like
So is that chart his design? I didn’t know that.
It’s not. It’s myithlete’s chart. His AI engine integrates with their systems as the basis of the ‘ithlete Coaching Program’.
That part is pretty obvious…
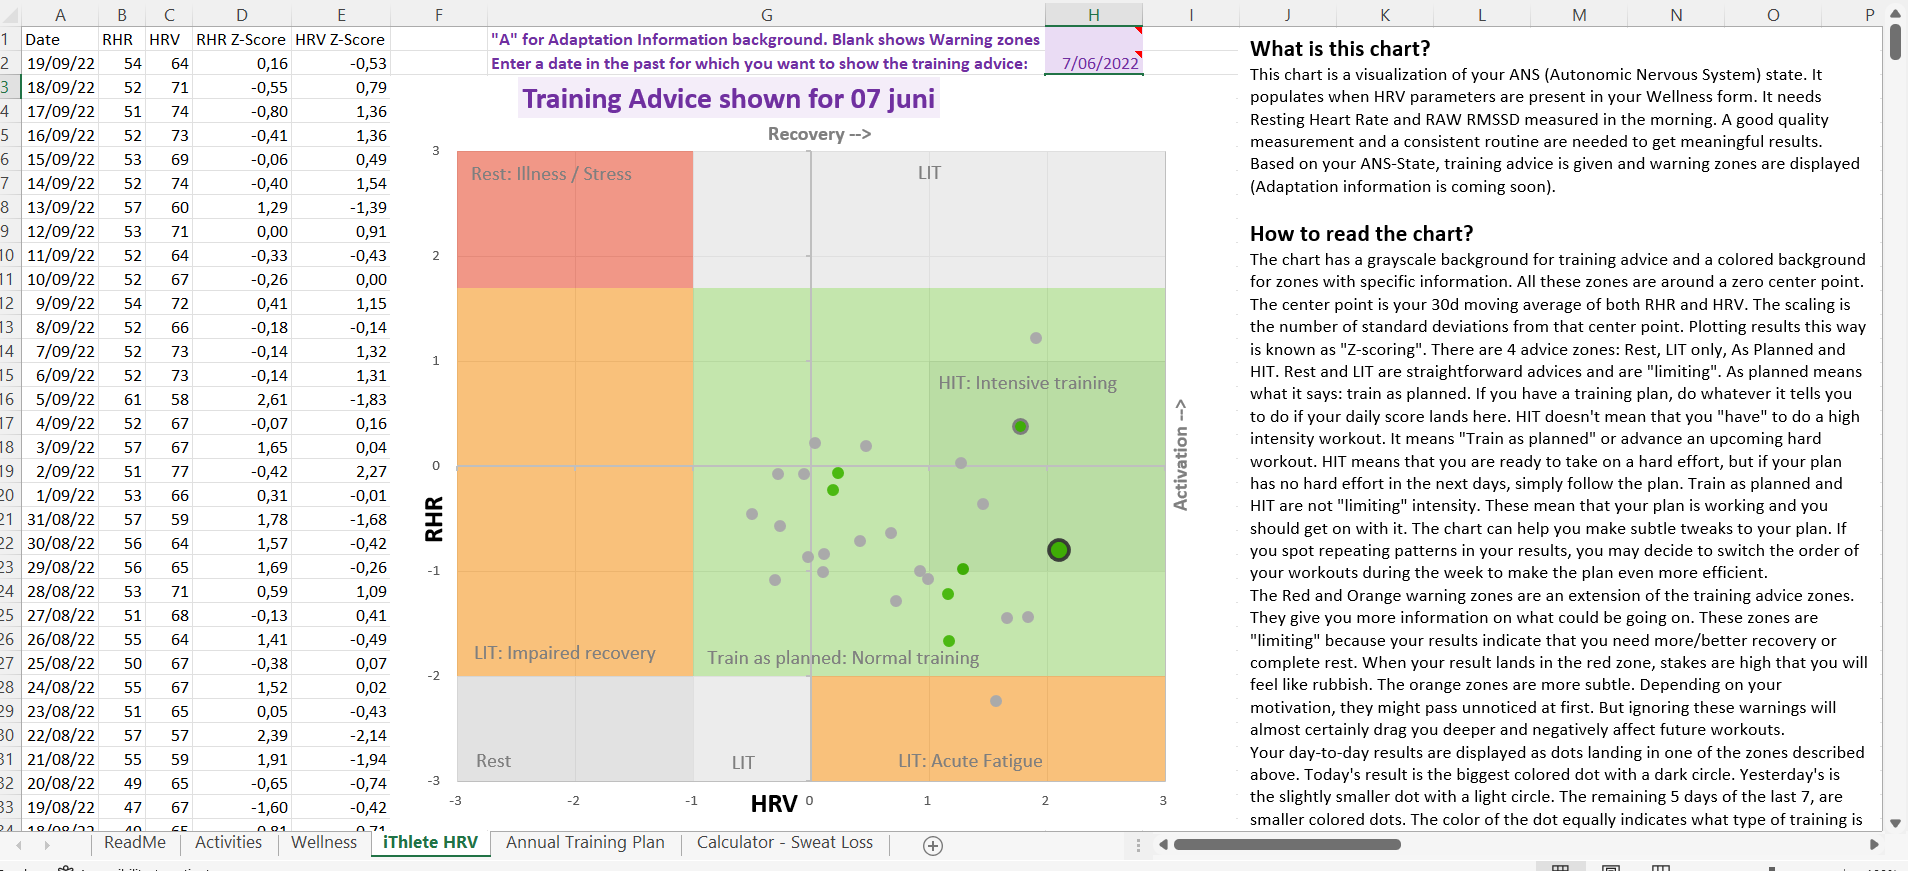
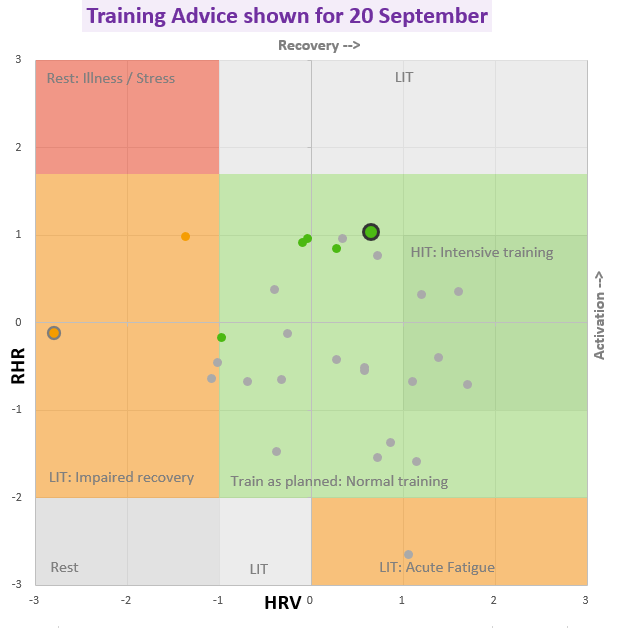
The center of the graph is the long term mean for RHR and HRV. Vertical displacement is +/- 0-3xSD RHR and horizontal displacement is +/- 0-3xSD HRV. For RHR, the use of the daily value seems logical. For HRV, it could make more sense to use a multi-day avg. Not sure but daily HRV tends to fluctuate quite a bit, while a 7-day baseline is less jumpy but still gives a good picture of what is going on.
Maybe plotting both on a longer period of time gives some clarity on what is most usefull.
The limiting factor of this graph is that it isn’t showing any trend. In combination with the trend graphs that I’m already using, feedback should be more complete.
Just thinking outloud here…
Thanks for thinking out loud! Agree 100% that it would be nice to see some trend data.
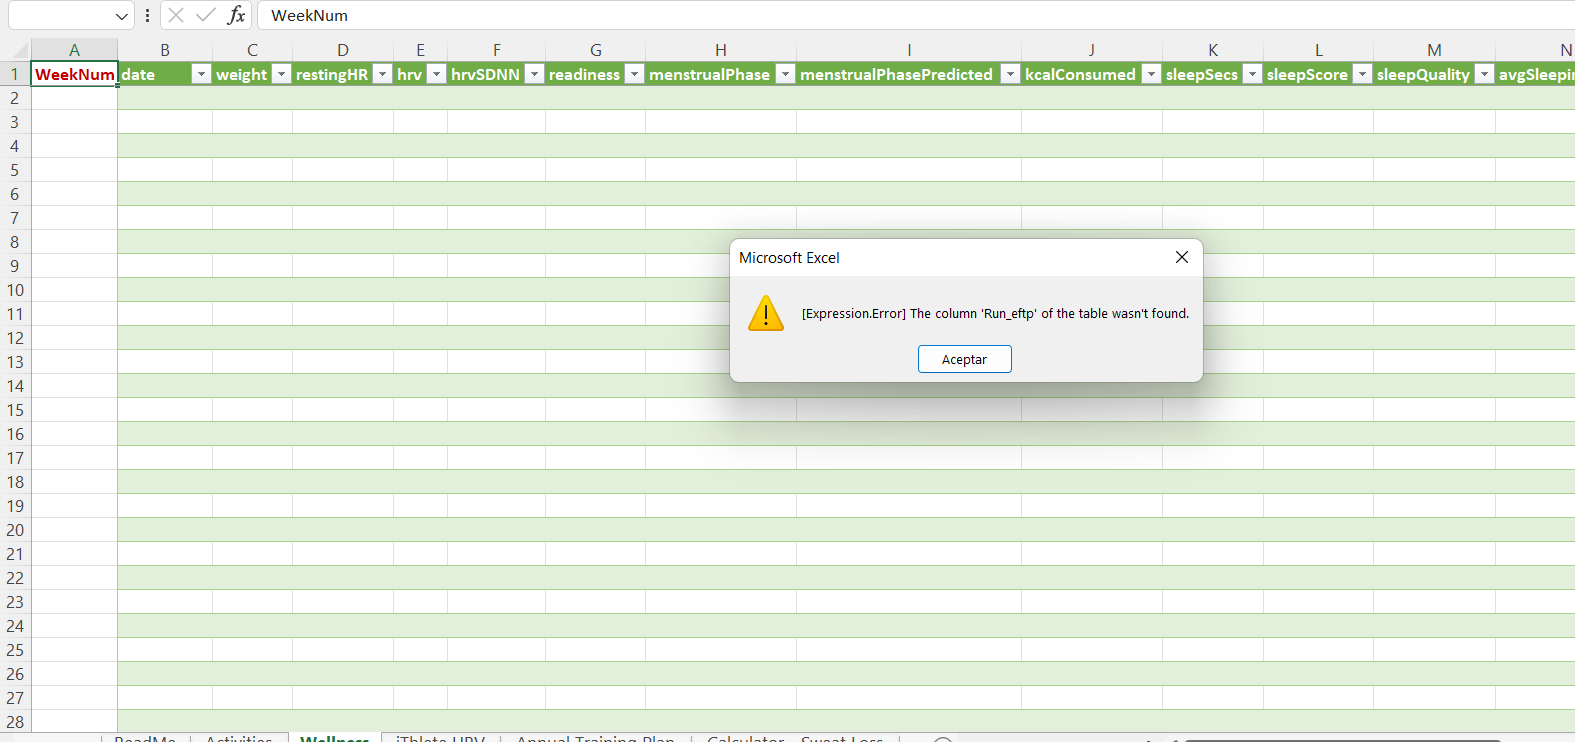
I’ve been working a bit on this but I lack the MS Excell knowledge to reconstruct the graph with colors and automatically select the last 14 days.
The logic for interpreting the “Z-Scores” seems to work well and correspond most of the time with the HRV interpretation from HRV4Training.
I’ve used lnRMSSD *2 just like iThlete is doing.
Anyone with a better knowledge of Excell who would like a copy of my file?

3 Likes
Send it to me and I’ll see what I can do on Excel.
Changing colours based on ranges is an easy fix, but would need to see the data first.
This looks really interesting! Thank you for sharing a snippet.
This is awesome. Tx so much to you and @Gerald for putting this together.
Providing historical results was fairly simple, so that’s already done. Adaptation info isn’t ready yet!
If you have entered data in the ATP sheet, check the Readme tab for instructions! Don’t simply replace the file because you will loose information entered on the ATP sheet!
When you see the link was updated to reflect v1.1, the new version is available for download.
4 Likes
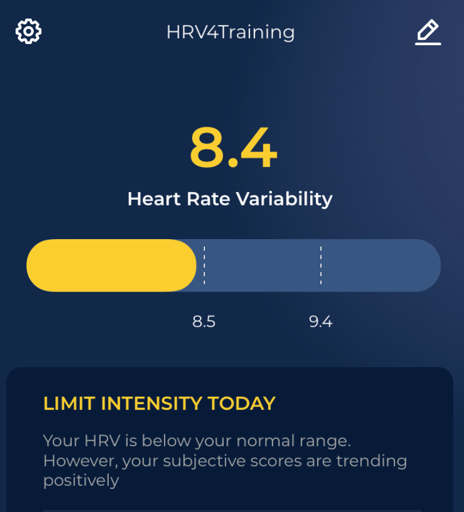
This morning’s data recommends limiting high intensity.
The coach in me says “listen to your body”, while the athlete would say “but I feel fine”.
The data says “take it easy”, so the decision is an easy one.
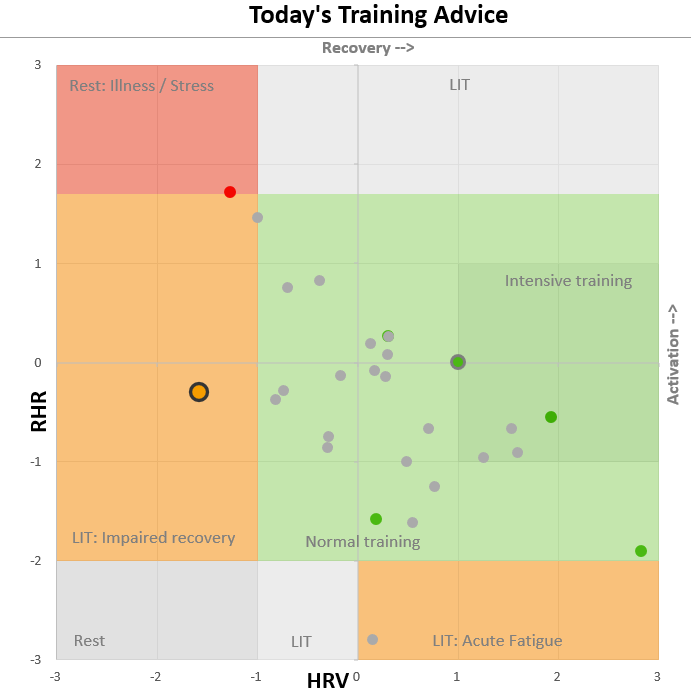
4 Likes
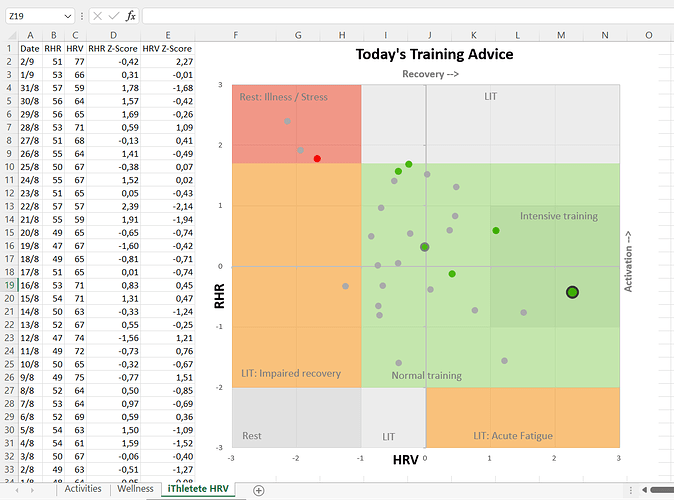
This is some seriously good work @MedTechCD and @Gerald - I think the forum owes you a coffee/ beer! Thank you very much for producing this and sharing it with us. I am going to digest more and collate some thoughts but thought I would share my chart “in action” to provide more evidence of it all working as expected…
4 Likes
For me, it’s part of the learning process; that never ends.
@MedTechCD did most of the work on the iThlete file, and I only helped with the scatter chart (the conditional formatting of the dots). As much as I helped him, he helped me learn a few things too.
I’m happy to share anything that is freely available to find on the internet, that helps make someone else’s life/decisions a little easier (to make). The only reason I can’t share the planned TSS/hours per week on the ATP is because it’s not mine. I don’t have permission from the owner to share it (or rather they won’t give permission to share).
2 Likes
Joined forces achieve more…
I want to thank @Howie for bringing this to our attention. The graph looked very inspiring and I started looking around to find more information on how it was build. I got to work and managed to “reverse engineer” the logic behind it but wasn’t able to graph it nicely. I got stuck. So I threw my work here in the forum and @Gerald picked it up and came back with a couple good ideas to implement it in Excel. That got me going again and I was able to make a first usable version.
I’m excited to see that some of you already have meaningfull results. Both graphs above show that HRV, measured correctly and consistently, can really help to make decisions that improve your planning. You both have most of your results in the “safe” zone and a couple of outliers. That’s, bottom line, the execution of a good training plan with some disturbing situations caused by daily life (bad night, work stress,…) , big efforts like races or hard workouts and/or mild sickness/stress. Keeping track of correlation with subjective feelings to put it into context is important to learn how your body reacts to different stressors.
It might sound strange, but the more boring the chart looks, the better you’re doing at managing life and training.
I will replace the date field by a date picker as soon as I get around the problems I’m having with it now. And after that a dropdown list to change the background to show Adaptation information.
Thanks @Olly_Thomas for your motivating reponse and @david for making the data easily available through the API.
4 Likes