With apps, in this context we actually mean apps on smartphones or even software on a laptop.
Most sports devices give you only one parameter:
- rMSSD (Garmin, Oura Ring)
- SDDN (Apple Watch)
With apps, in this context we actually mean apps on smartphones or even software on a laptop.
Most sports devices give you only one parameter:
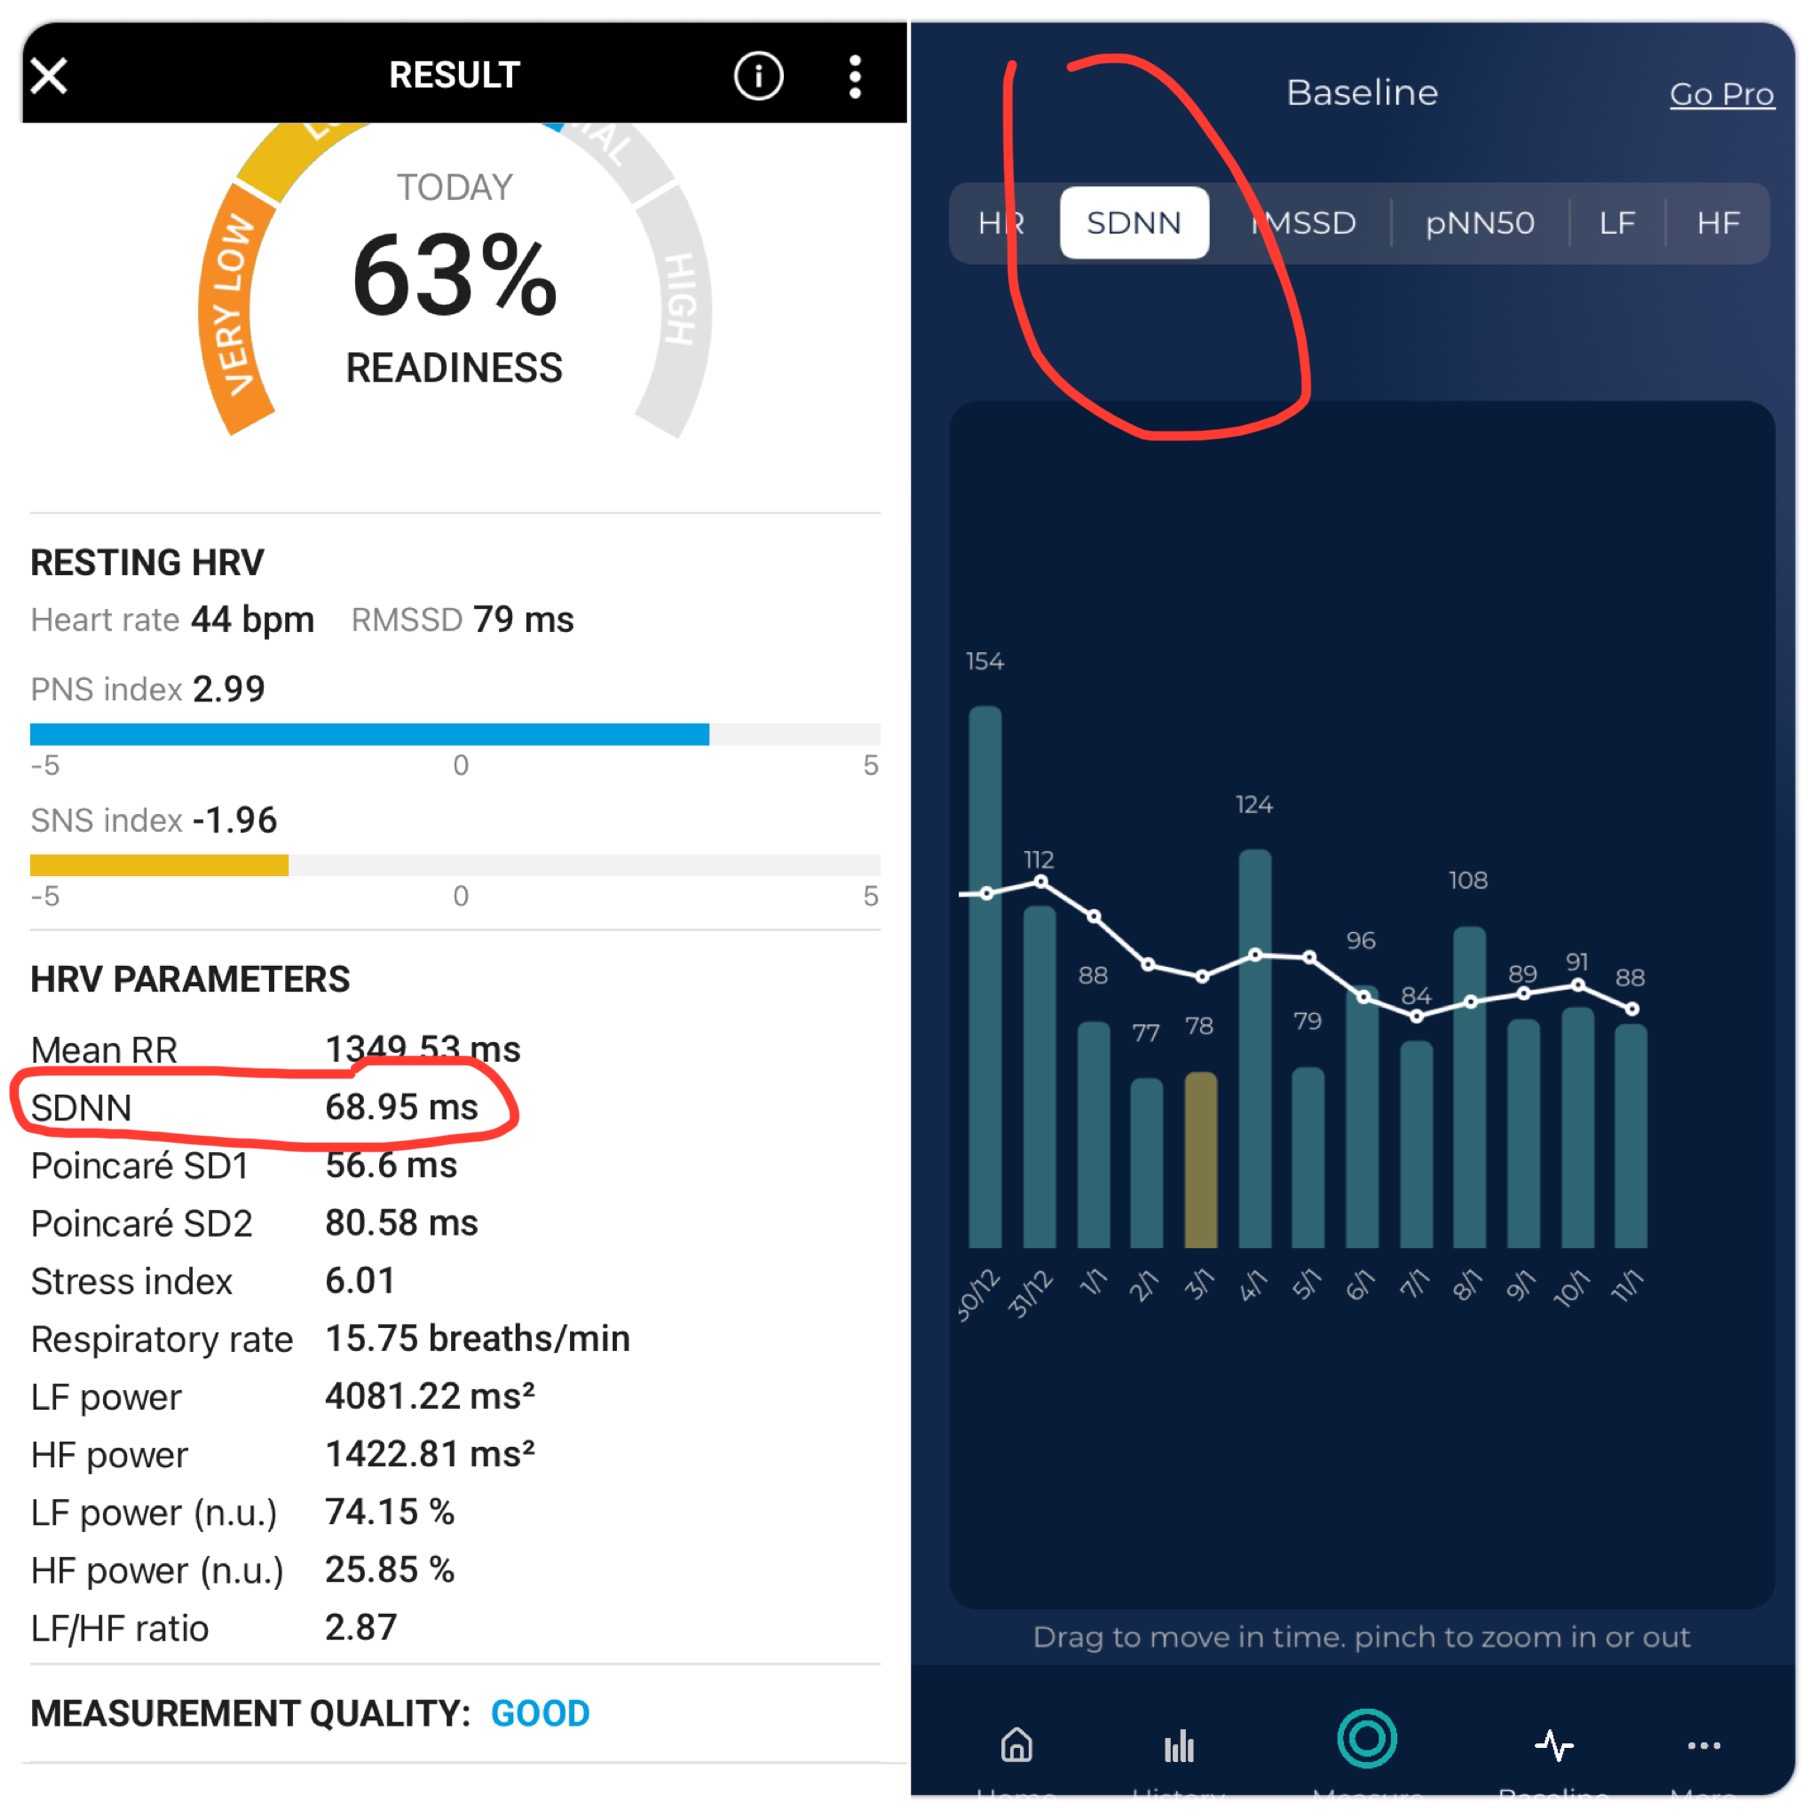
Here is the data, including SDNN, from the Kubios and HRV4Training Apps. While Garmin can give you HRV data, you might not get all the data that these apps give you.
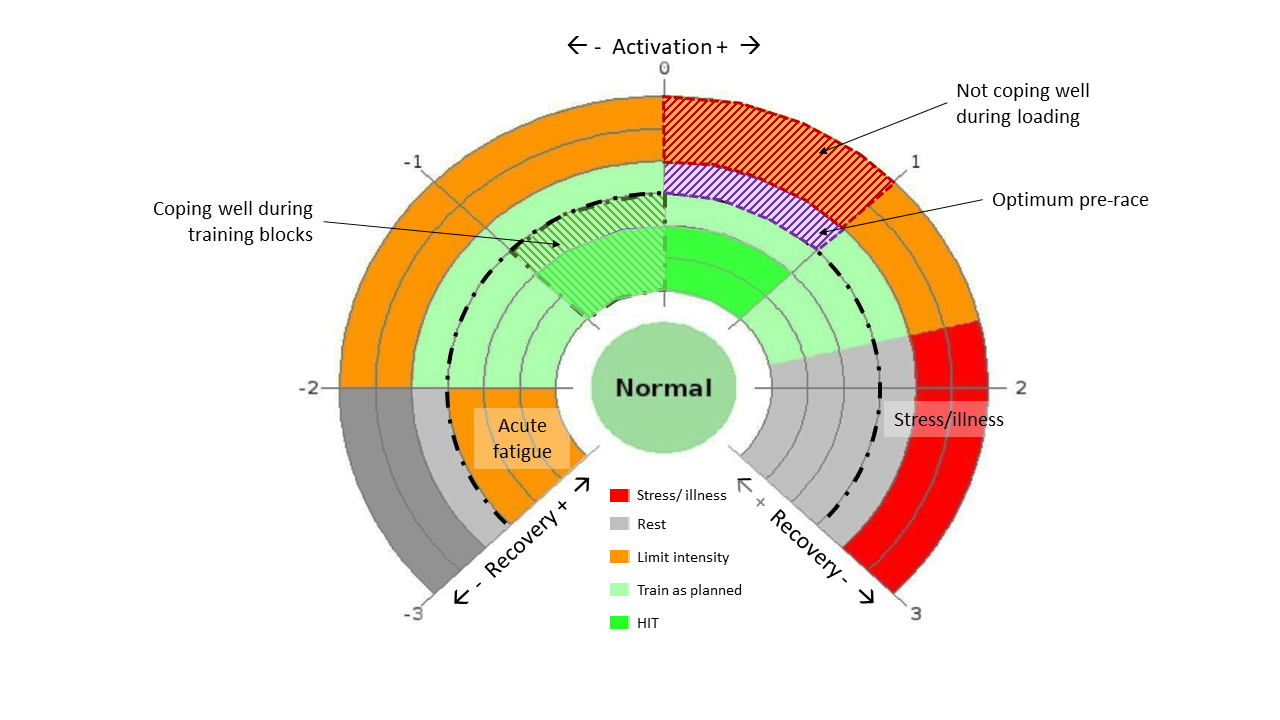
Hello, I have a small question about the ithletes plot and yours. Do you know how the zones are defined (LIT, Ilness, TrainingPlan, HIT, …) ?
I could read about the use of SWC, but how is it calculated? I don’t think it’s a classic standart deviation? Do you have any scientific papers based on this?
SWC (smallest worthwhile change) is not used here. It’s STDEV.P.
Read up on Z-scoring. The center point of the chart is the 30d avg of HRV and restingHR. The daily points are expressed as a multiple of STDEV from that avg.
The chart is a reconstruction of what is found here:
https://www.myithlete.com/how-to-use-the-ithlete-pro-training-guide/
The original iThlete chart has been developed with the cooperation of Alan Couzens. Information regarding the ‘zones’ are mostly from Alan Couzens, Marco Altini, Andrew Flatt and Daniel Rowland. Al well reputed names in this domain. There is no single page to redirect to for the interpretations. It’s a gathering of information from the websites and Twitter discussions of the mentioned people above.
I sort of ‘reverse engineered’ the iThlete chart in an Excel version. Inigo made the Matlab version with the exact same calculation method but changed the view on the graph to avoid getting in trouble with iThlete for using their exact same chart.
Thank you for your answer. The Z score is only useful for the graphical representation of what I understand:
“Z-scoring is a popular technique used by investors and other professional analysts to visualize whether a particular score is typical or unusual in a group of numbers, and if unusual, how unusual is it.
A Z-score of 0 means you are right on your normal value, and positive & negative values tell you if you are above or below the normal and by how many standard deviations. Z-scores are nearly always in the range +3 to -3.”
I would have to research more precisely how they managed to define the zones they created. If you ever have any information I’m interested.
As I said, all information used in this interpretation is gathered from different sources but all by the people mentioned above.
I’ve been reading literally for days to bring it all together. Most of what I found and used has already been mentioned in one of these threads:
It started of March 21 and resulted first in the HRV chart on te Fitness page based on Marco Altini’s HRV4Training blog. Last summer came the iThlete interpretation.
Hi all, I have just started using this ImReady4 app and it is great.
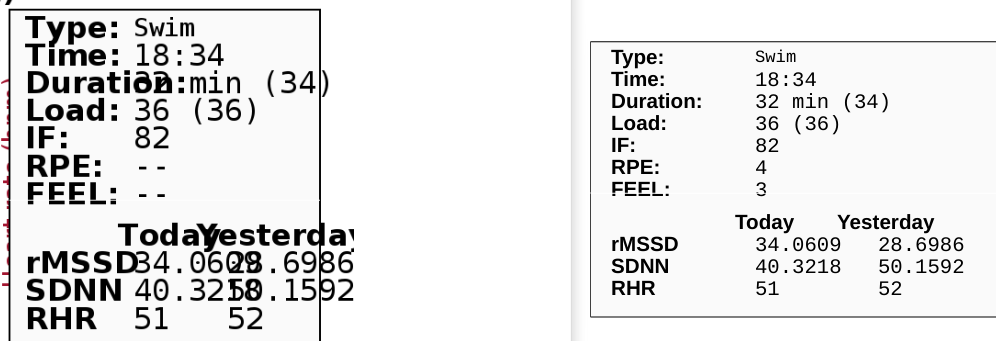
I am not sure if it just me but when looking at the graph on my iphone the numbers are jumbled up a bit. It looks like the way I am doing it the rMSSD, SDNN values have 4 decimal places and bunch up over the top.
I have been getting the data from Connect IQ App HRV Analysis which then pre-populates the wellness fields in intervals.icu. Screnshot below shows the table bunched up on left from iPhone, and then on Right I have logged into MATLAB from a Laptop with bigger screen and generated to see the values properly.
Just wondering if the value can be rounded in the output so it would display better on smaller screens?
I have also been recording the HRV to EliteHRV at same time via Polar H10, so far the ImReady4 seems to show a lot of LIT recommendations.
Check if the available update fixes this issue for you. In a new update, I will also try to solve some output format issues for iOS devices that I think are using higher font size than Android
There’s a new update to improve font size issues.
Now you can set font size as ‘normal’, ‘medium’ or ‘small’ being ‘normal’ the biggest (default size till now)
In case of still facing these issues, be patient as layout tuning is a bit tricky without a real device reference for mobile platforms
Thanks @Inigo_Tolosa
Also confirmed looks perfect now with Small/Small in the config file on my Iphone SE
Really appreciate your effort on this and look forward to using it
Cheers
Hi Inigo,
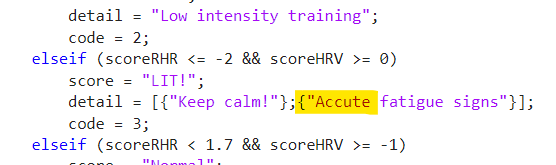
I picked up a spelling mistake in the advice, under the LIT advice.
I’m sure it doesn’t require a new update. I’ve changed it on my side.
If you change your master, then when others that don’t know how to edit the text can wait for the next change.
“Accute” should be “Acute”.
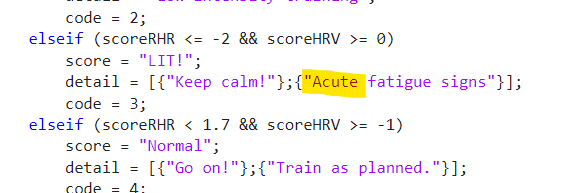
Fixed. Thanks
Hi Guys,
I just want to know if anyone ran the script on matlab from a python program or if it is possible. I’ve searched the internet but haven’t found anything useful so far.
There is a matlab.engine that allows calling MATLAB code within python programs. I have never used it, but maybe you could find a solution for your case
https://es.mathworks.com/help/matlab/matlab_external/call-user-script-and-function-from-python.html
This links to the Spanish documentation, but I suppose it will be easy for you to move to any other language
It also happened with me (no data showing). I would try later in the day (3 times) and it worked.
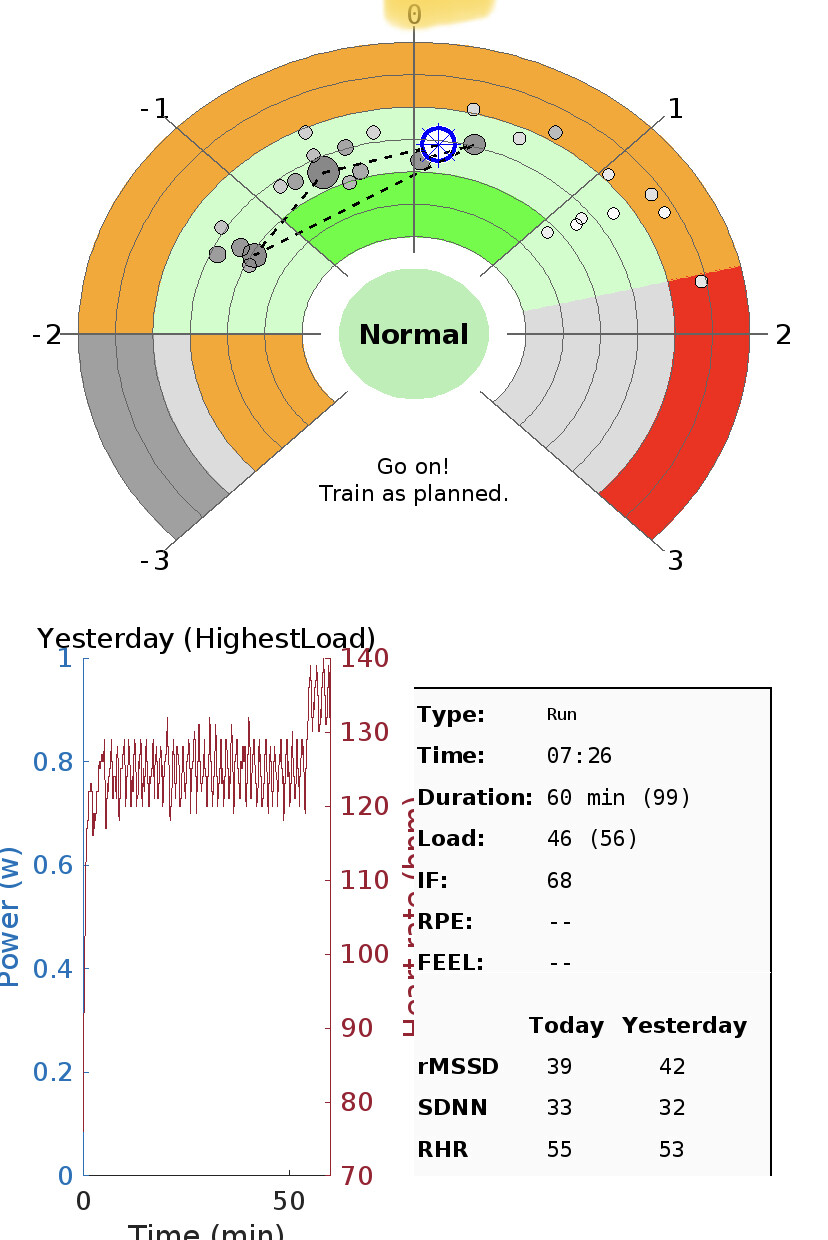
In case this is useful for anyone. Based on this article from myithlete Link, doing this helped me make my head around the graph and the meaning of the various areas.
Great work
That is indeed the ‘Adaptation’ information that I planned to add. But I need to find the time to do it.