Training guidance tools using the API

We, @Gerald and myself, have been collaborating on making an MS Excel file that pulls the wellness and activity data from the Intervals API. We both think that we have some exciting and more advanced features that could maybe, one day, make it to Intervals natively. But given the fact that @david already has a long todo list, we wanted to make these features available in a user-friendly way. You will need a device running MS Excel and that’s pretty much all you need to use the file.

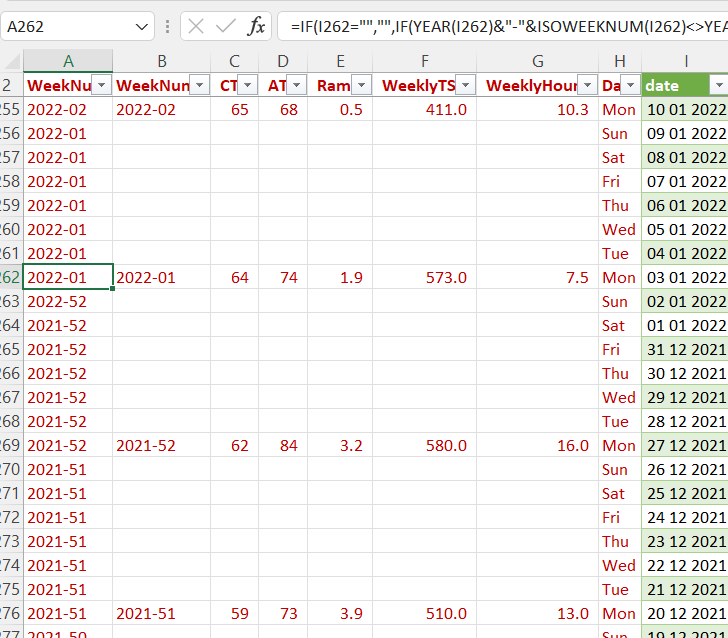
The ReadMe tab gives you the information on how to setup the API connection. The file uses Excel 's Power Query Editor to make the necessary transformations on the csv data. The csv data comes in as US formatted and needs formatting to be used in for example Central Europe (dates, decimal point/comma, …). It should work correctly all over the world.

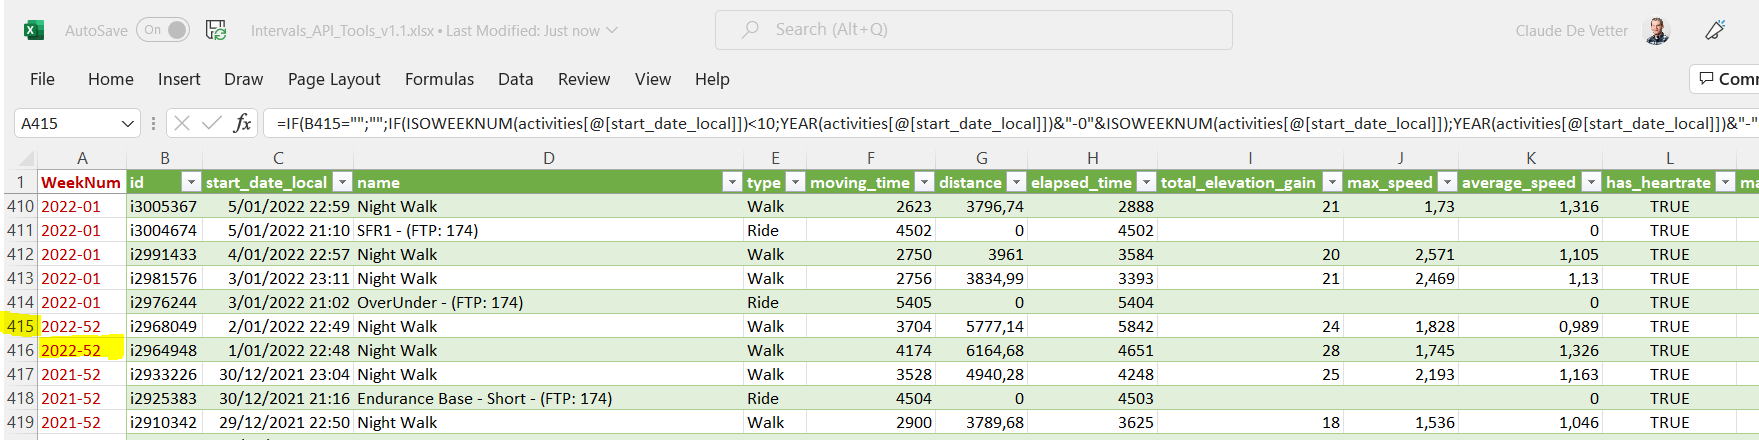
The Wellness and Activities tabs will be populated as soon as you have the connection setup.

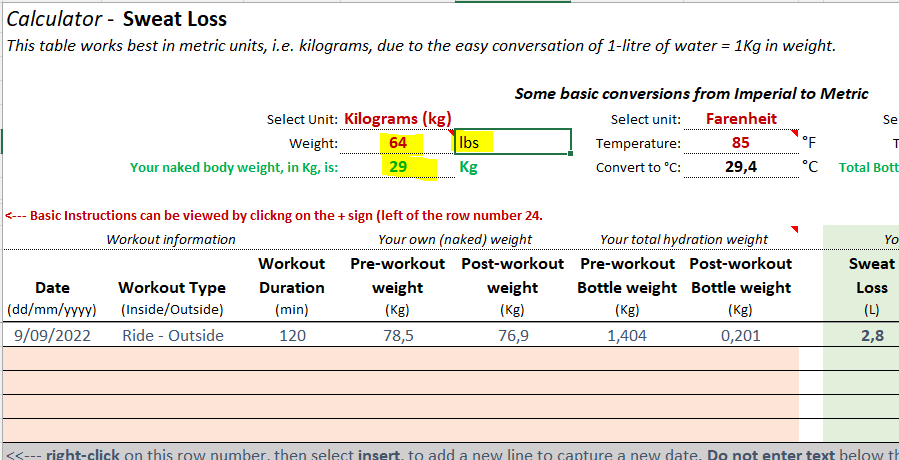
The template for an Annual Training plan and the Sweat loss calculator are entirely @Gerald 's work.

And there is a tab with the iThlete HRV chart that I was finally able to finish by upgrading my Excel knowledge :wink: . If you have RHR and RMSSD in your wellness data, you should immediately see some results. I’m pretty sure there will be bugs and unexpected behavior, but I only tested this on my own data. things that are already on the todo list for that chart are:

  • Adding the Adaptation information

  • Providing a way to look at historical results by selecting a date. For now, you will only see the results for today.

I’m now as a first priority going to work further on the guide section for Power and Pace and will pick up on the HRV chart after that, if there’s enough interest.

Post any questions/remarks in this thread and we will respond as best as we can.

Hope you like the functionality.

Here is the link to the file. If it opens in Google worksheets, select “Make a copy” and save it somewhere on your device or on a cloud space. It will not work in Google, you have to open in MS Excel.
https://drive.google.com/drive/folders/1WhIOf2XkGiZBEN_7tX2PSShmF-QXBnBF?usp=sharing

14 Likes

Whoa! Cool! Looking forward to stepping my way through this. :face_with_monocle:

Hi, great work, interesting
I have tried according to instructions but it only downloads activity data (I have HR, RHR ad Rmssd from OURA linked to intervals.icu, shown correctly on the web)
Why could that be? I put API_KEY on both fields (activity and wellness) in excel sheet as indicated
EDIT : solved, I had an error message saying run eFTP was missing, I put that in (I mainly do cycling) and now wellness works too

sigh… (My) excel mac doesn’t support this… I don’t get the “Get Data”
web says supposedly only avaialble on Excel Mac Beta

1 Like

Did you add separate links for activities.csv and wellness.csv?

1 Like

I’ll work on an alternative file and test on Mac, then let you know once done.

3 Likes

Thx, I don´t own any Apple device. Can´t test or diagnose.

2 Likes

Updated

1 Like

Feedback: it looks like the weekno formula is not 100% correct. For my first activities in 2022, it results in “2022-52” as weekno.

Good catch. Should be 2021-52.
@Gerald inserted the week-nr for the ATP. He will have a look.

Please can you click on the cell where this occurs, and send a screenshot of the page.
I don’t have 2022-52 in my original ATP spreadsheet, so it could be wrong in the file where we’ve merged all tabs together.

I am using ISOWEEKNUM in the formula.
WeekNum uses the week containing January 1 as the first week of the year. The result from this function can range from 1 to 54. ISOWeekNum uses the week containing the first Thursday of the year as the first week of the year. This follows the ISO 8601 date and time standard definition for week numbering.29 Jun 2022

[

WeekNum and ISOWeekNum functions in Power Apps

](WeekNum and ISOWeekNum functions in Power Apps - Power Platform | Microsoft Learn

I have two activities at the end of 2021 that show 2022-52.

I also noticed a problem on the weight conversion in the Sweat Loss calculator

1 Like

I’ll spend some time on the problems today.

1 Like

This is amazing. What is the reason something like Google sheets wouldn’t work? Is it the API integration?

Everything can work in Google sheets, except for the chart on the iThlete tab. I can share what I have currently, but I stopped when struggling with the chart; it’s not as easy as Excel (for me).

2 Likes

Happy to take a look to see if I can help. Drop me a message (if possible here) and let’s see if we can get it working. I think cloud based software is more accessible and common these days so it’d be good to see if we could get it working!

2 Likes

I’ll share the Google Sheets link with you later today.

3 Likes

Sweet. Share me any information alongside it and I’ll see what I can do to help get it working.

It would be perfect if you can make it work in Google sheets. I’ve made some attempts getting it to work in LibreOffice Calc on my Linux desktop but got stuck really fast. The challenges are

  • Connecting to the intervals API with basic authentication (user: “API_KEY” with password “personal API key”)
  • The data comes in as EN-US formatted, comma separated values. That’s fine if your regional settings are EN-US but in Europe, that’s immediately a mess because we use comma as a decimal separator. I used to Find/Replace the comma delimiter by a semi-colon as a first step. In Europe, csv’s are usualy delimited with a semi-colon for that reason. In Excel it is handled pretty easily with the Power Query Editor. Don’t know how Google sheets handle that.
  • The calcualtions and formula’s are pretty straightforward. There should not be much work for that
  • The graph building is plenty of workarounds to overcome Excel limitations. The most difficult in my opinion is building a background with zones that are colored differently. For Excel I found a tutorial, thanks to the example Gerald gave me: Shaded Quadrant Background for Excel XY Scatter Chart - Peltier Tech

Wishing you the best of luck and don’t hesitate to ask questions for a better understanding of the logic and functionality of the chart.

1 Like

The API works, thanks to another Intervals’ user. I’ll find his name and give credit, as there is a Next Activity suggestion in the file. I have been able to add to it, just like the current Excel file works.

1 Like