Ya tengo clave api, gracias
que paso es el siguiente???
Ya tengo clave api, gracias
que paso es el siguiente???
Next step is to copy the API-key and your Athlete ID to the config_atheltes.m file.
Paste in the fields:
ok
hecho
Hay alguna guia para hacer funcionar la app??? La necesito
There is no guide, but a few people able to assist. The first 2-3 posts in this topic covers the instructions to get started.
Have you been able to connect your data?
The instructions for setting up the app are at the start of this thread. Imready4 is a user-friendly spinnoff from the MSExcell version I made based on the ithlete Pro chart
Information on how to interpret can be found on:
My own resume of the interpretation is in the MS Excell file like this:
What is this chart?
This chart is a visualization of your ANS (Autonomic Nervous System) state. It populates when HRV parameters are present in your Wellness form. It needs Resting Heart Rate and RAW RMSSD measured in the morning. A good quality measurement and a consistent routine are needed to get meaningful results.
Based on your ANS-State, training advice is given and warning zones are displayed (Adaptation information is coming soon).
How to read the chart?
The chart has a grayscale background for training advice and a colored background for zones with specific information. All these zones are around a zero center point. The center point is your 30d moving average of both RHR and HRV. The scaling is the number of standard deviations from that center point. Plotting results this way is known as “Z-scoring”. There are 4 advice zones: Rest, LIT only, As Planned and HIT. Rest and LIT are straightforward advices and are “limiting”. As planned means what it says: train as planned. If you have a training plan, do whatever it tells you to do if your daily score lands here. HIT doesn’t mean that you “have” to do a high intensity workout. It means “Train as planned” or advance an upcoming hard workout. HIT means that you are ready to take on a hard effort, but if your plan has no hard effort in the next days, simply follow the plan. Train as planned and HIT are not “limiting” intensity. These mean that your plan is working and you should get on with it. The chart can help you make subtle tweaks to your plan. If you spot repeating patterns in your results, you may decide to switch the order of your workouts during the week to make the plan even more efficient.
The Red and Orange warning zones are an extension of the training advice zones. They give you more information on what could be going on. These zones are “limiting” because your results indicate that you need more/better recovery or complete rest. When your result lands in the red zone, stakes are high that you will feel like rubbish. The orange zones are more subtle. Depending on your motivation, they might pass unnoticed at first. But ignoring these warnings will almost certainly drag you deeper and negatively affect future workouts.
Your day-to-day results are displayed as dots landing in one of the zones described above. Today’s result is the biggest colored dot with a dark circle. Yesterday’s is the slightly smaller dot with a light circle. The remaining 5 days of the last 7, are smaller colored dots. The color of the dot equally indicates what type of training is advised for that day. The grey dots, similar in size to the smallest colored dots, are the results from the former 3 weeks.
Plotting the results this way, shows a lot of information and is easy to understand even at a quick glance.
There’s more!
Unlike the chart, real life is not “hard bordered” when it comes to zones and advice. If today’s dot lands on or very close to a zone border, check a bit further. How much are the 7 colored dots spread around? If they are all closely grouped and near the center of the graph, this means that your 7d baseline is quite stable. This is defined by a low “CV”, Coefficient of Variation, and that’s a good thing because stable is always good when it comes to a state of ANS. If today’s dot is just in the LIT zone while the other 6 are plain in the As planned zone, you could decide to just go on with the plan, even if it says to do something harder than LIT. If the dots are spread around the chart, it’s probably a better idea to take it easy because the CV is high in that case and your situation is not stable at all. You can take that even a bit further by looking at the spreading of all 28 results, grey ones included.
Isn’t higher HRV and lower RHR always better?
The above is true but only if it is about a slow longer term trend. Any sudden meaningful change in your ANS means that something is disturbing your usual routine and that is not good. Slow changes that are improving your health and reduce stress levels are what you’re looking for. Anytime your result ends up at the corners of the chart, something wrong is happening. That’s why there is an orange zone at bottom right. This has been identified as Acute Fatigue and the body is protecting itself by limiting HR. It is very unlikely that you will be able to get quick HR response when doing surges. HR will respond slower as usual.
The HRV4Training chart that is already available in Intervals.icu has a better visualization of longer term trends. You might even spot a circadian rhythm in your scores.
And a couple of other threads that are linked from this Intervals thread.
Check out those threads, they contain a load of information. If you have specific questions, we’re here to help. Just make sure to clearly desribe what you want and don’t hesitate to add a screenshot.
Buenos días Sigue sin funcionarme Creo que he hecho todos los pasos correctos, a continuacion te detallo como lo he hecho: Descargo e instalo la app matlab Creo una cuenta en mathworks, aqui no he hecho nada mas, no he puesto ningun codigo ni he aceptado nada, solo crear cuenta He creado en matlab las carpetas correctas
y luego he puesto los scripts correctos en el lugar correcto (esto lo hice en el ordenador como tu me dijiste)Que tengo que hacer ahora para que funcione o que he mal???
Me encantaria solucionar esto, es una gran herramienta
Only run ImReady4.m. That is the app.
It gets the athlete info from the config_athletes_template.m.
This should give you the result for today.
If you want to backfill data from the past, run PopulateImReady4.
From the errors there seems to be an error with your config_athletes file. Is it named ‘config_athletes.m’ or config_athletes_template.m?
The screenshots shows it with _template at the end. The ImReady4 script can’t find the config_athletes.m file, so rename it correctly and it should work.
El scrpit se llama config_athletes_template.m
Rename to config_athletes.m. That should solve the error.
Esto parece ser muy complicado
Pido disculpas
Esto es lo que me sale tras cambiar el nombre a config_athletes.m
Do you have at least one day with the three wellness metrics in Intervals.icu?
HRV (rmssd), HRV (sdnn) and Resting HR
You need the three metrics to display the longer term trends chart.
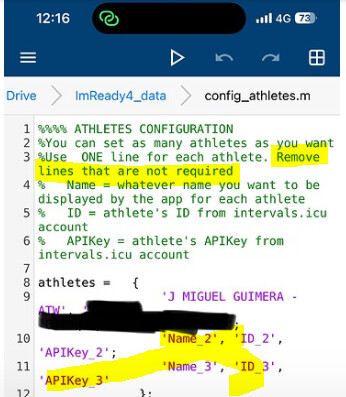
Can you post the contents of the config_athletes.m file here?
Just make your ID and APIkey unvisible.
You need to remove the lines with Name2, ID2…
Check the text just above!