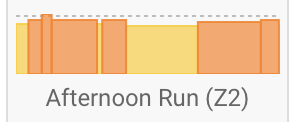
It would be possible to have the option of showing intervals only if there are no laps, since now it only shows automatically detected intervals, as when I run, I use laps, but it shows auto-detected intervals.

It would be possible to have the option of showing intervals only if there are no laps, since now it only shows automatically detected intervals, as when I run, I use laps, but it shows auto-detected intervals.

If you can now allow an image export of activity with intervals.icu branding we can post on Strava too ![]() something we talked about a long time ago. Great work David.
something we talked about a long time ago. Great work David.
Thanks, great feature.
This feature is awesome ! ![]()
Easily the coolest feature added in the last year for me! I would love to see even more mini-charts (e.g. sparklines) added through out the app.
Charts within the list view really makes the tabs useful for comparative analysis. I never saw much use for tabs beforehand.
I’ve created a tab for races, for analysis
And tab for indoor
thanks .ICU team!
I have just implemented this for mobile and will deploy Thurs AM (GMT+2).
It should show whatever the intervals are auto detected or otherwise. Can you point me at an activity where that isn’t happening?
I find the tabs are great for grouping common activities together, like my current layout where I’m busy cleaning up data, tagging workouts, checking for missing data, etc.
In this activity, I used (two) laps on my watch (Garmin F955), while running, but it shows the auto-detected intervals, instead:

There is an option under general settings to use laps instead of detected intervals. It can be changed per sport and is located directly below your power zones.

For past activities you will have to set this per activity or re-analyse all activities after changing the general setting.
I know, but I disabled it so that it would show the intervals from ROUVY. If I have “use laps for intervals” checked, it does not show any intervals for that Rouvy session.
I LOVE IT ![]()
![]() fabulous addition, thanks
fabulous addition, thanks
My ride intervals are set as “Power, HR, Pace”.
When I go on a ride on a bike that has no power meter, I would expect to see a chart based on HR, but that doesn’t seem to be what I’m seeing.
What am I missing?
This is a great addition and with the API, BreakAway: Indoor Training can now (BETA) also get the skyline chart and show it for completed workouts.
Completed Workouts:
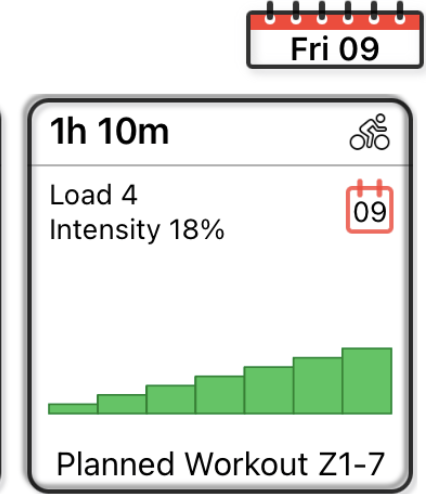
Planned Workouts:

@david I’m learning something new everyday, I learned that that you can actually condense a chart into a hash. ![]()
I was seeing a discprepancy when I was doing the development to support this skyline chart as well. (It was showing HR for my skyline chart intervals, instead of Pwr which is what I expected)
turns out I had the “intervals” setting as HR, Power, Pace (instead of Power, Hr, Pace as it has been change as shown below)
The other thing I noticed also was that in the completed activity view, the intervals shown was in HR and now Power (below example, I have changed it to PWR)
I had a look at your HR only ride on 6th Feb. That just has one interval for the whole ride. Intervals.icu doesn’t attempt to auto detect intervals for HR activities. You need to use the lap button or add them yourself.
Making this take up little space was an important part of the development. Did you figure out how to decode it? The skyline_chart_bytes field on activity holds base 64 encoded bytes for a protobuf encoded chart.
message SkylineChart {
  uint32 numZones = 1;
  repeated uint32 width = 2;
  repeated uint32 intensity = 3;
  repeated uint32 zone = 4;
  uint32 type = 5; // WorkoutTarget ordinals: 1 = POWER, 2 = HR, 3 = PACE
}
The intensity field is 100 for an interval done at FTP, LTHR or threshold pace. A few older charts won’t have type, I added that later to help debugging.
Took me a day and a half to get it figured out. Then had to re-do it once I figure out that it was in UINT8 and max was 127 and was getting errors > that number.
Really clever!
Next time just ask ![]() I wasn’t planning to make this part of the API but I can’t change it now that there are millions of these charts so it is safe to use!
I wasn’t planning to make this part of the API but I can’t change it now that there are millions of these charts so it is safe to use!
Tx!! Will keep that in mind, tho due to time zone differences, when I want to ask, you’ll be sleeping and vice versa.
I was just browsing the API data returned and per-chance saw it. (else I was gonna manually get it via some other means)
I used “split” to carve the ride out into intervals and I now see more or less the chart I expected to see.
Thanks for clearing that up! I was struggling with it for days ![]()