Super! I already integrate my screen everytime now on zwift ;-).
I have now connected my zwift play controller so I can use the buttons and I will connect to my kickr trainer so that I will be able to ride based on own gradients I can set with my zwift controller and within my app. I will also use that when doing my next treshold test because I very dislike ERG mode. This way I can play with the gradients if I don’t want to use the gradients from the current zwift route or race…
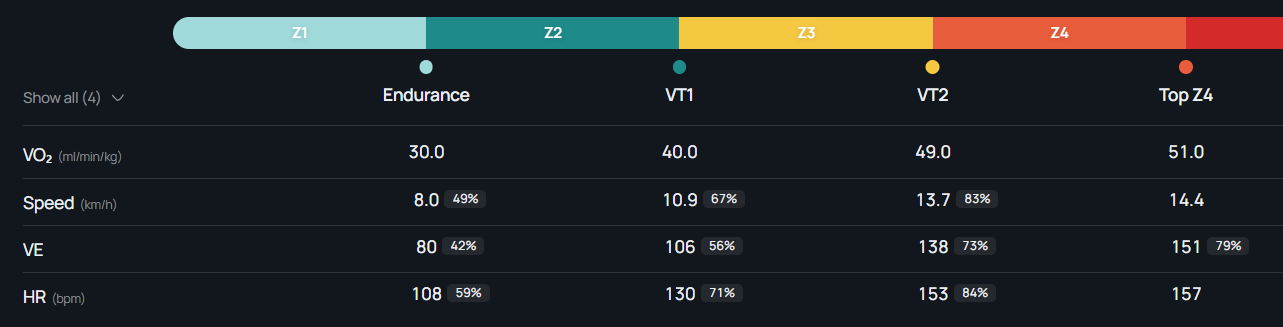
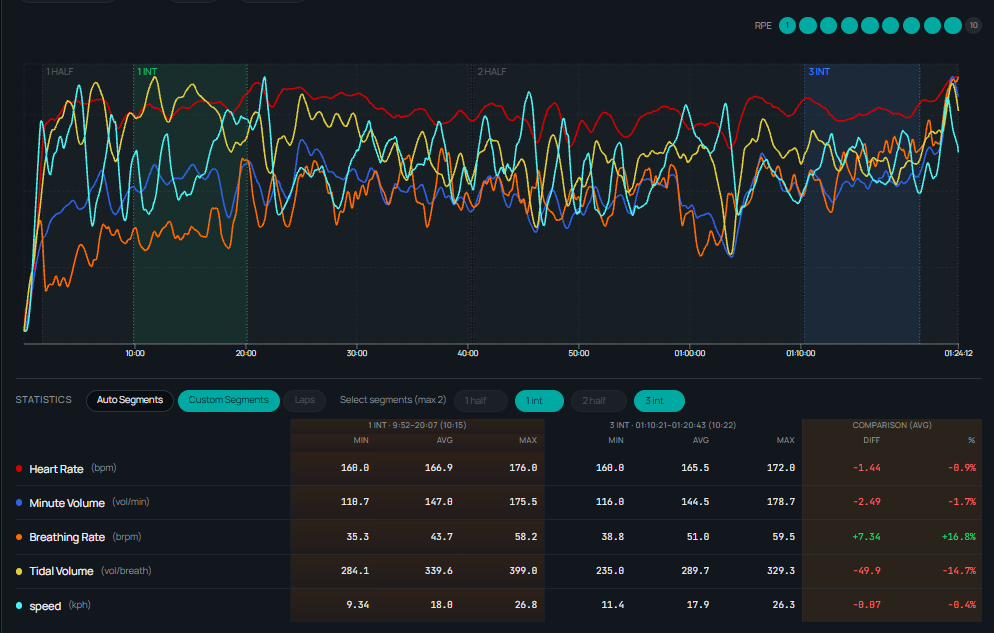
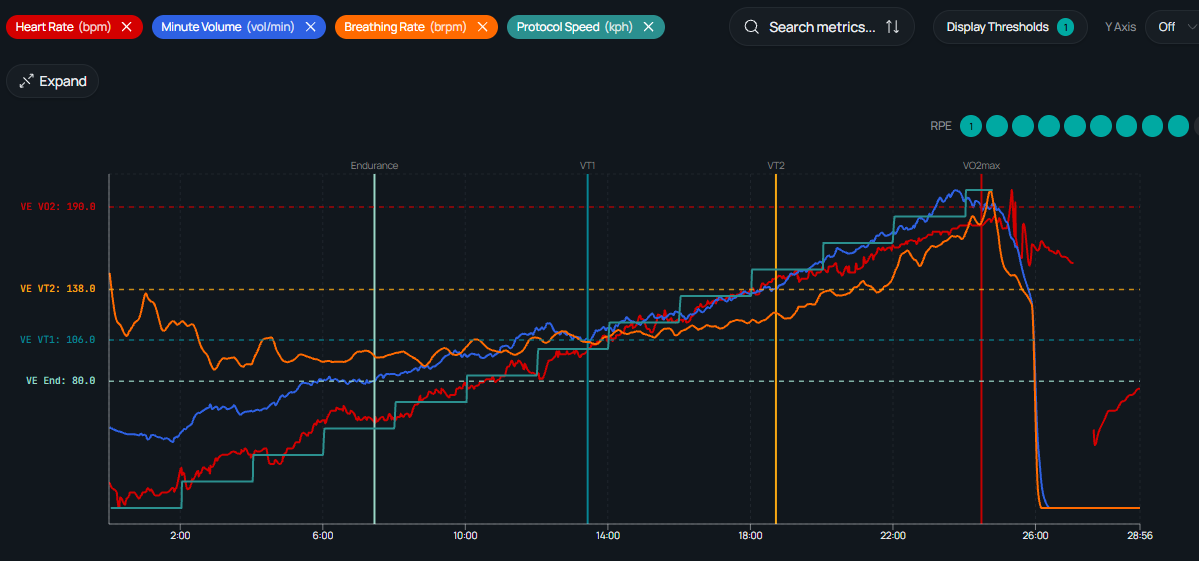
Results of my Half Marathon. Started not too hard and increased pace step by step. VE did go up immediately but settled in after 10-15min. VE from treshold test was 138 at VT2. I don’t know if you can run 1h40 around VT2? But ok. Looked at my VE, HR and pace during run and had feeling it stayed pretty good around RPE.
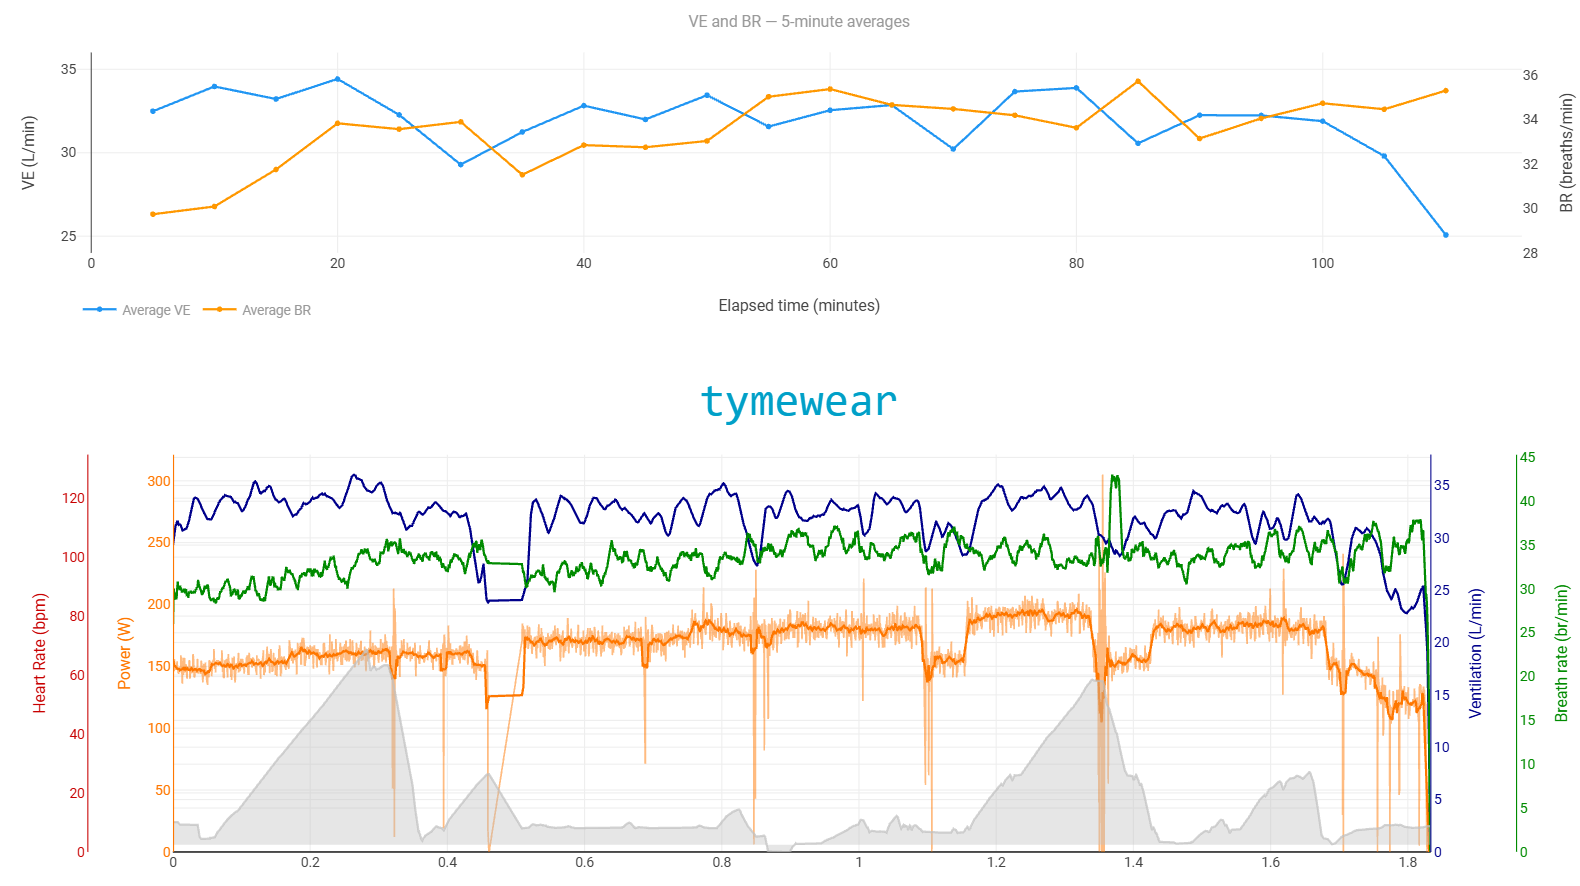
And here’s an example of a 30 km ski race (comparable to half-marathon efforts), RPE 9, meaning I went all out. It was a good race, I was ready for it, and the pacing across the distance was optimal.
In the screenshot is a comparison of the first third and the last third (excluding start and finishing sprint).
My average VE in a real competition over 1:30 is ~140 (close to VT1), but that’s skiing.
On descents you recover and my VE could drop to 100, while on climbs it rose to up to 180, and in the finishing sprut my VE went up to 225.
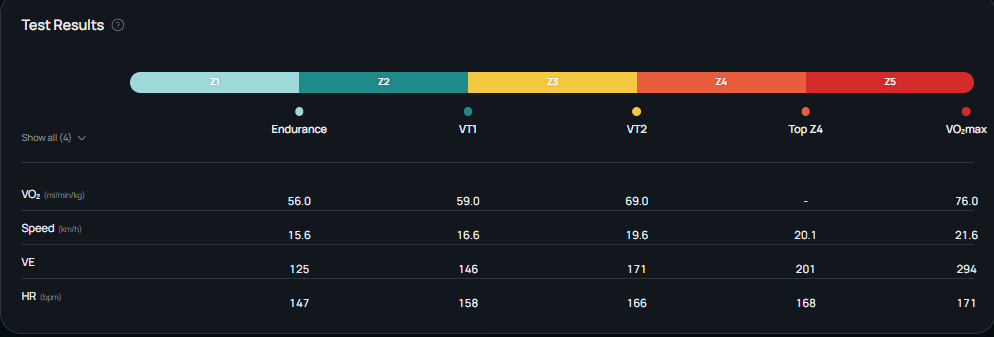
But I’m more than sure I couldn’t hold VT2 VE170 for 1h:30m without a dramatic drop in pace/speed. I could probably hold VE170 like at threshold — 30–50 minutes.
Yes, it was a real half marathon race. Was no goal and never did a 21k without swim and bike before so…still some viessing what I could do.
But indeed. VT2 VE from test looks low. Could also confirm some previous slow runs.
So maybe have to do a new test. Because pace was more or leds inline of what I would expect doe VT2. But pretty good that within this race my VE was stable enough for a large part. So…that was good news.
"Maybe it’s worth challenging TW support )))
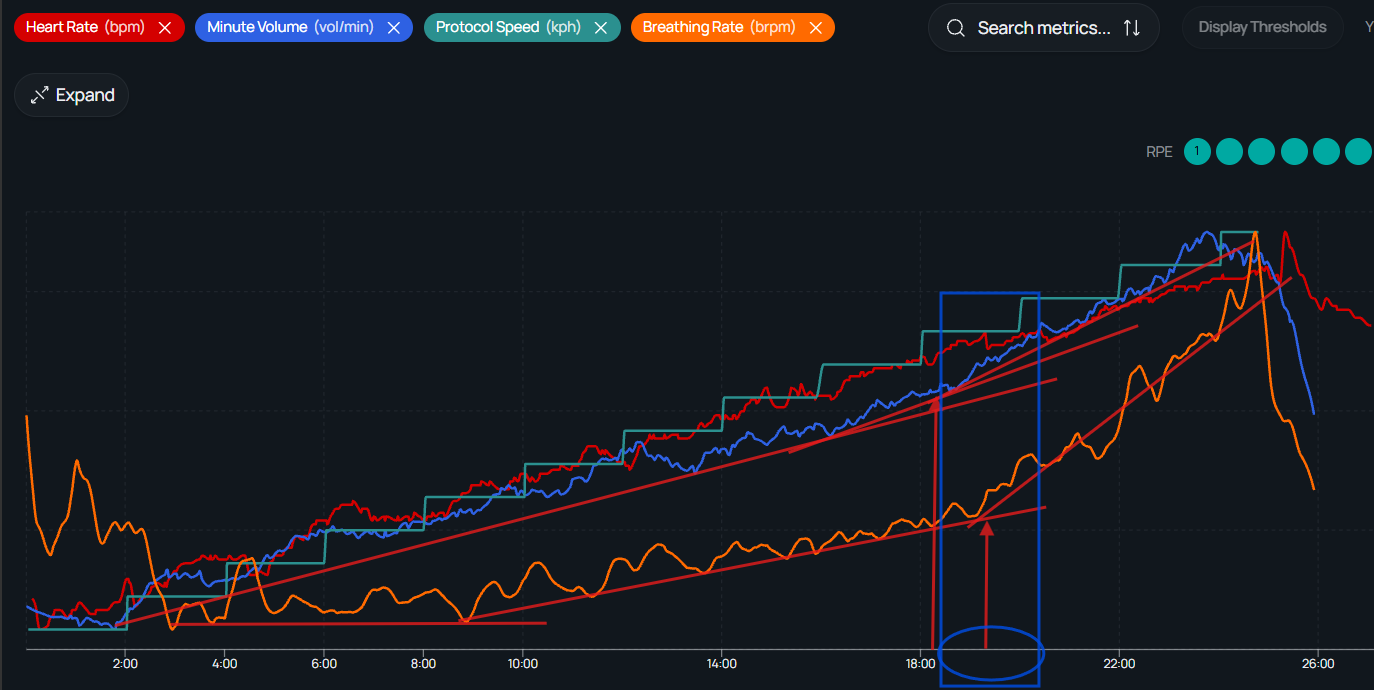
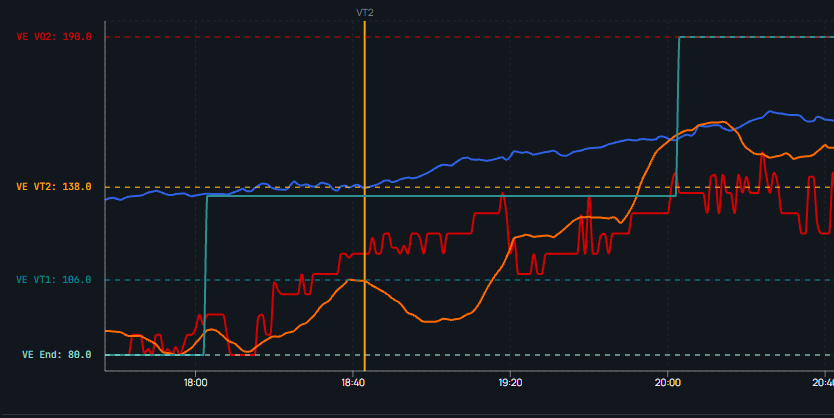
Returning to your test graph. I don’t actually see an obvious ventilation breakpoint at VT1 (like in my picture for exmp), however VT2 can be estimated quite reliably, although the ventilation graphs diverge, but probably your VT2 is somewhere at step 10, at the upper limit. What is your average VE BR VT pace value in the range of 18.5–19.5 minutes?" Probably we will see VE 155–160
But if I look at your point, that is already a VE of 148-150. So I wander, how correct is that treshold detection. Because at 18m42 my VE was 138 but 1min later it is already 151. So setting the barrier of VE at some spot, maybe you have to look into data of workouts and races later on the finetune your treshold? And that is also only possible with very accurate strap data with a uniform strap position.
I believe that if there are doubts about how the test determined your thresholds, it makes sense to discuss it with TW support. Though in my case everything more or less matches both their assessment and my data. Moreover, I specifically did treadmill testing with gas analysis and lactate, and the results were identical. Higher up in this thread I posted a detailed report and comparison of the data. Breathing rate at all steps matched at almost 98%, and the threshold determination from the tests matched as well.
For myself, I validate the test results visually, by the breakpoint lines, and I usually take the average VE value over a 45–90 second range at the breakpoint. The body isn’t a machine, after all — some latitude in the values is to be expected. In my tests the VT1 and VT2 boundaries are usually clearly expressed in ventilation; your graph is smoother, but BR at the VT2 level has a clear breakpoint, a change in pattern — which indicates a change in metabolic state.
You ran a half marathon at an intensity clearly below LT2 (VT2).
Average pace: 4:45 min/km
Average VE: 140.6
Average VT: 331.6
Average BR: 42.4
The threshold ventilation is probably definitely above 140, and if you take the average values in the range of 18.5–19.5 minutes rather than just a point — we’d probably see values around 150–155, but it’s definitely not 138.
But there’s an important caveat here: the test uses 2–3 minute steps, and I always assess the values more conservatively, with a certain margin, because in real training and racing it’s better to use more conservative numbers.
Within that range it would be 138min and 150max value (18.5 vs 19.5). So within a minute a 12 increase of VE. That makes pinpointing the exact VE spot for VT2 not that easy. But ok.
I had contact with TW support. I must say they always respons pretty quick and detailed. They said that if I would use the zone detection, it would give me a VT2 of 140.9-144.9 range. If I would use that I was 1h38min in Zone 3, so that would make more sense. Maybe strap position or something else not that ok with my first treshold test on the track. (that for sure could have been done better).
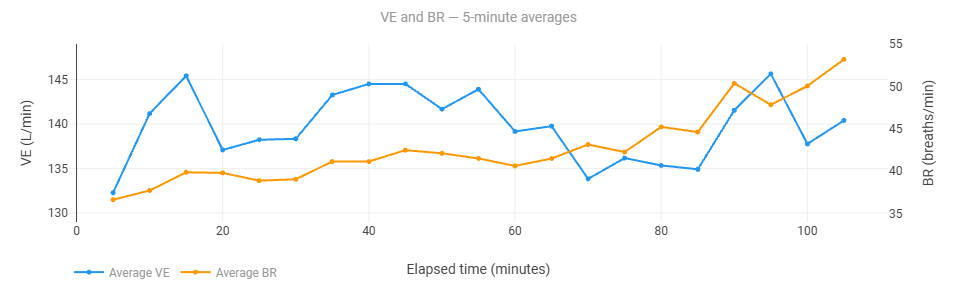
They also gave an insight of why my VE dropped a little on the end of the race, even when I increased my pace always with some progression. "Here we see what happens, you start with a lower BR and it starts to trend up while your volume falls. At the start it is balanced and towards the end breathig rate it higher (it feels harder - RPE) but you are breathing short breaths and not really getting the oxygen supply. It is natural but also trainable. Hope this is really good to understand your behaviour in the race. "
I made a little chart in intervals displaying VE and BR for 5min intervals. You see VE dropping (with no drop in pace and BR rising). So next step (when recoverd from race ;)). Is maybe a new track test with some better focus on strap position and not with holding my smartphone in my hands but record with my garmin watch.
I’ve run into this issue while trying to do a track test myself. I created a step test within the Garmin software because of the phone, but also the GPS in the phone being horrible in terms of getting an accurate speed. Have run into some interesting issues this week while trying a block of their suggested training. My recent threshold test VT1 was about 10% lower than the last test. Trying to do an easy run is no where close to the suggested pace if I follow that vs VE. If I follow VE the watch is yelling that the pace is too slow. There needs to be a middle ground.
As Timur has said the chart is within the connect IQ setting for the Tymewear. Device-My Data Fields- Tymewear-> Show Chart or VE as %X. For some reason my default was the % and I had misread the options. Select chart and you’ll get the rolling avg shown. I had misread that as the options being what the data was.
Ride number 3 after I decided to did the strap one notch tighter and not putting the strap of my bibs around shoulders. Plan was just and endurace ride. Around 35min warm-up, then 15min 170w, 15min 180w, little rest, 10min 190w, little rest, and then 15min 180W.
VE stays pretty stable even during that part of the ride. Only BR rises a little when going towards 180w and 190w. Good endurance ride.
Only remark. VE for this Z2 part of the ride was around 32.5-33, but on my friday ride with at least 30w less, my VE was around 34-35. With same strap position and setup. So it still is looking on some kind of VE consistency, but I think this is very difficult to achieve. One day is not another day like they say. It is better to use live VE as a guide then sticking to a fixed number or range. And I guess you need a good amount of rides or runs before getting used to the numbers and how to use them for your training.
Hi everyone! I’ve been using the Tymewear strap for a while now and came across an issue while cycling.
I wear the strap according to the official guidelines over the bib shorts straps. However, I’ve noticed that switching between different bib shorts brands noticeably distorts the ventilation readings:
When wearing Gobik bibs, the strap stretches less, resulting in artificially low ventilation (VE) values.
When wearing RASO bibs, the ventilation readings are significantly higher than they should be.
Has anyone else experienced this issue and found a good workaround or fix? Any advice would be greatly appreciated.
That was also my initial finding when riding indoors. So now, I don’t wear the straps of the bibs over my shoulder/back. I just tuck them in below. This way I want to investigate the stability of the reading. For the moment, this is working better…
During rides, outdoors and on the trainer, the numbers can differ.
But I use simple statistics. My anchor is VE 55 (±2), and I watch how my power changes. It’s almost always avr. 207w (185–225) ~ LT1, top of zone 2. I see a more significant drop in power only when I restrict fueling, or when it’s a second workout (after a key session or the day after a long ride), which I also attribute to fuel restriction.
BR usually depends on duration. At the same VE (55) and power (~200), it can rise from 26 to 33.
i experienced similar and fixed by repositioning where the sensors sit on my torso.
there are 6 slots on each side of the front strap with the HR sensor. originally i had both sides of the rear strap clipped into slot 4. i moved the right strap to slot 6 (“lengthening” it) and the left side to slot 2 (“shortening” it) so that the battery pod is positioned more towards my left arm, and the other pod is nearly centered on my back, directly on the bib strap.
this also helped to produce slightly cleaner data recording–removing some outliers; steadier readings–as i tend to use my right arm to drink, signal, switch Garmin screens, use my phone, etc.
i think it was @yokuha who worked with TW support to come up with an even more offset position. maybe using the extender strap?
don’t forget to do a fresh threshold test if you move the strap position dramatically
Yes, exactly. I put one extension in on the right (I am mounting my CORE on that one) and thus have the even-more-asymmetric version of yours – small pod to the left on the back, big pod completely out of the bib-strap area. Works very well for me (for >1 year).
PS: And I always wear the bib-straps over the VitalPro chest strap, as that is what I have to do outdoors (with baselayer)…


 ) and thus have the even-more-asymmetric version of yours – small pod to the left on the back, big pod completely out of the bib-strap area. Works very well for me (for >1 year).