Tymewear owners - worth it?

My last test on the bike trainer was on 18 July 2026.

I’m noticing that my VE values differ between outdoors and the trainer. There’s also a difference in power between the trainer and the Assioma pedals.

I decided to do an estimate of the threshold value LT1/VT1, without a full test.

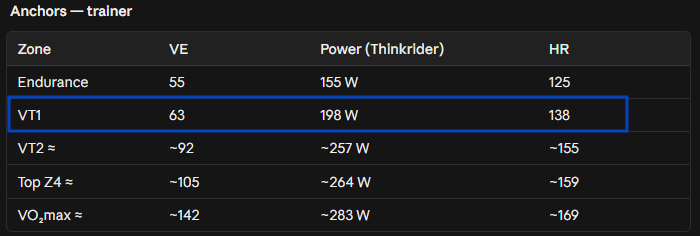
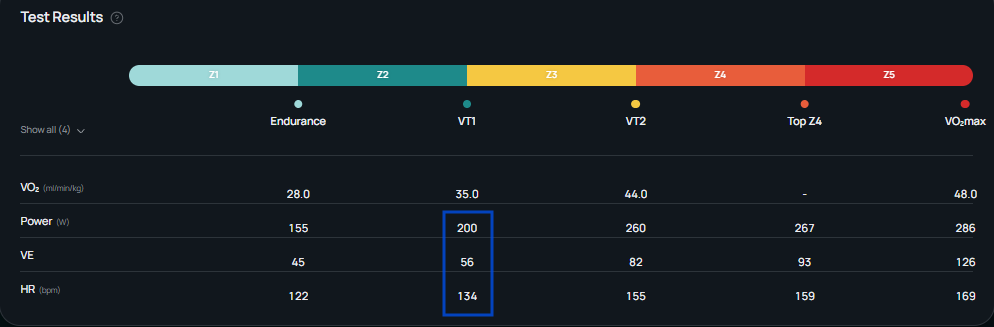
For comparison, here are the results of the full test on the bike trainer on 18.06.26

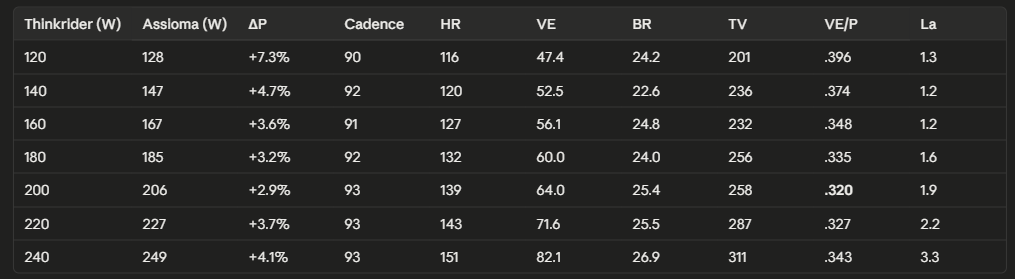
And here are the results of the estimate 15.10.26: Warm-up at 120 watts for 20 minutes, then 20-watt steps every 5 minutes.

Conclusions

LT1 (lactate) = 196 W. Baseline 1.23 mmol/L; LT1 = baseline + 0.5 = 1.73 mmol/L, read from a 3rd-order polynomial fit of the lactate curve.

VT1 (ventilation) ≈ 200 W. VE/P is lowest at 200 W; VE accelerates from 220 W.

Power and heart rate have hardly changed, VE increased by 7 units. (63 vs 56)

Interestingly, yesterday I was spinning easily and at 200 watts my VE was 73, while lactate was 2 mmol. Probably, if I had kept VE at 63, my power would have been around 170 watts and with a lower lactate value. The reasons can only be guessed at.

2 Likes

What lactate meter do you have? I have the Lactate Pro 2 but at 2euro per strip, I don’t use it that often :wink:. I don’t know how some folks keep on using strips like it is chips ;-).

I plan on doing a check also within a few days comparing lactate vs VE and my previous treshold test.

Strange behavior indeed yesterday. But that is sometimes my point. Using VE as a static number seems impossible because it variates between days. Using it as a guide during a workout or ride and watch drift or other metrics. Ok I guess? But if you look at TW workouts they propose, could you even do that? Guide your training based on VE?

And even lactate can be off from day to day, depending on how fresh you are or your metabolic state (food before, glycogen store in body?). I once did a lactate test with 3mmol as baseline…

Maybe one good thing about their treshold test is to see how endurance, VT1, VT2 are compared to your vo2max, as they give in their report. But for that you should have reached a high enough vo2max value, and I am not sure you can achieve that in that treshold step test. For me that was 290w but I know I can do higher for 5minutes when I would do it separately. So, should we use that vo2max value? I hope they improve their treshold zone detection so we can get better results.

TW should make more videos on how they guide trainings (with pros or not).

1 Like

I had a Lactate Plus, really expensive strips. Now I’ve switched to Eaglenos, the readings are the same, I checked both, plus we tested in the laboratory. But the strip price is about 3 times lower, and yes, I don’t economize on strips. If I see that the readings are “strange,” I immediately take a second one. For example, in this test 2 strips were “off.” But exactly the same thing happened with Lactate Plus.

Lactate definitely varies. It’s a misconception that it shows exact numbers. Not only do portable sensors have error. Lactate is a concentration, not an amount. And concentration depends on your blood volume (dehydration). The amount of carbohydrate loading also has a significant effect.

And that’s exactly how VE should be used - as a static number, as an anchor. It’s a reference point, and your power/pace already depends on your condition. Of course, VE is a range. But on intervals it’s quite possible to hold the target VE precisely. It’s not hard for me to adjust my pace even on roller skis, and on the bike trainer it’s elementary.

I compared the test results with gas analysis and TW on a treadmill. The threshold values and VO2 were identical, 60 ml/kg/min. Although in an interview Arnar mentioned that these are calculated figures. Maybe I got lucky. I don’t know.

TW knows a lot, having such a large data set. Everything in its own time. I think after Vincent Luis’s victory in Kona, who trains with the Vitel Pro sensor and did his stages under ventilation control, the hype will increase )))

1 Like

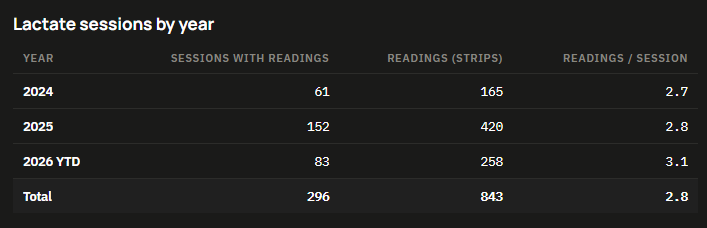
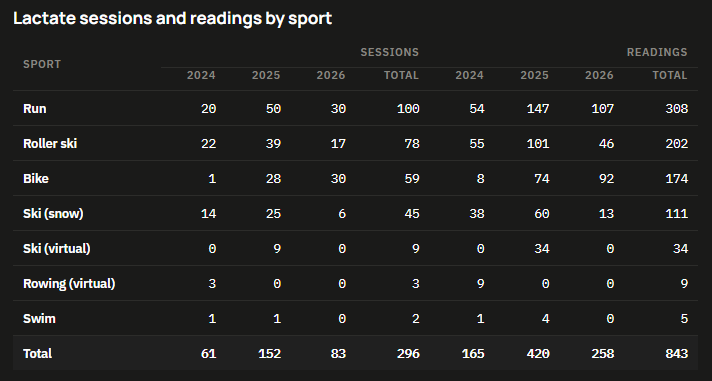
Since we’ve touched on the topic of lactate, I decided to calculate statistics on the measurements.
I got the lactate meter in 2023, unfortunately I didn’t keep records. I started recording from 2024. This count does not include “broken” strips. Their share is probably 5-10%.
It also does not take into account that my wife has her own device for measuring lactate, I don’t count her data here. But she has far fewer measurements, about 1/3 of my count. And it doesn’t include measurements for my amateur acquaintances.

So it turns out, on average 2.8 measurements per workout, but if you remove “tests,” roughly 2 measurements per 1 workout. Sometimes I do control measurements on easy workouts, but usually these are structured sessions. YTD I have 311 training sessions (including cool-downs and warm-ups at competitions), as well as strength work in the gym. It turns out that I measured lactate in every 3rd training session.

With the arrival of the ventilation sensor, the number of measurements I take has decreased, but I haven’t stopped using lactate - the goal is just not intensity control, but calibration of tests and monitoring the dynamics of metabolic efficiency.

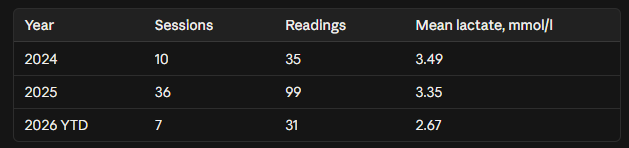
And about the 2/4 mmol thresholds. In reality, that’s not how it works. The mean lactate at LT2 intensity (RPE 7–8) — my lactate values are significantly lower. And overall the trend shows lactate decreasing. The max I’ve seen in running is 9 mmol, on the bike 10.5 mmol. Back in 2017, the max value in running in the lab was 12.5 mmol.

2 Likes

Yeah for sure! It was already remarkable for me that even before the race we did receive some short video’s from TW about his use of the vital pro. So when he won, I was thinking. Wow. Ok maybe this stuff really is good :wink:. What I do miss, is more explanation on how they have used it. Would be a lot of help if they provide some more detailed video’s on how to use it during training with some more real life examples. Question is. Did Luis during his race used VE or BR at the bike as a cap? Or just more on power and feel? I am curious…

Yes, VE should be used as an anchor. And I hope, with more use of it (still a newbie and not a long time TW user) I get more insights about the values during different rides and runs, and intensities. In my last 3 indoor rides, I have the feeling it becomes better in whatI would expect. But will get more insights when I do my test next week to compare lactate and VE data in a VT1 step test.

3 posts were merged into an existing topic: Integrated LLMs vs. Algorithmic Coaching: Utility, Guardrails, and Safety

One of our coaches attended a conference where TW and Visma also spoke, and they didn’t say anything about how the team and athletes train. Because nobody wants to share their “competitive advantage.”
Luis in his post-race interview talked about breathing rate, while the coach talked more about ventilation and that heart rate doesn’t reflect the real load. But I’m sure that Luis executed his stages relying specifically on ventilation.

Don’t try to rigidly “attach” VE and lactate values to each other. Both metrics have their own “freedom,” even if they’re measured correctly and the sensors didn’t glitch.
As for me, I use

  • VE as an intensity marker,
  • BR as an analogue of RPE — (a dose of stress, because the first hour and the last hour are different stress),
  • whereas lactate is more of a marker of metabolic improvement (lower at the same power).

But the foundation is still VE.
Because you have to choose one numerator, then all the other metrics become the denominator, and you can see how the final number changes.

3 Likes

10-10 147W 34.9
12-10 121W 31.4
13-10 177W 32.3
16-10 164W 32.4

My last 4 rides with power and just VE average. Last 2 pretty stable, and also the easy ride on 12-10 was after my half marathon so maybe some fatigue left. So. Ok. Getting better at this stuff :wink:

This is today’s, ride. VE and BR rising till 15-20min and then all went stable, even VE was droping with same average power untill the end (165W). (Also HR went down, 117 vs 115 on the end). So I just ignore VE in the first 15min and then body is warm and ready to check :wink:

2 Likes

Hello everyone, seeing all this discussion and remembering that I live abroad; I would like to know after all this time do you think it is more practical and reliable to wear Tymewear, since in my case I would not pay for their subscription , would it be worth it? or a lactate meter from Eaglenos that seems to have shown that it is worth the cost x benefit

Imagine you come to see a doctor. He measured your pulse and made a diagnosis and prescribed treatment for you. Or does he instead measure your pulse, measure your blood pressure, check your blood tests, look at the results of your ECG under load, and gather your complaints (RPE).

Assessing load and training effectiveness is not a single measurement and not a single FTP test.

But if I were put against the wall with a condition — either lactate or a ventilation sensor — I have no doubts that the ventilation sensor is far more effective in assessing both stress and load.

It’s not enough to have high thresholds — you need to be able to ride for a long time at those thresholds. This gives rise to the concept of durability. For cycling it’s fairly simple. A max power test on fresh legs, then 1000 kilojoules of load, and a repeat test. This is more or less known.

How to train “durability” — that’s where the realm of guesses and fantasies begins. But the logic stays the same: create fatigue at low intensity and finish at high intensity. But how do you determine duration and intensity? And most importantly — by what criteria do you assess improvements?

And if it’s skiing — that’s completely in the realm of fantasy. Ski until you get tired, then do X intervals for Y time. Speed depends on the terrain. All that’s left is heart rate.

Today I ran an interesting experiment.

Roller skis. Protocol:

  • 1 lap warm-up lap (zone 1, VE 85–95), record lactate
  • 1 lap control lap at race intensity (VE 135–145), record lactate
  • 4 laps at aerobic threshold, top of zone 2 (VE 110), record lactate
  • 1 lap repeat control lap = compare its metrics with the first control lap.

Here’s the results table:
Initially I planned to do 2 separate laps at race intensity, but already on the first one RPE was 7 and it became clear to me that it was “enough,” so I didn’t do the second one.

Now let’s assess the metrics:

  • Speed: +4.6%
  • HR: -0%
  • VE: -1.2%
  • BR: +8.6%
  • VT: -7%

But in the last interval “on fatigue” at 7m21s my BR and VT changed by more than 10% — and that was noticeable in RPE. I made the right decision not to do the second lap.

Speed even increased, but I spent noticeably more effort (lactate was 2 mmol, became 2.6). Possibly the sun came out and the track became drier, and speed increased slightly on it.

Lactate here confirmed that my intensity chosen by VE was correct. My baseline lactate is 1–1.3 mmol., My race intensity is in the range of 2–3 mmol, threshold 3–3.5 mmol. Lactate at VO2max 5.0–5.5 mmol. So I’m not a sprinter, not acidic ))

After warm-up 1.3 mmol (that’s almost baseline),
Intensity at the VT1 level was almost perfectly confirmed by lactate — 1.6 mmol, which is exactly the range of the top of zone 2 (1.7–1.9 mmol).

Heart rate didn’t change by a single beat.
VE practically didn’t change, even decreased slightly — it was hard for me to get back to a fresh state. However, BR/VT followed my RPE (5>7).

Overall, this turned out not to be an “easy long” stroll. I got 18% of the stress dose in the last interval, out of the entire working time of that interval.
2 Likes

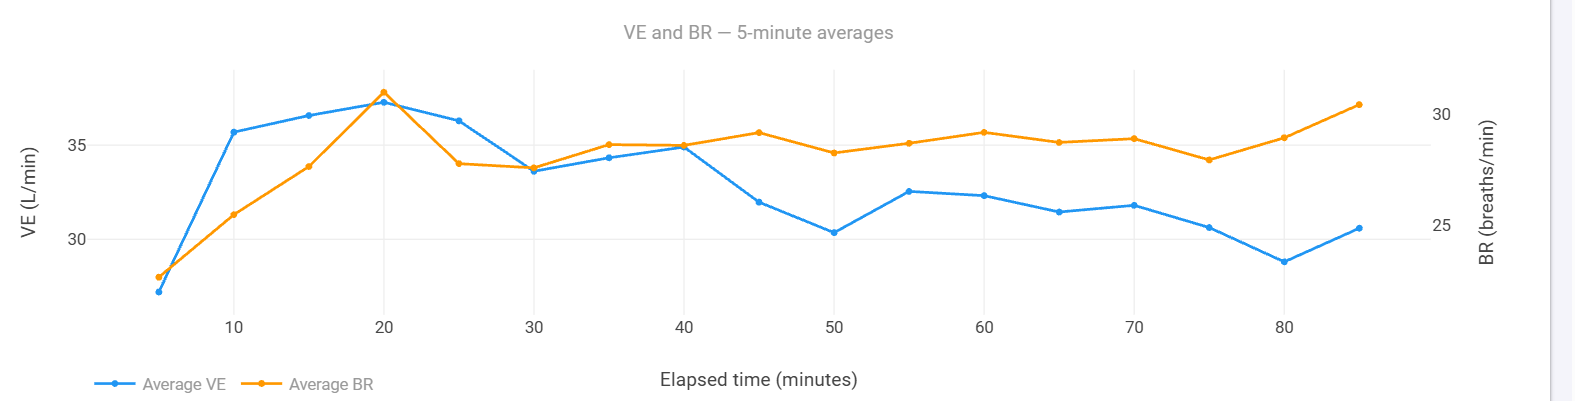
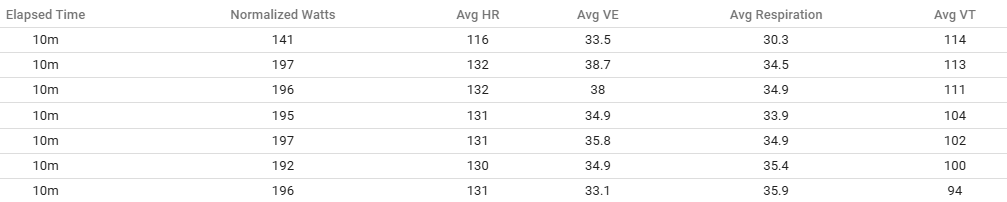
It always seems strange to me that VE goes down. For example in my ride yesterday. Did a 10min warm-up and then just 60min at VT1 power of 195W. As you can see, power and HR as stable as can be ;-).

Initial VE goes up, but that’s the warm-up and body needs time to get into normal state. Last 20minutes VE went downwards. But not that much, so no problem. Maybe my breathin pattern changes a bit, as tidal volume decreases…

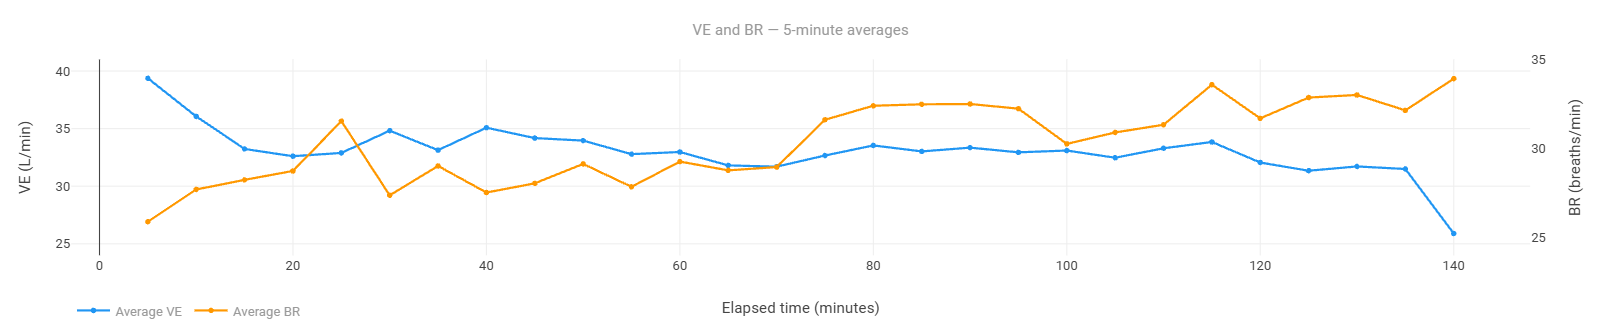
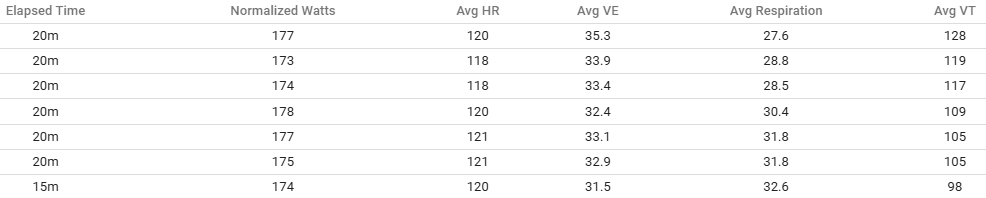
But like I said already, you have to give yourself some time to see the breathing data compared to different workouts or training. At least that is my observation. Another example from the day before. A 2h30 indoor ride around 175W. Same pattern, warmup-VE that drops and stay stable for the rest of the ride. Halfway, breathing rate went up.

If VE decreases due to a 16.8% reduction in breathing volume, while your breathing rate (RPE) rises more slowly (+4%), this indicates better economy (the body needs to remove less carbon dioxide), and if you want to maintain the stress level, it’s logical to increase power.

Your anchor is power, not VE. The value of ventilation lies precisely in this: manage power based on the VE reading, and manage duration through the rise in BR (this is your RPE, which increases as duration increases).

Over time you will see how your power changes depending on your condition and form.

2 Likes

What and how much do you eat, and when on these type of rides?

Ah ok. That could be the reason yes, I had forgotton my fueling strategy for those ride. Yesterday it was just plain water (one hour VT1 session). And saturday (2h30 ride) I had 60gram but starting with that after an hour or so. first part only electrolytes/water.

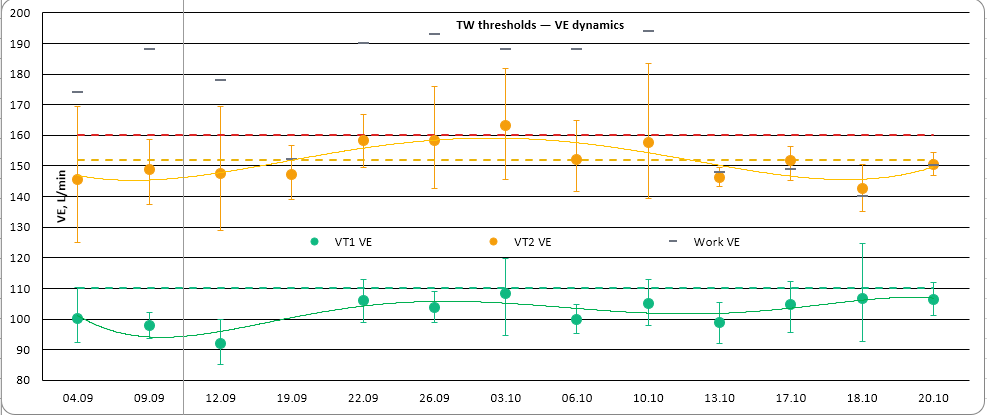
TW have announced dynamic threshold detection from training data and a dashboard that will show how thresholds change over time. But even well before that, an option was available in the dashboard for determining thresholds from workouts.

I decided to collect the accumulated data and compare it with what my test results were.
Here are two examples:

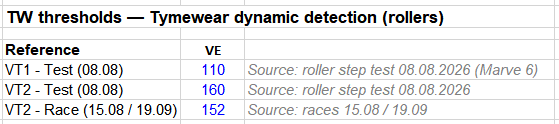
1. roller skis (my own testing and threshold determination, then a comparison of the test results with the TW data) - 13 sessions. The thresholds on roller skis I determined myself, and confirmed them in 45-minute control races (in fact slightly lower).

According to TW, the thresholds are consistently lower than the test — by about 6 VE for VT1 and about 10 VE for VT2. VT2 from the race matches TW’s (±2).

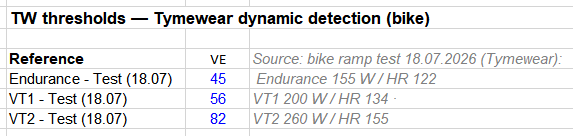
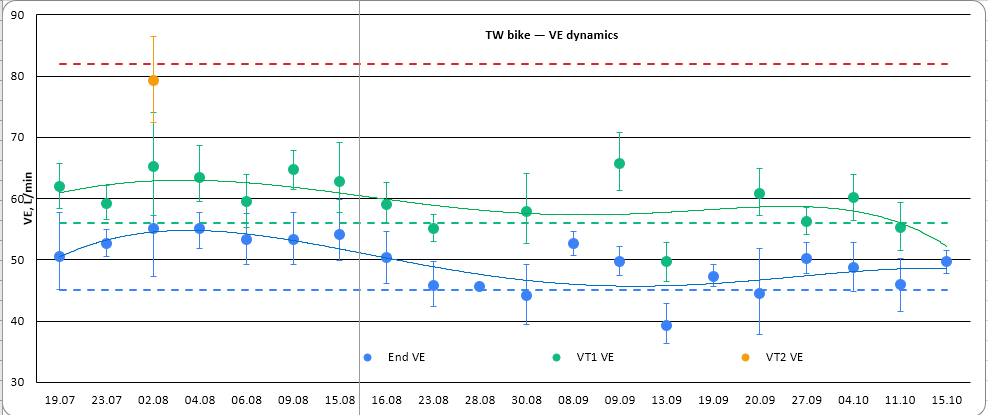
2. cycling: testing on the bike trainer, and the results of auto-detection of threshold values based on outdoor cycling. - 20 sessions. This is relevant in light of the discussions that outdoor and trainer threshold values differ.

On outdoor rides I have practically no intense sessions. Out of 20 rides, VT2 was recorded in only one. These are usually easy long rides (3–5 hours) in zone 1–2.

Conclusion 1: TW is ~4 VE and ~5 bpm higher than the test — the test thresholds are confirmed. At VT1, VE slowly decreases while HR rises — cycling form is slightly declining (cycling is secondary, long rides come after Saturday’s key sessions).
Conclusion 2: VT1 outdoors is stable in VE and HR. 13 clean sessions (without medium and 13.09): VE 60 ±3, HR 139 ±4. It doesn’t depend on the ride’s NP (r ≈ 0).

So, in fact, my results from the bike trainer test and the outdoor auto-detection differ by 4 VE units.

PS
Let me update. Probably the question is whether it’s possible to determine whether my form has improved.
I took my threshold VE, 45 for endurance and 55 for VT1, and assessed the power dynamics at these ventilation values. Adjusted for cadence.

This is the result I got.
image

But I want to point out that I don’t use power as an anchor or a fixed value. My anchor is VE, and I “adjust” power to these thresholds. And I don’t specifically train cycling.

3 Likes

Ok, so indoor lactate LT1 test done:

time power mmol hr
base
10 120 1,4
8 140 1,3 104
8 155 1,3 112
8 170 1,2 118
8 185 1,3 122
8 200 1,4 129
6 215 1,9 135

Did not have enough time so last step was only 6min. Also used my Vitalpro but something went wrong when I had to do a quick stop and then my software lost connection. So no VE data to confirm this data. But ok, no problem.

LT1 around 200w? 205? Online calculator gave 207W. But ok, I don’t need a fixed number. Now I can use this for my next VE treshold test and compare these tests. Tymewear set VT1 at 190w in my first bike test.

By lactate, yes, LT1 is between 200 and 215; for myself I’d take 200 watts as the top of zone 2.
And what is VE at the 200 and 220 watt steps? How well does that match VE? Lactate, heart rate, power — all of these can change. VE is unlikely to. )) Today at 200 watts I got 2.5 mmol. Last week I did an estimate and it was 1.9 mmol. VE in both rides was the same (63) but this morning I had a strength session for the legs.

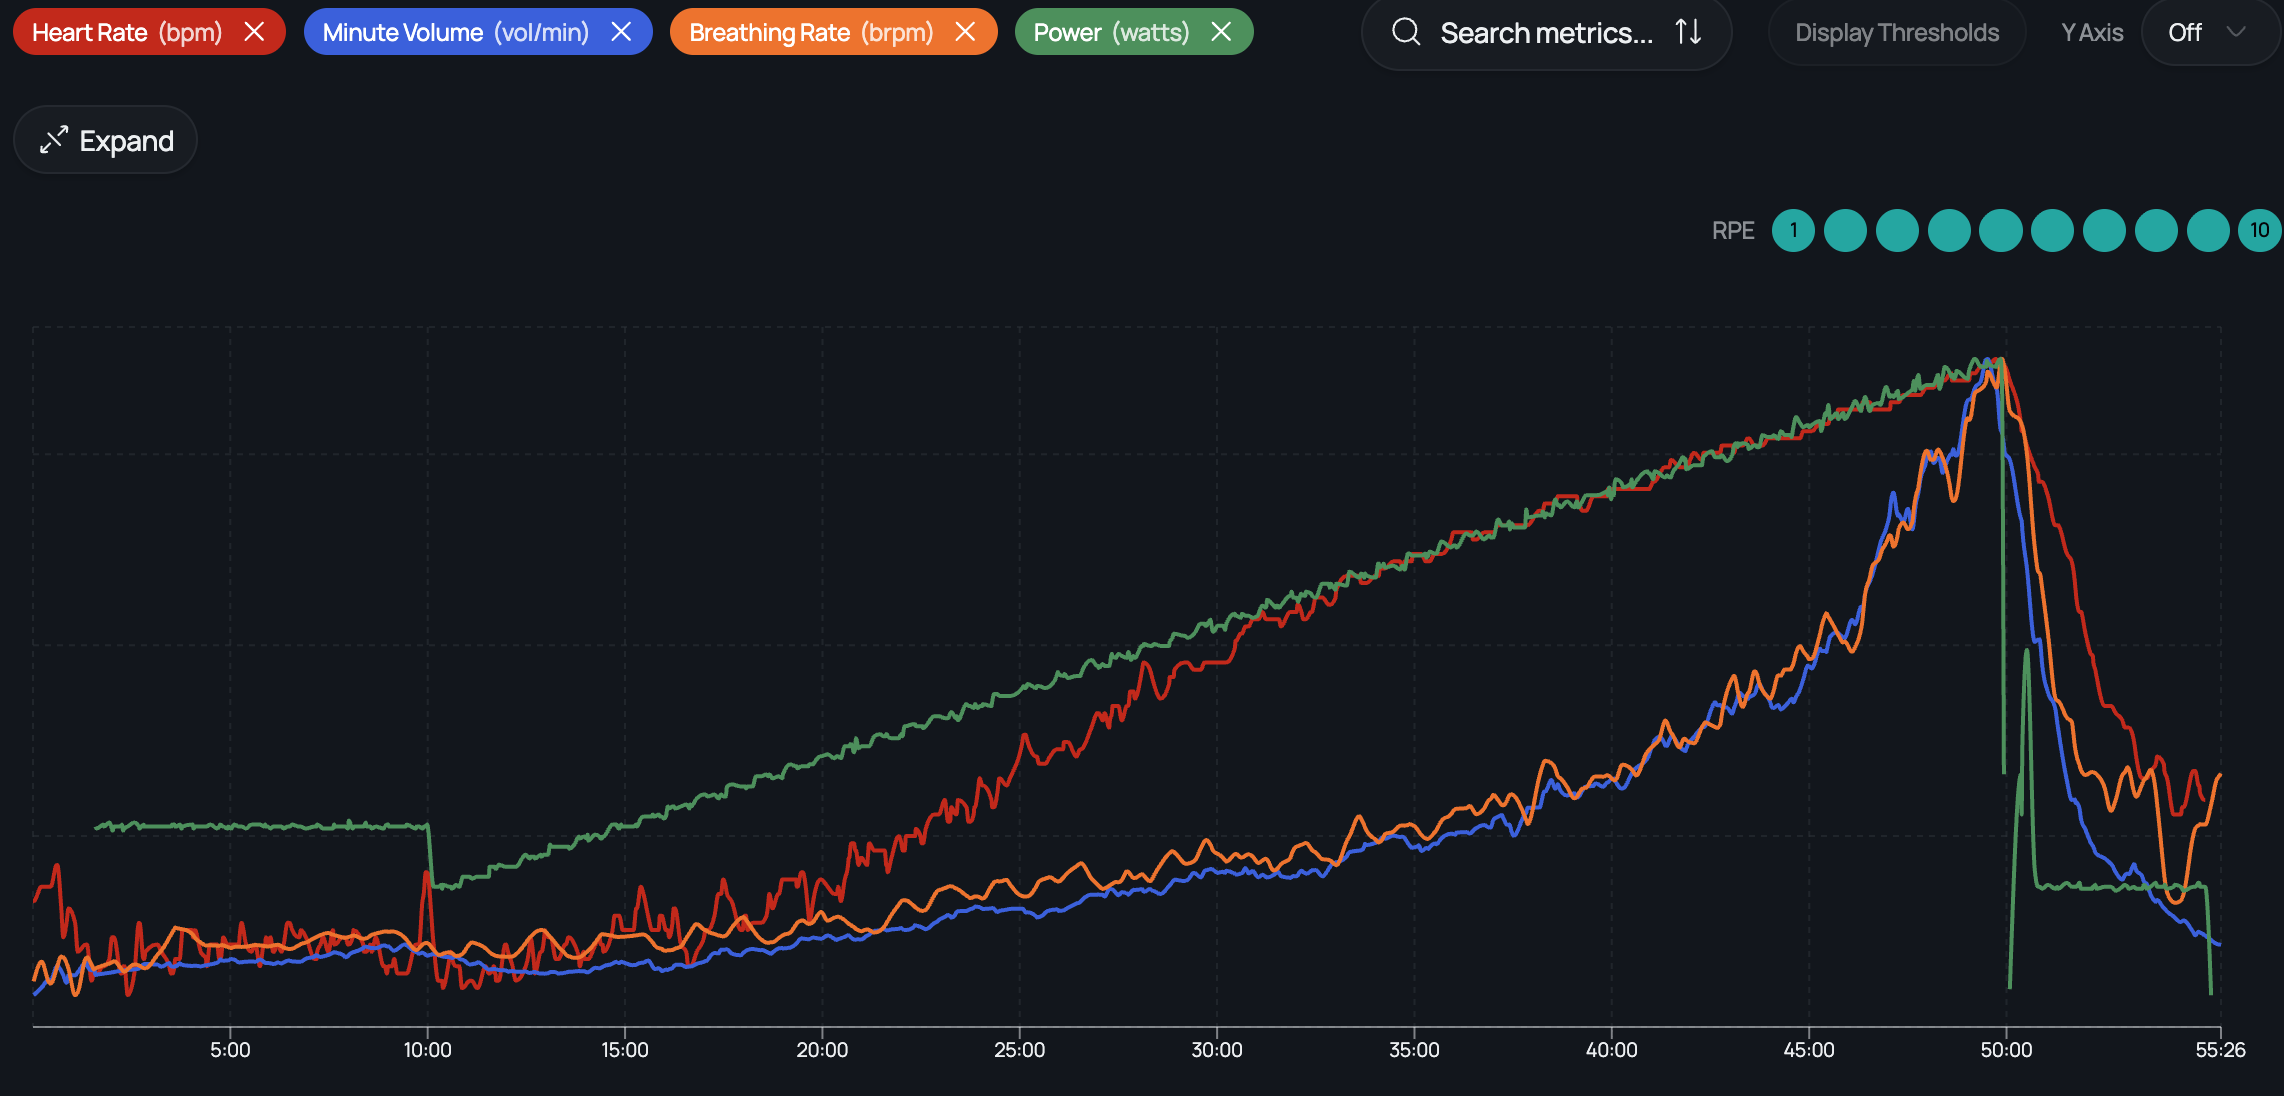
Hey, I also got one of these straps and followed the instructions that came with it for the threshold test. I did it on Tuesday and recorded the whole test on my phone through the app. I let my bib straps hang loose so they wouldn’t interfere with the strap.

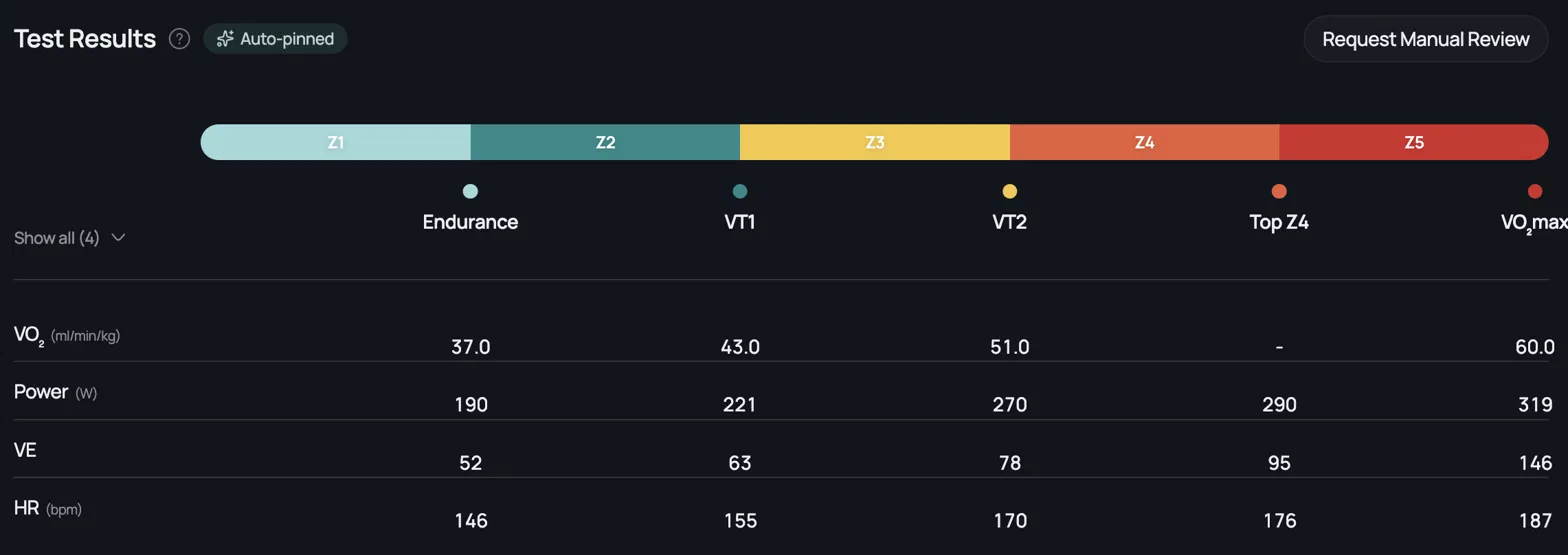
After the test, the app computed these zones automatically:

The Endurance point at 190 W looked too high to me. I’d expect it to start around 160–175 W. So I flagged it for manual review, which is scheduled for tomorrow (Thursday).

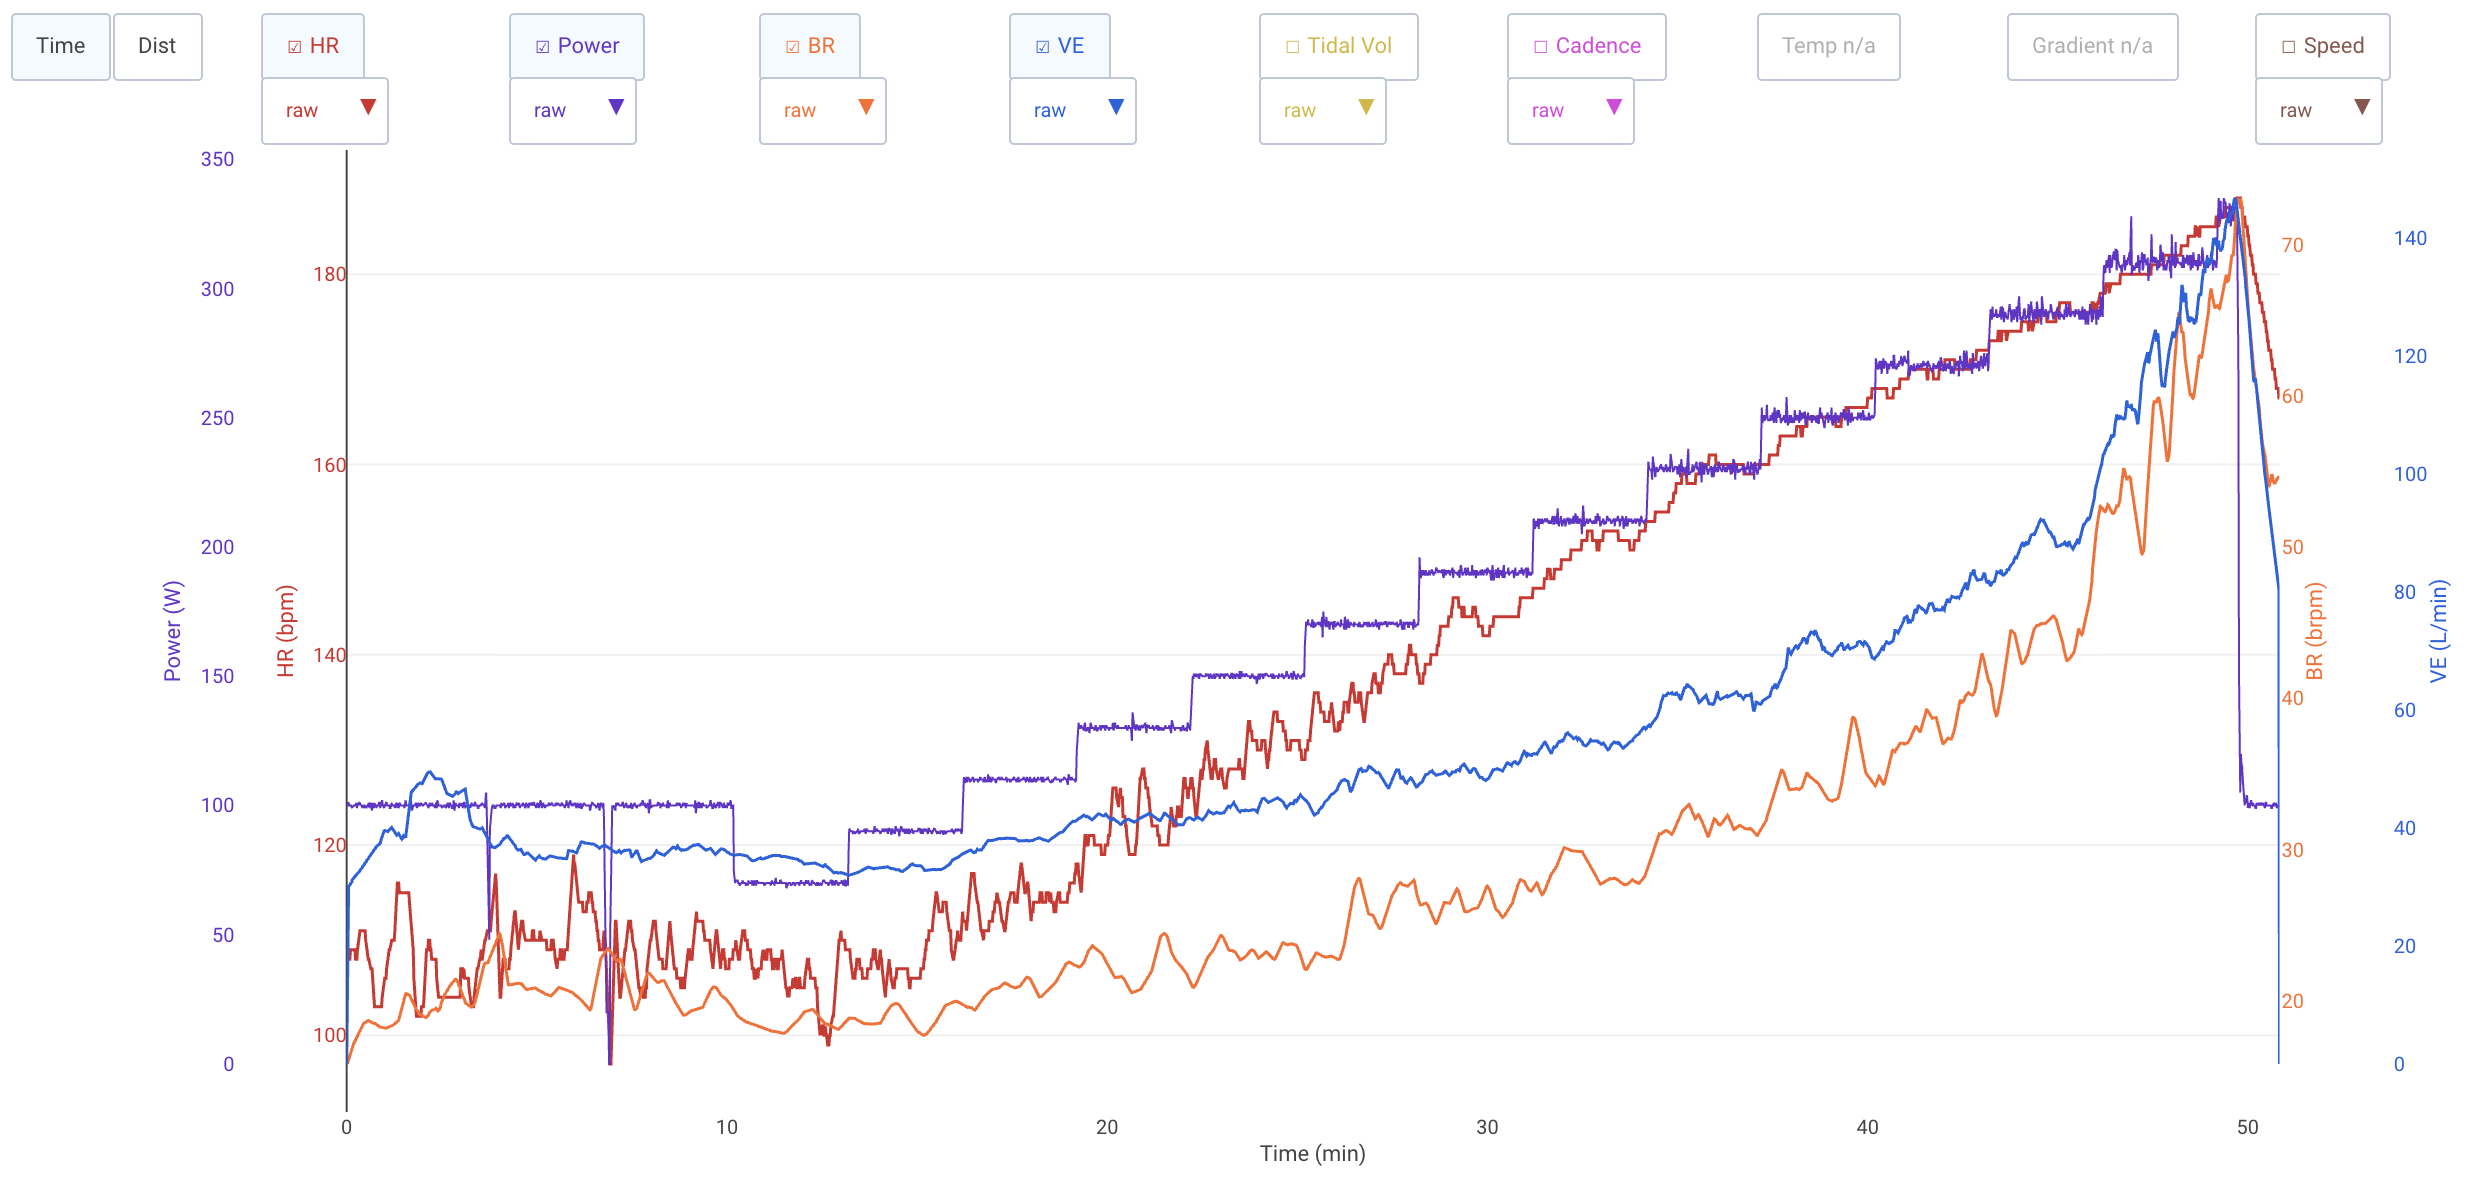
This is the curve from day 1, after downloading the .fit file and uploading it to intervals.icu:

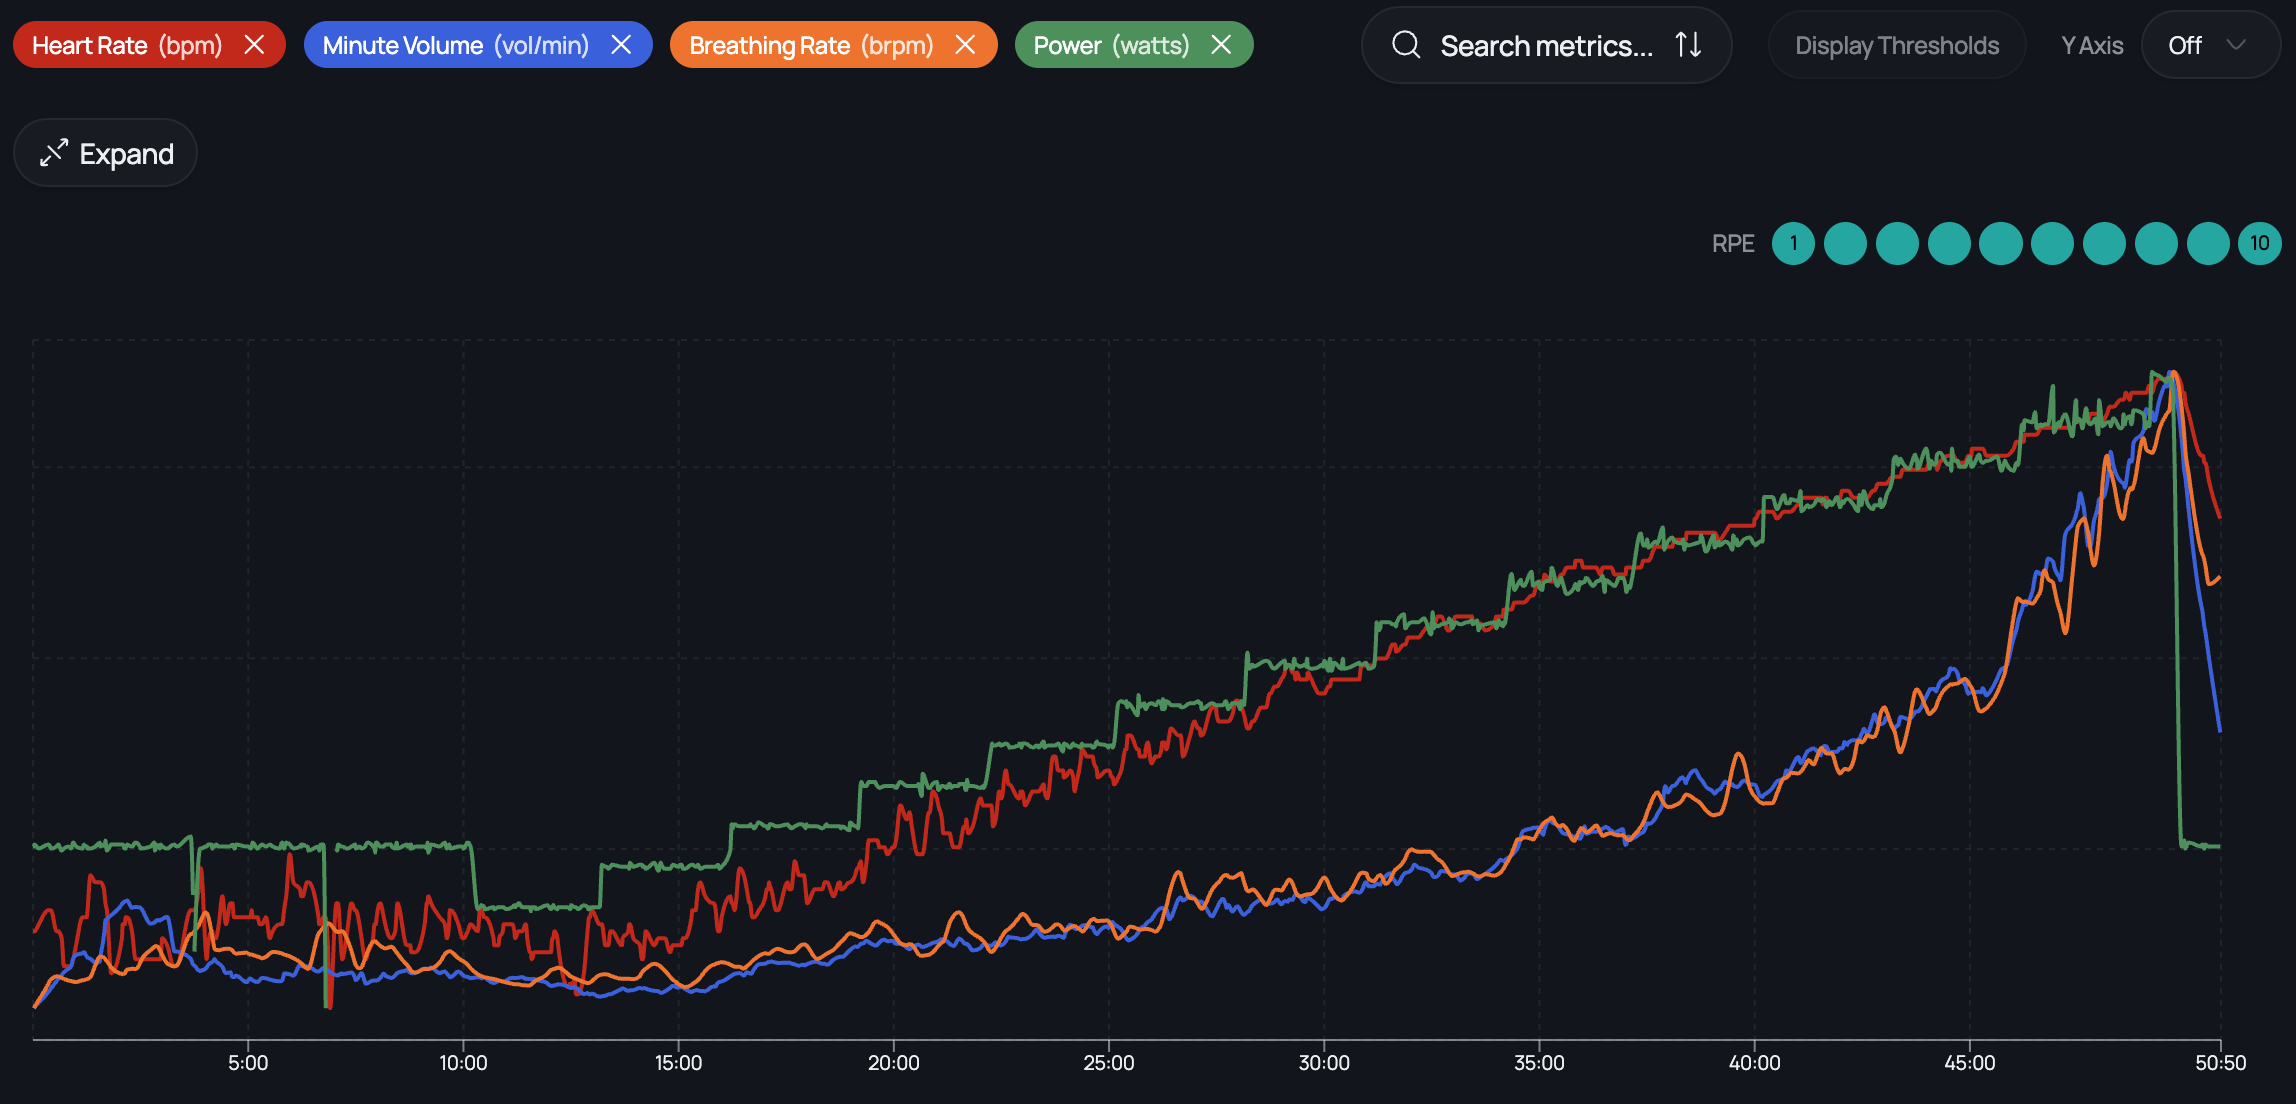
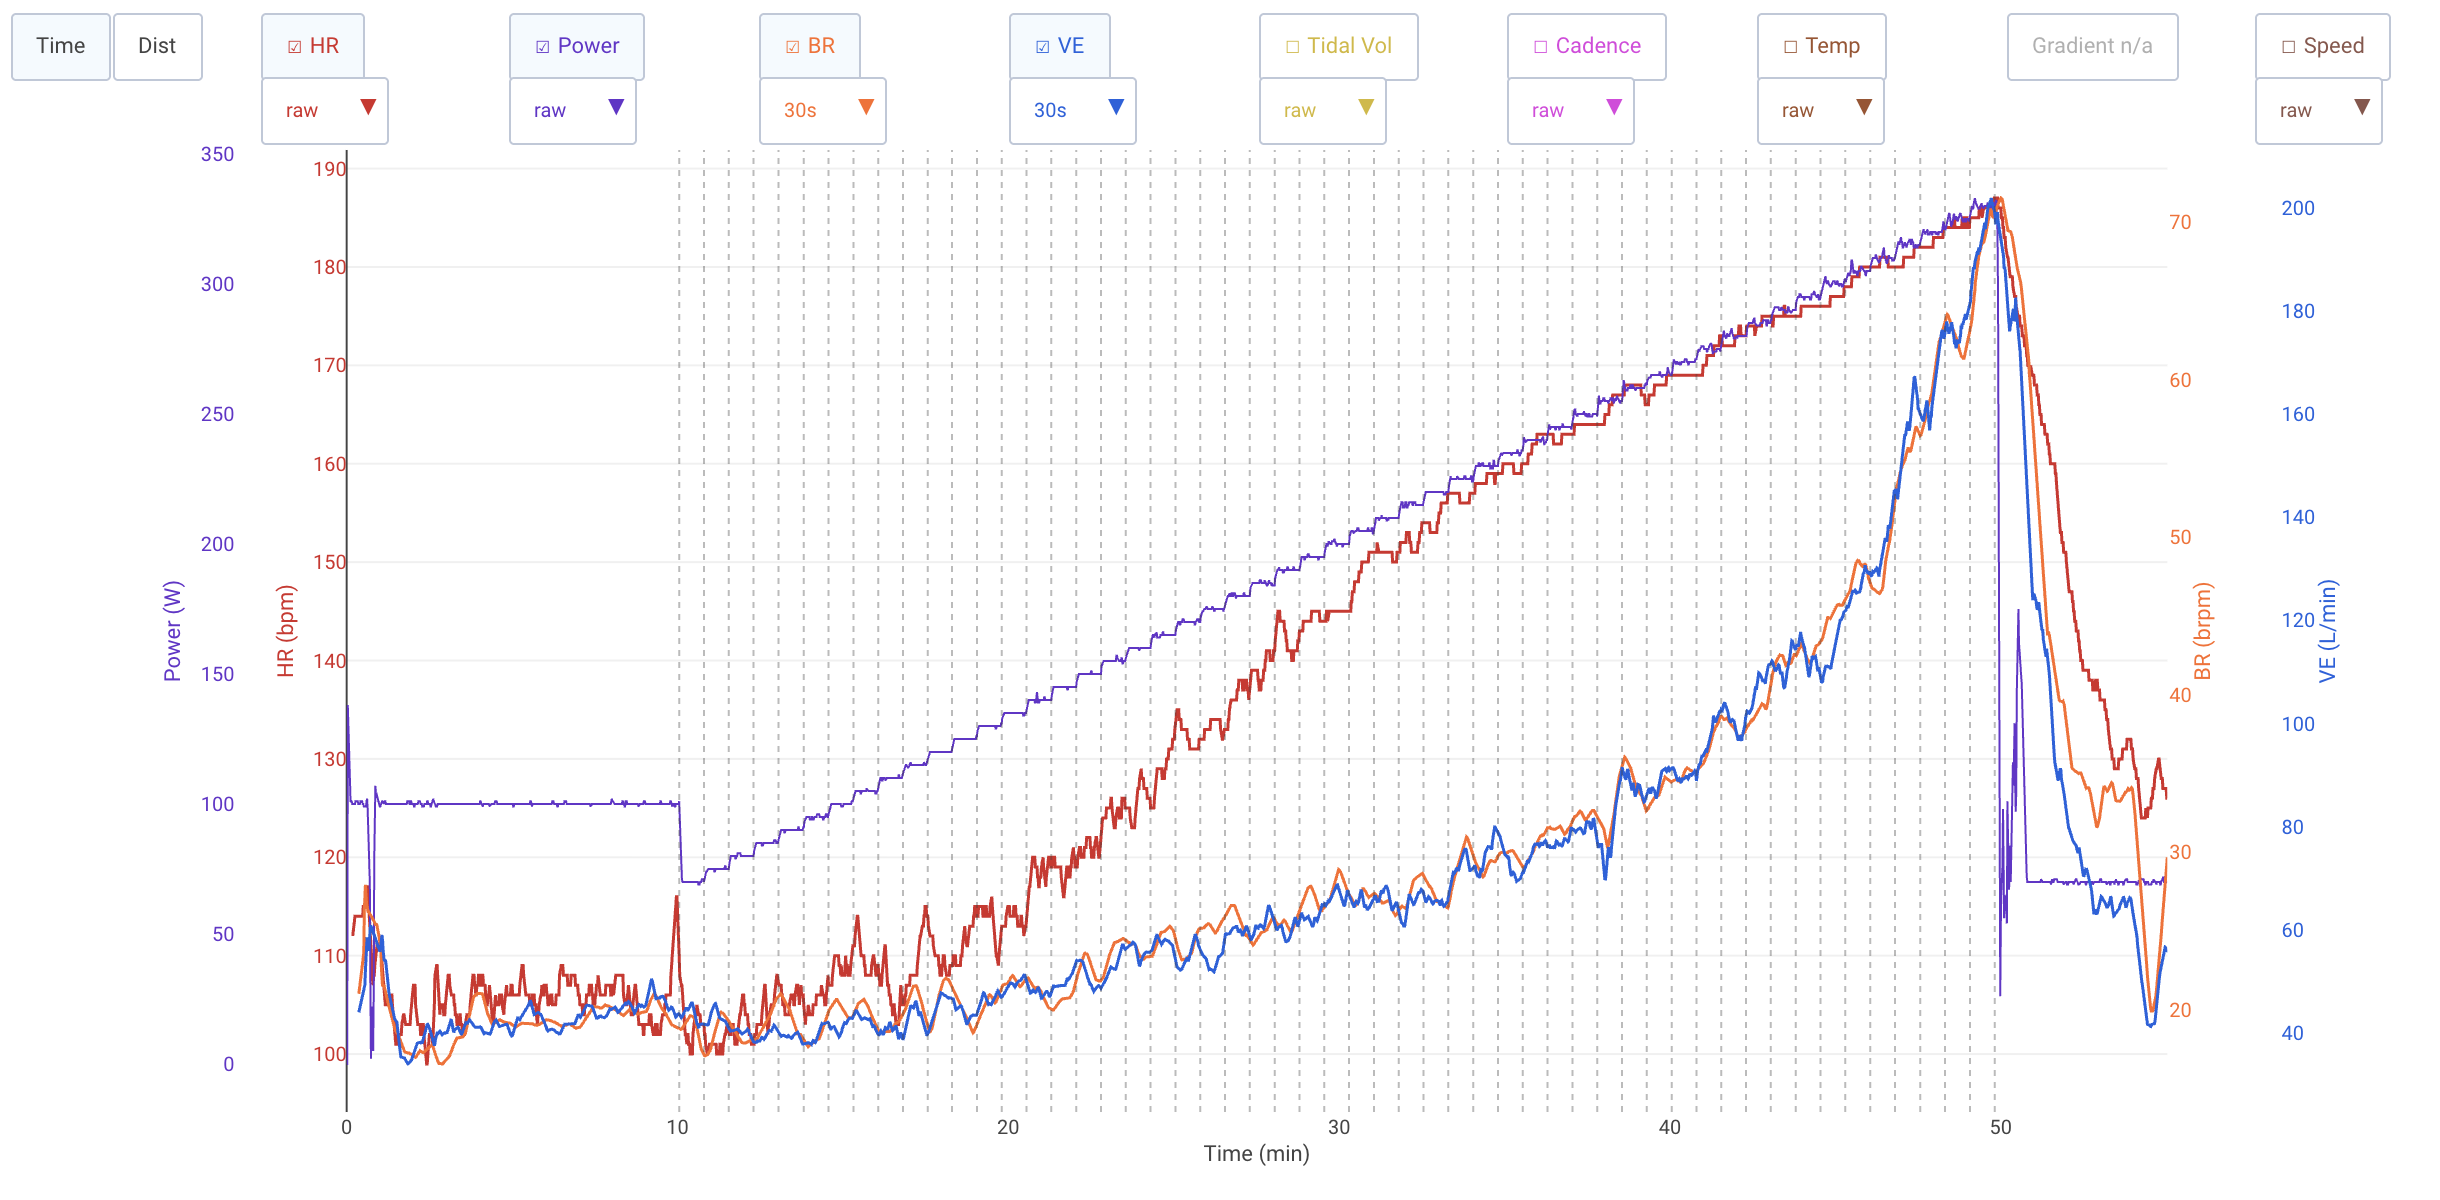
Today (Wednesday) I repeated the protocol: 100 W for 10 min, then a ramp from 70 W at 20 W per 3 min. This time I used 5 W per 45 s, which is the same ramp rate with smaller steps to get a smoother curve. I uploaded it to my Wahoo and ran it in parallel with the app. I wanted to go slightly above VT1 and stay below VT2 first, to see whether VE would line up with Tuesday’s test. It didn’t, so I went all in again, and this is the curve:

When I mark this ride as a “Bike Threshold Test” in the Tymewear dashboard, it doesn’t calculate zones for it. It is probably still processing yesterday’s test.

At 190 W my HR was 142 bpm on both days, but VE was 49 on day 1 and 60 on day 2 (+11, about 22% higher), with breathing rate at 25 and 26. At 270 W my HR was 170 bpm on day 1 and 169 on day 2, VE was 82 and 89 (+7, about 9% higher), and breathing rate was 40 and 35.

So the effort looks the same by HR, yet VE is off by 10-20% at the same power, and at 270 W the breathing rate differs by 5 breaths per minute. The only thing I changed between the two days was the step shape, and since the ramp rate is the same I don’t expect that to explain a gap this size. Strap position and clothing should have been the same, but I can’t rule out small differences.

How reliable are these measurements if I get this much variation from one day to the next? Does anyone else see VE moving by 10-20% between days at the same power and HR? I’m not sure whether this is still early development or what I should take from this?

You can contact support and ask thema this question with your data. They respons fast normally.

What I see is that for your second test, VE was already higher from the beginning. Was it on the same moment? Same fuel? Fatigue? you had same RPE?

Did you warmp-up before? 10min 100w ok, see it now. I am no expert so maybe @Timur has more insights…

1 Like