Towards Load & Strain Based on 10-pt Session RPE rating

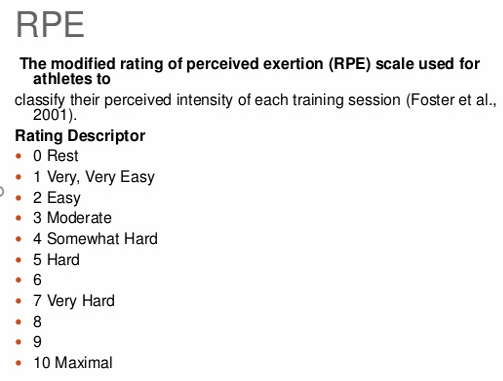
David and I briefly discussed the possibility of bringing in the classic load variable expressed from Foster’s 10-pt RPE scale. RPE rating is already available within ICU. So why not do something useful with it? Currently, its a static variable ; under the charting options in Compare tab, you have the option to chart RPE but it looks like the tool simply summates RPE across activities over a weekly period which makes little sense.

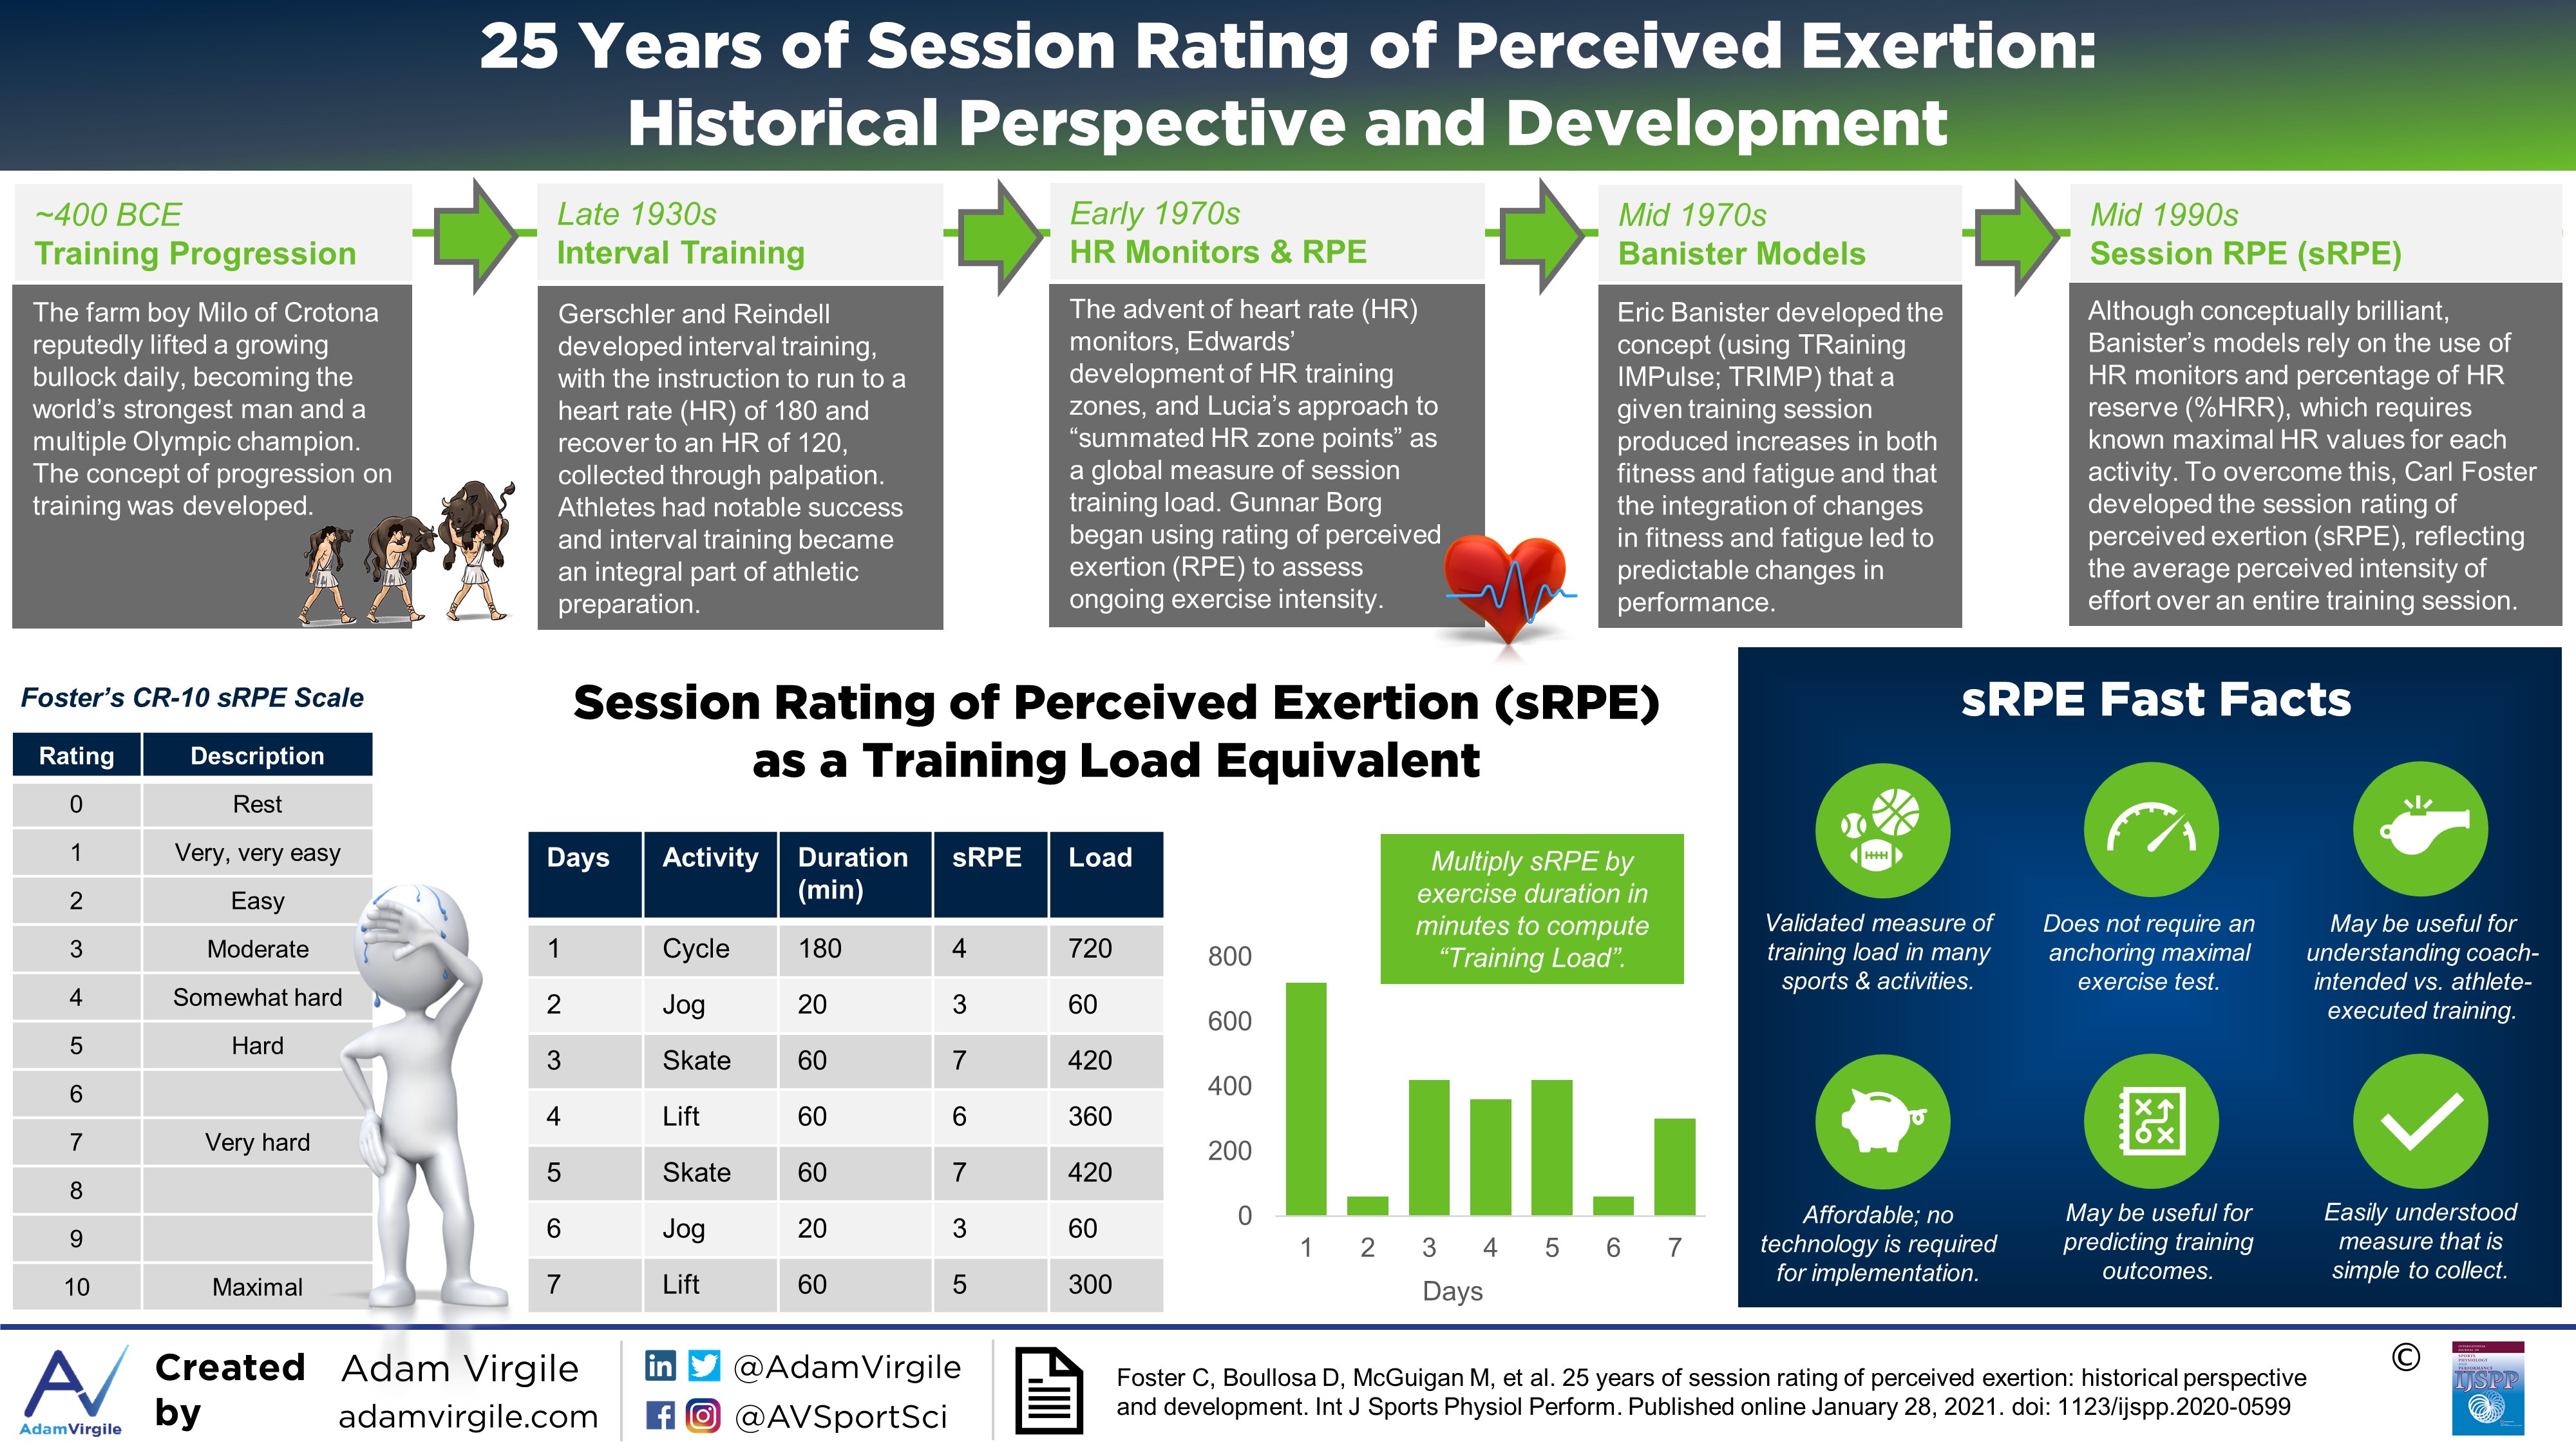
Just want to spell out the computation of RPE based load and stress based on Carl Foster’s research (see references) :

image

Activity Training Load (rATL) = Session RPE x Duration in Minutes

Here activity is specific to biking, running, skiing, lawn mowing, wall painting… whatever it is you do.

Session based RPE load is then tallied up for the week for a weekly load metric.

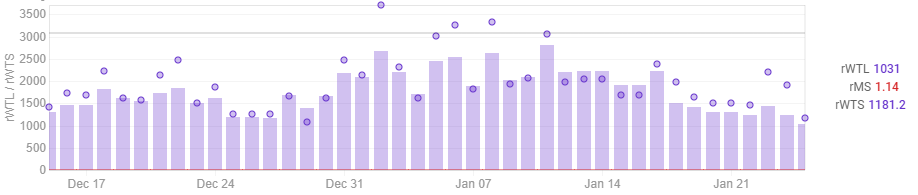
Weekly Training Load (rWTL) = ∑ Activity Training Loads

A weekly monotony score is calculated that expresses the daily variation in training load. Higher monotony means successive workouts resemble each other more and more and may signal the chance of over-reaching or improper loads.

Monotony Score (rMS) = Mean Activity Training Load / S.D Activity Training Loads

where S.D = Std. deviation.

Weekly RPE based strain is a product of weekly monotony and weekly training load. Foster et.al termed “strain” as distinguished from stress. Dr. Seiler did a Youtube video recently defining what is the difference in these two terms for those interested (see References).

Weekly Training Strain (rWTS) = Monotony Score x Weekly Training Load

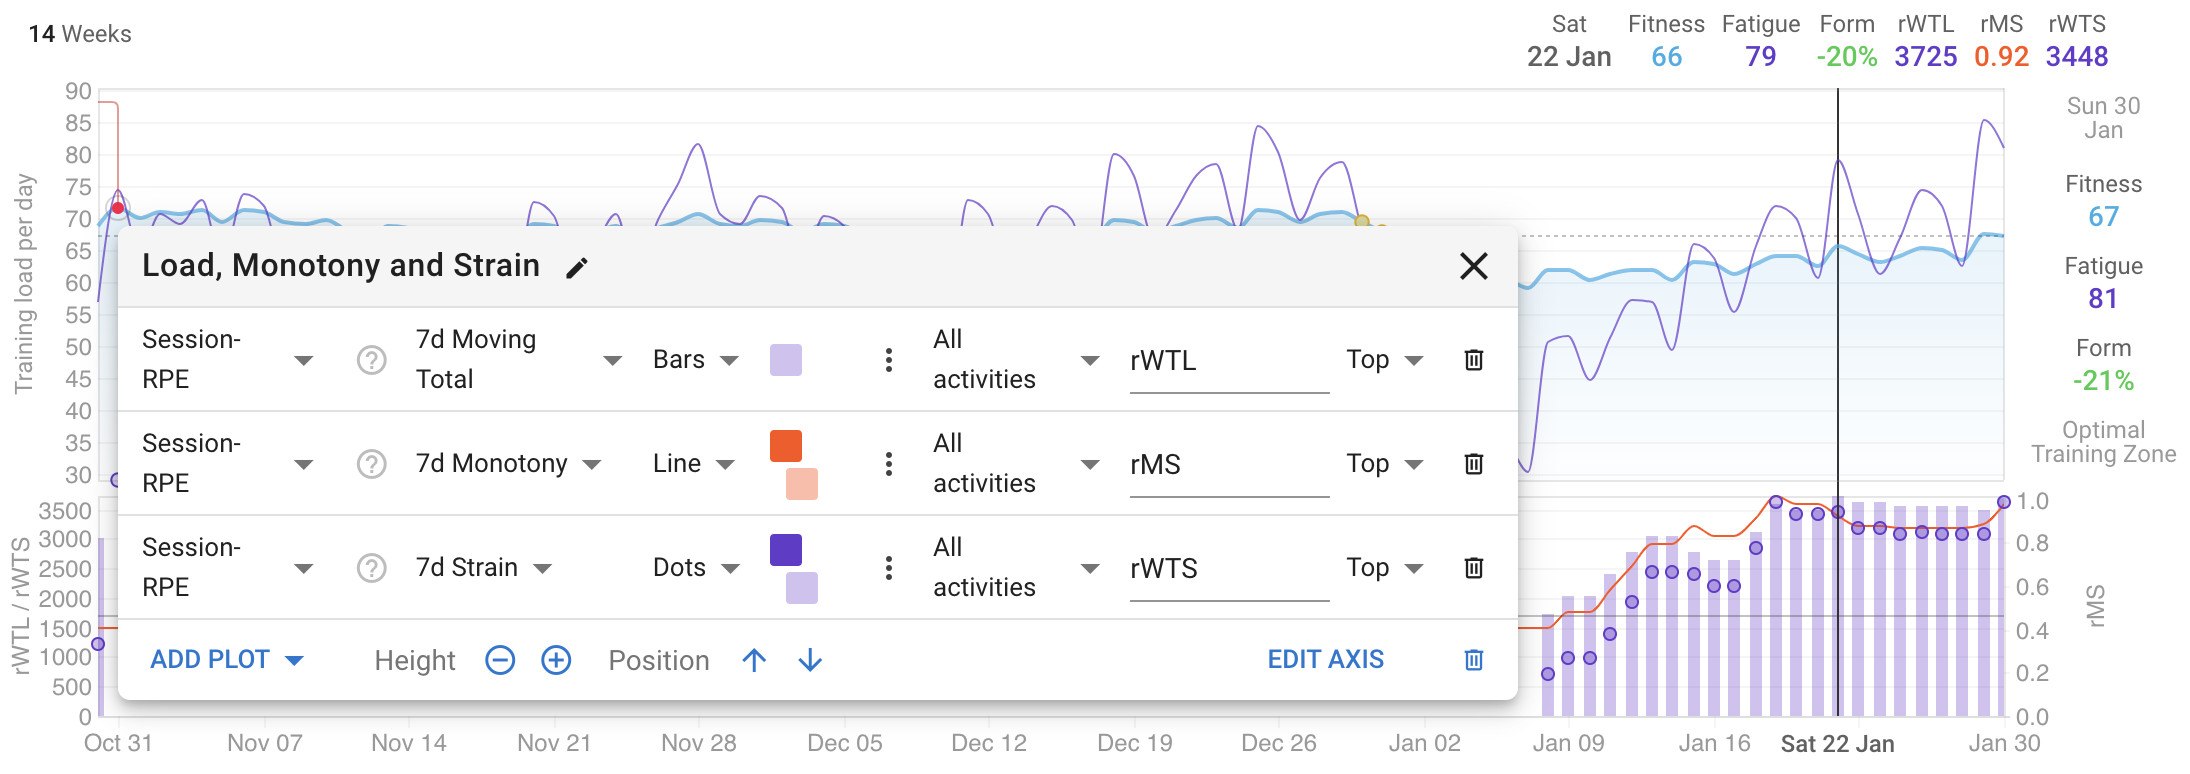
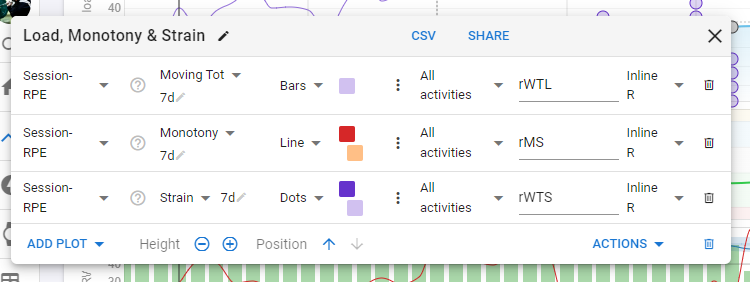
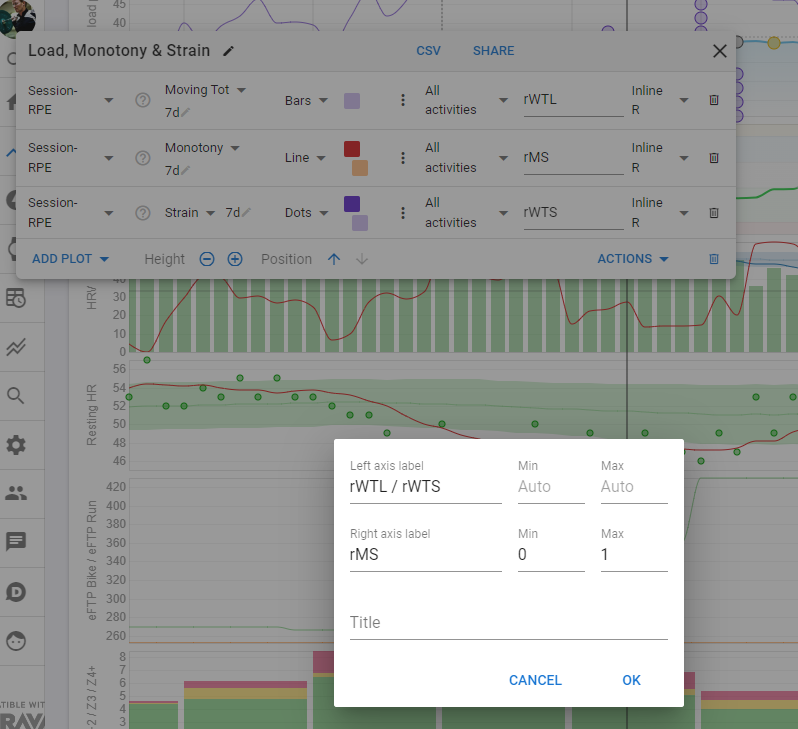
Then one can chart loads and strain week-by-week for specific periods or macro-cycles in the “Compare” tab.

This could be attractive as a third option for athletes who are training neither with power nor heart rate. Or simply a way to track the subjective “psychophysiological” component of load against the more objective externally applied load. Might be useful for those trying to achieve “polarization” in their training to be able to monitor monotony and loads.

Couple of other notes :

  1. I understand ICU’s RPE scale within each activity is based on Strava’s and differs from Foster’s 10-pt scale. For example, a hard is a “7” in ICU while its a “5” in Foster’s scale. So some thought needs to be given to this for those familiar with the Foster’s scale.

  2. RPE rating is easier for a continuous workout but run the risk of being somewhat blunt for intermittent workouts. These workouts would contain several passive/active rest periods. Either way, that’s left to the user to figure out; IMO as long as they are honest with themselves, its fine. Some guidance on this crucial topic is below in my Youtube video.

  3. Rating should ideally be done within a window of 10-15 minutes after completing workout to be an effective rating. Rating will be a conscious effort from user… Those activities without a rating will not be brought into the calculation data pool.

Thanks.

REFERENCES

Foster, C. (1998). Monitoring training in athletes with reference to overtraining syndrome. Medicine and Science in Sports and Exercise. 30(7): 1164-1168.

Session RPE Application 3-Part Series : https://youtu.be/Qmk4ABC_lkU

Load, Stress & Strain : https://www.youtube.com/watch?v=BwL9ehjgCsQ

4 Likes

I am going to have a look at all of this. Busy finishing off some important “bulk update” work.

Topical: https://twitter.com/AdamVirgile/status/1361491384314834947?s=20

1 Like

David, it would be great to have this metric. I have been using Session-RPE data and its derived indices, monotony index and strain for years with excellent results. They are among the closest to the reality I know and use. Currently I am still forced to use WKO5 just because I created some graphs on this to manage my athletes. But I would like to have them on intervals because soon I will only use this platform for everything.

2 Likes

David RPE on Garmin

1 Like

Garmin for the moment do not send that value in .fit file.

Bringing that up again.
That feature (sRPE) would really help me since I do not have a powermeter on every bike and it also gives you the opportunity to track e.g. core sessions or weight training.

2 Likes

Makes sense. There needs to be alternative ways of capturing stress, when power and even heart rate are not available. Its not objective (as often goes the criticism) but many tend to use sense of effort as a primary guide to pace or race against others.

1 Like

Quick question: Is the SD for all the training loads included in rWTL?

I have had a shot at adding the required stuff to Intervals.icu:

I am not very familiar with this and haven’t been capturing RPE for my own rides for very long. @Vito_Nacci @Coach_Ron and others interested in this topic please check my work. Tx.

1 Like

Sure david with pleasure. I’ll send you feedback in the next few days as soon as I check the data of all my athletes. Thank’s for your job. I take this opportunity to ask you if you have changed the formula of the calculation of cv7% on HRV because now I find it more correct.

David quickly saw my data and there are errors in the strain calculation, too high, check a little. The rest seems to me to be fine

Tx. The strain is currently just the weekly load total * monotony … Should that be the sum(daily load total * monotony for the day for last 7 days) ?

I haven’t made any changes to that. Are you saying it is working now or that it needs to change still?

CV7% gives me more reliable data than a few weeks ago, I don’t know why, I keep it monitored a little longer and in case I tell you. For Strain it is sum (…), sorry but since using intervals I got a bit rusty in programming, I’ll post what I created for WKO5, the pages in their library I made it myself. See if you get something else I dedicate a little bit to redo the formula

athleterange({startofweek(begindate):startofweek(enddate):7},{startofweek(begindate):startofweek(enddate):7}+6,sum(rpe*(movingduration/60),“week”))athleterange({startofweek(begindate):startofweek(enddate):7},{startofweek(begindate):startofweek(enddate):7}+6,sum(rpe(movingduration/60),“week”)/pstddev(rpe*(movingduration/60)))

2 Likes

I’ll use my data in WKO5 and see how it compares to here.

1 Like

Tx. As far as I can tell I have the same as Vito but thats from reading the WKO online docs not experience with the software.

@david You should change the axis scale to put two, in order to make the graph more readable. This could already help

Hi @david Sorry that I have not logged into the forums for sometime. I’ll need to add RPE values and test how it runs. BRB

1 Like

@david

  1. I compared the sRPE based load values and weekly monotony against an excel spreadsheet that I use. The daily/weekly load Intervals.ICU match.

  2. The issue when trying to validate weekly monotony scores and weekly s-RPE total load and strain (or stress whatever you call it) is that those options are not available in Activities tab for table header. I think thats because you have not yet designed the activities list to consolidate activities by week, so I’m ok if this a future upgrade we can expect.

  3. The Fitness trend plots can be employed to cross-check totals but it looks to me as if it consolidates those totals for all activities combined, not specific sports. I think its useful to have Fitness trends filter variables and plots by activity type, especially if you have cross training activities that don’t add any value to sport specific training. You can do this easily in Golden Cheetah. Maybe I’m overlooking something so please feel free to direct me on how to do this.

Another feedback relating more to terminology. I’m a bit confused with RPE and session RPE. I think they should both mean the same thing and is a single digit number input from user. The Load is the Duration x s-RPE so maybe “session RPE” should be re-termed “s-SPE load” to avoid confusion with the other Load metric available?

I’m also confused with “7D monotony” and “7D strain” when by definition, these metrics are calculated on the basis of a week. Unless you are going to provide another option (like 14d or 21d) , IMO I feel they should simply be left as “monotony” and “strain”.

1 Like

How do you put something on the right axis. Tried to replicate @david with this:

However rMS does not show up on the right axis:

Tried setting the axises here: