Seems the current term is Arbitrary Units, but RPE Load seems suitable.
Session RPE was based on one session assuming there might be more than one session for the day, so RPE Load would be the total load for the day.
Seems the current term is Arbitrary Units, but RPE Load seems suitable.
Session RPE was based on one session assuming there might be more than one session for the day, so RPE Load would be the total load for the day.
Ok I have added “Session-RPE” as an activity field (shows on summary page and in activity list) and plot for the /fitness page. Will deploy Sat AM (GMT+2).
Swapping out TSS for this everywhere in Intervals.icu will have to wait before anyone asks 
Awesome, thanks.
I am implementing this. Do you have a good blog post or similar that I can link to for the help popup?
ACWR is live now. It is available as a plot on the /fitness page. Session-RPE is also there but that will only work from Sat AM (GMT+2) when the server side of this is deployed.
That great David, thanks!
The following link describes it pretty well: Acute:Chronic Workload Ratio - Science for Sport
Thanks again!
Gr Johan
Really happy with this metric!
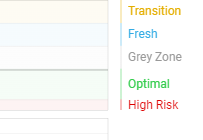
Is it possible to add some bands to it like you did with “Form%” metric?

The bands then should be:
'< 0.80 - [GREY] under training and higher relative injury risk
'0.80–1.30 - [GREEN] optimal workload and lowest relative injury risk; the safe zone
'> 1.5 -[RED] overloading and highest relative injury risk
Aim ofcourse is to stay within the Green band
Thanks again!
Gr Johan
I wrote about this way last year. You can follow my notes for implementation.
I had forgotten about that thread from nearly a year ago. Intervals.icu has session-RPE now but as you point out the RPE scale isn’t the same as Fosters. I will add Monotony Score (rMS) and Weekly Training Strain (rWTS) as soon as I can. Then it should be possible to plot all this in /fitness.
@Johan_Barelds I am going to make it possible to add colour scales to plots soon.
I’m finding that when my form is in the Optimal zone the ACWR is over 1.5. In other words, Optimal Form is high injury risk in ACWR. Not sure if this is always true, or a result of my particular training status. But at least some of the time, the predictions are conflicting.
Thanks David.
Thanks David. Much appreciated! 
Sorry didn’t know where to ask this. As Michael_Jasper pointed out, I find that my form is optimal when my ACWR is over 1.5 . How do others use form and ACWR?
Is it possible to get a plot of ACWR for a given activity? When I add a Activity Type filter to the plot nothing changes
I just found this today while looking for discussions on injuries because, you guessed it, I injured myself, unloading the dishwasher of all things.
I’m going to use ACMR to keep my eye on the ball, reminding me to plan my efforts reasonably. Susceptibility to injuries is not an absolute of course, not like power or cadence or heart beat. Doing X effort will not guarantee an injury. But then neither are fatigue, form, or fitness, absolutely guaranteeing X increase in watts for Y effort over time for example.
I’m no great athlete but I can sure injure myself like one. I’ve been here before and I’ll likely be a month or two in physical therapy. Hopefully paying attention to ACMR will give me some early warning when I’m overdoing it a bit. Graphing that today I found I’ve been pretty much at 1.5 steadily or often. If I had been paying attention…