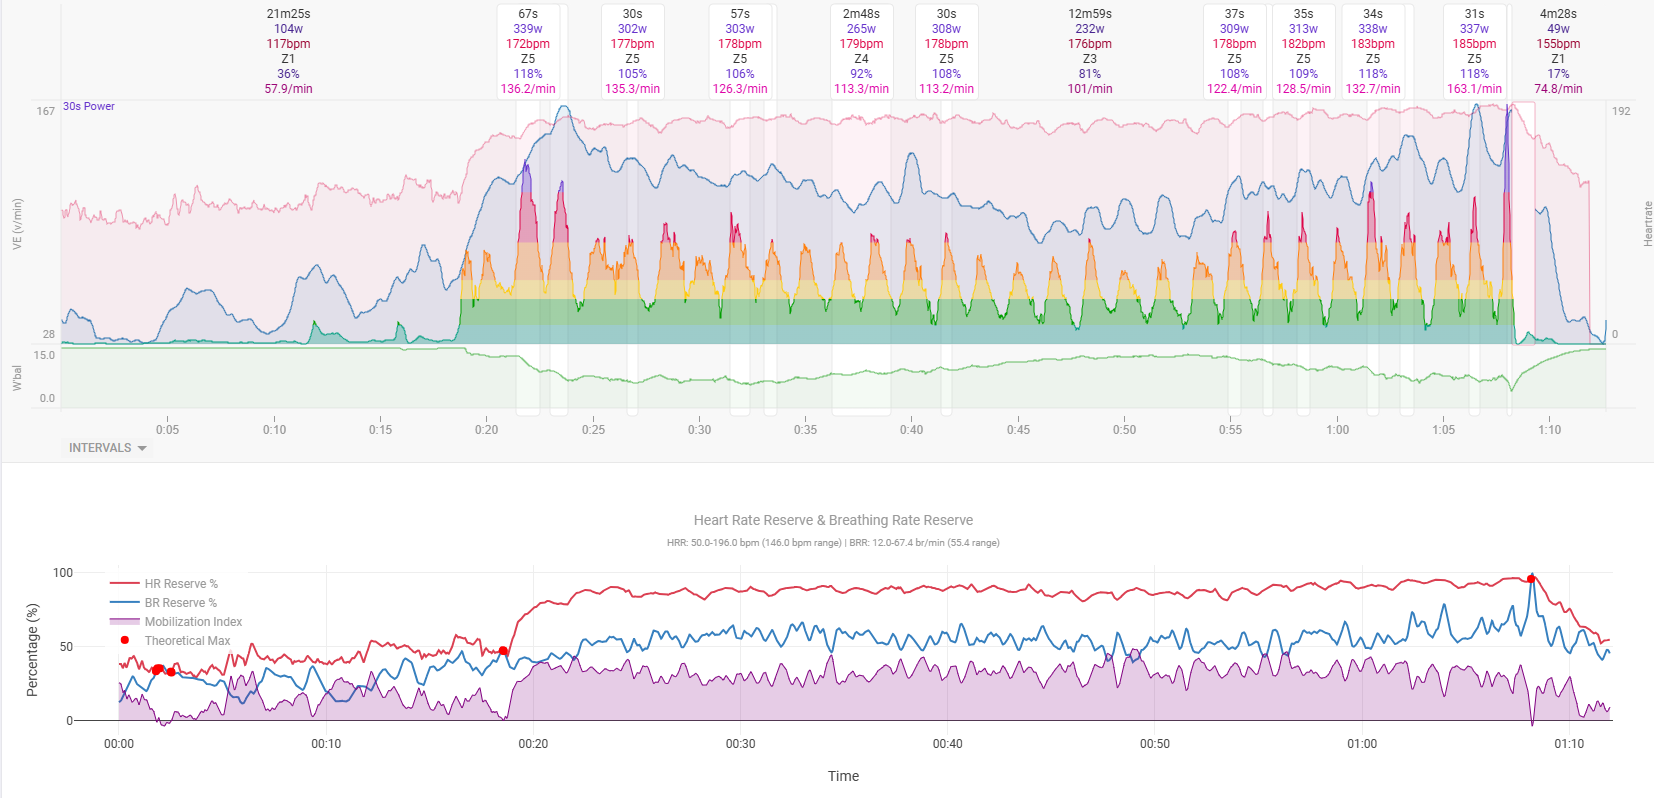
Tymewear posted an article discussing The Mobilization Index, a metric comparing HRR and BRR and having an indicator of stress during a workout.
Of course such a visualization is preferably displayed during a training on the garmin, at least being able to visualize the MI in Intervals after the training might give some ideas what happened and seeing when the athlete was cooked…
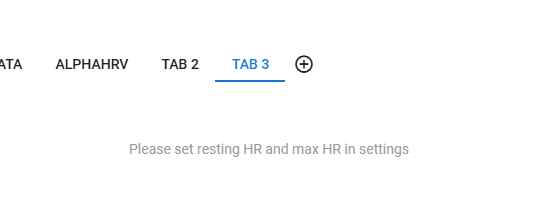
Is this possible in Intervals - or is something missing (e.g. is there a field to enter max BR??)
This can be done in Intervals.icu. First you need to add a custom activity field “Max BR” to the sport in /settings. The value will be copied on to activities for the sport when they are analysed (like FTP etc.).
Then you can use max BR, the respiration and heartrate streams, and the athletes max HR to create a custom activity chart using Javascript and Plotly.
Or you can use max BR and the respiration stream to create a custom activity stream “BRR”. This can be plotted on the activity timeline with the existing HRR% stream on a custom chart. This is probably easier than Plotly.
But I think we will probably add “Max BR” (and BRR%) as built in things soon, so wait a little bit.
@david you are absolutely right - the Resting BR is not provided in the app. Perhaps it might be possible to determine it just with the iPhone app and enter the value somewhere in the workout profile?
I will just wait for your possible implementation, because I am not that good with javascript an Plotly…
Also interested in plotting this. I guess the way to get a resting BRR% is simple to rest, record it and enter the lowest smoothed value as a static datapoint.
Not the original ones but the links in the post Quoted by @JakaSpeech are spam. @JakaSpeech should check his device for spamware!
I’ve seen this a couple of times before. When people quote a post with links, the links get hacked by something on their computer/mobile.
I removed the hacked url’s.