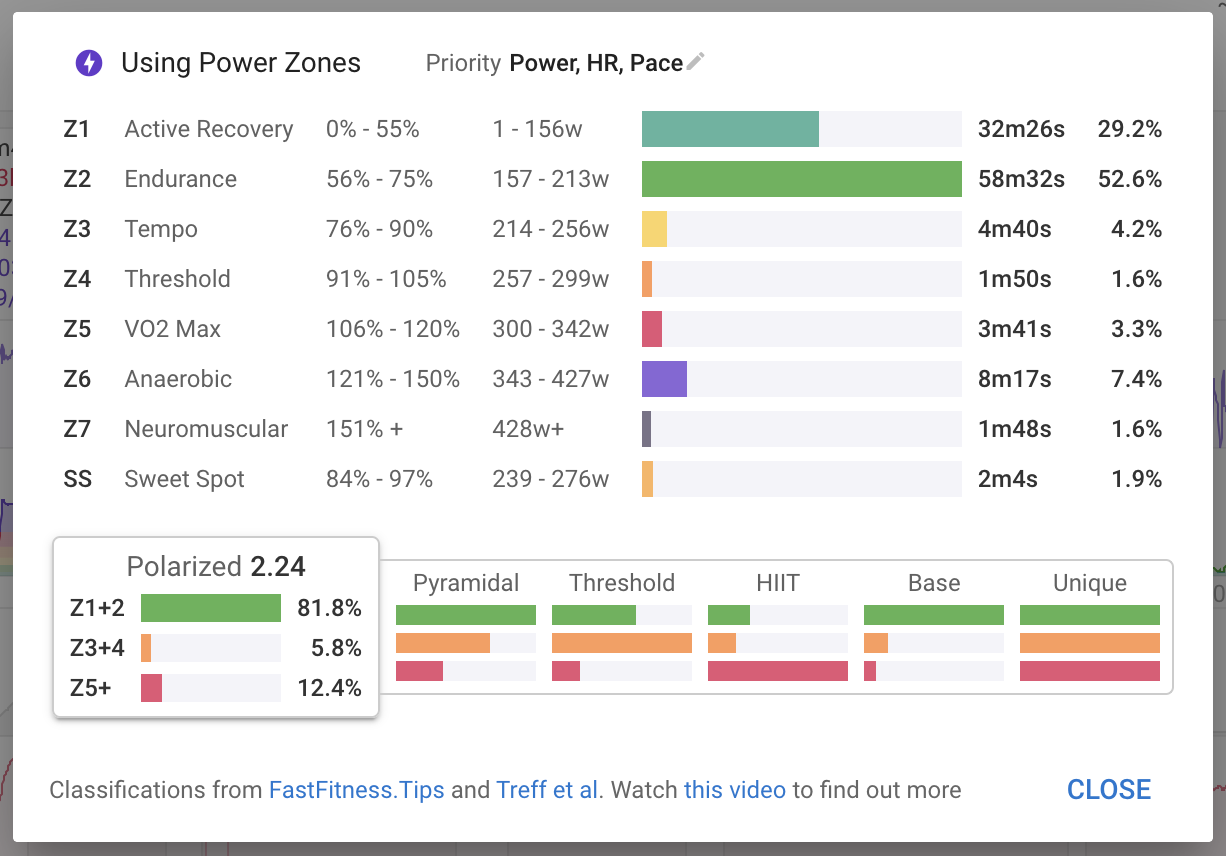
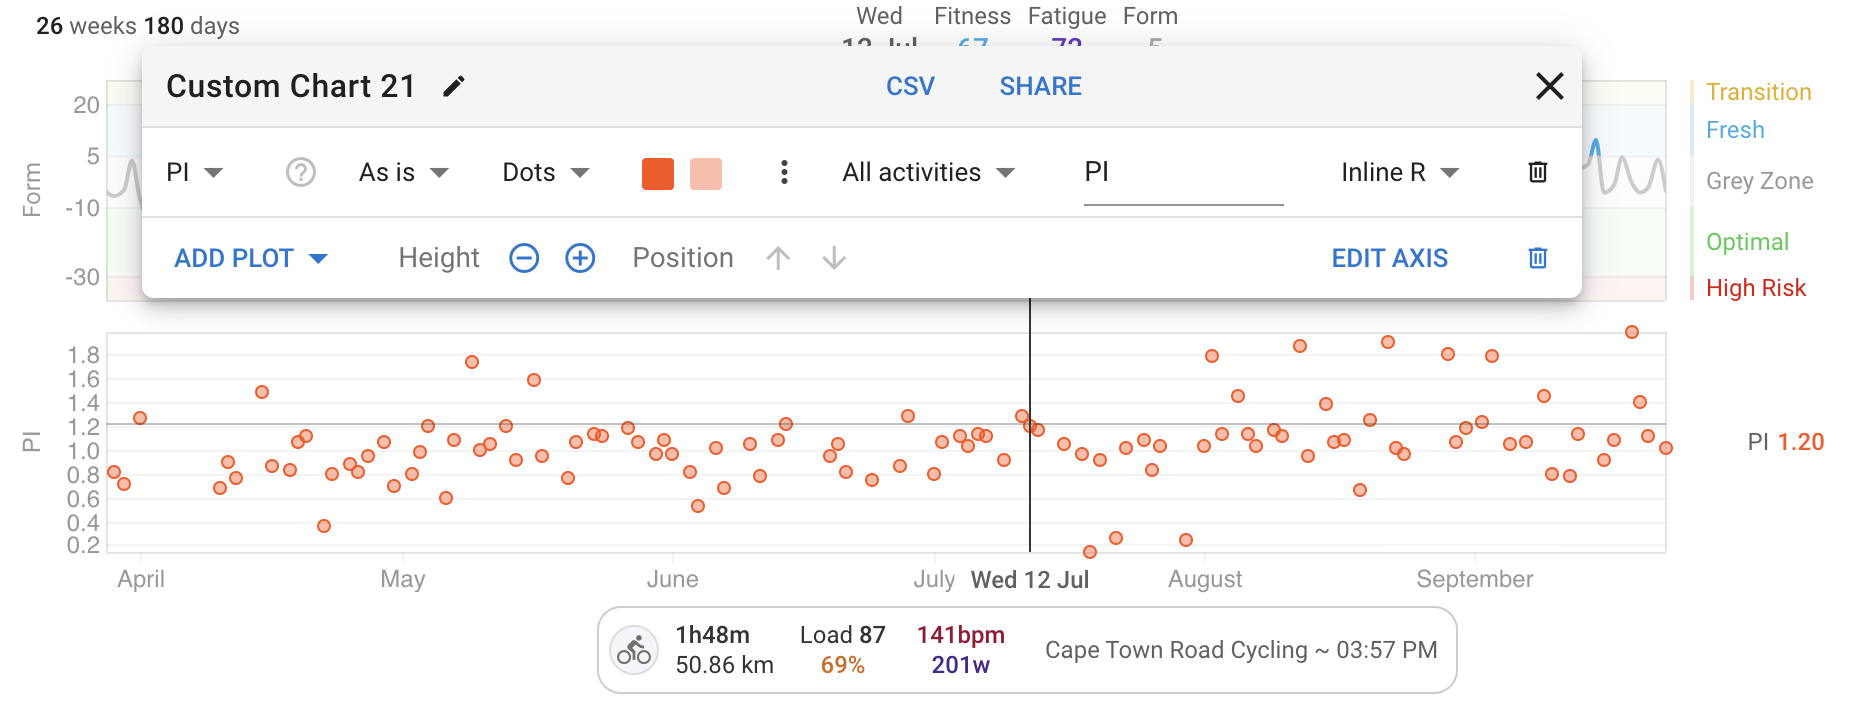
I have added the polarisation index as defined by Treff et al, 2019. The polarisation index (PI) is calculated from the time spent in low, mid, or high intensity training. It makes it possible to distinguish between non-polarized and polarized training intensity distributions with a higher PI indicating a more polarized distribution. A PI of 2 or more is considered polarized.
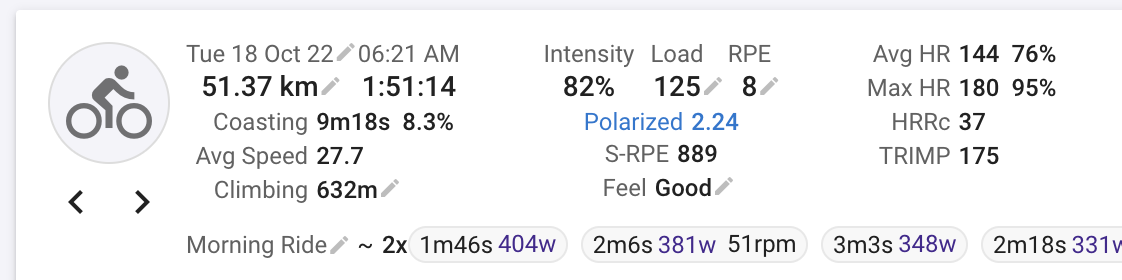
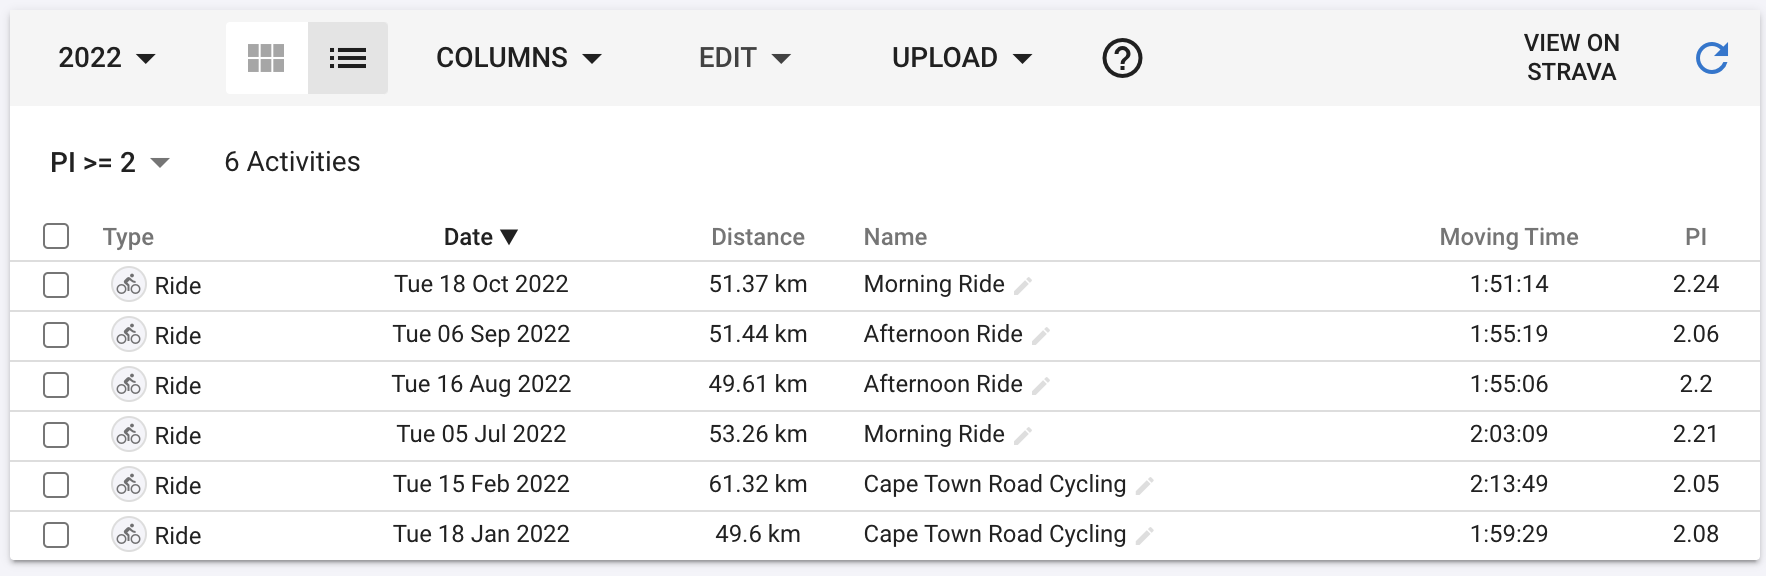
I love this David, thank you. I can’t get the PI to appear in the activity summary though - why might that be? I have been able to add it as a chart to my fitness page, and as a column to my list of activities. Odd.
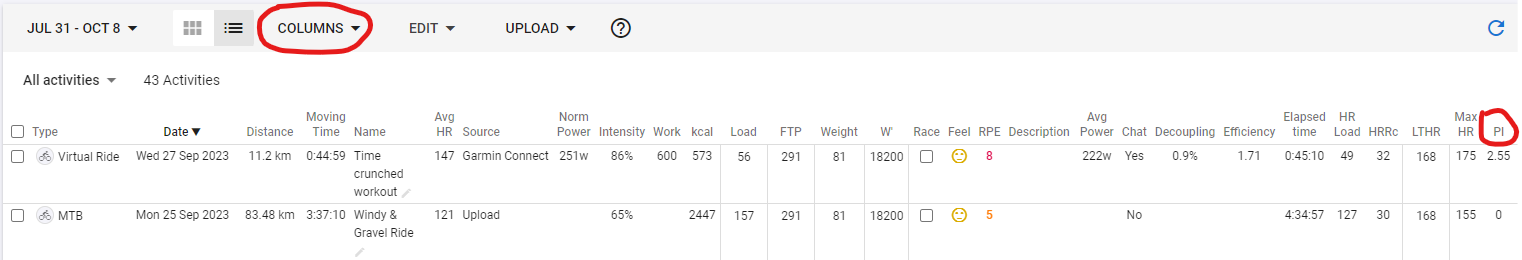
Hi Gerald. Yes, PI is ticked in the activity list view and that column appears. As I said, I have also been able to add PI to my fitness chart. The one thing I can’t do is have PI appear in the activity summary, along with e.g. Intensity, Load, Feel, etc. I’m not using filters, so all my activities are showing in the calendar and/or list views.
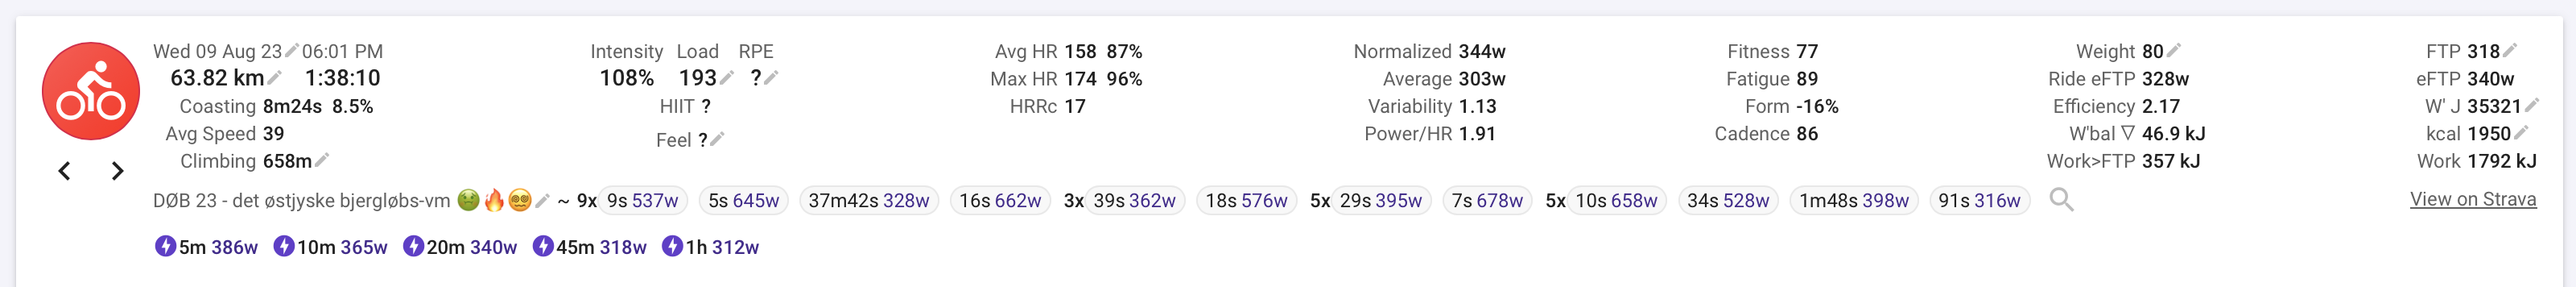
Thanks, David, this feature is really interesting. I can’t, however, get it to show on the bar for each activity. See clip. I am able to get it to show under Activities/list view and as a plot chart under each activity - but on the summary bar.
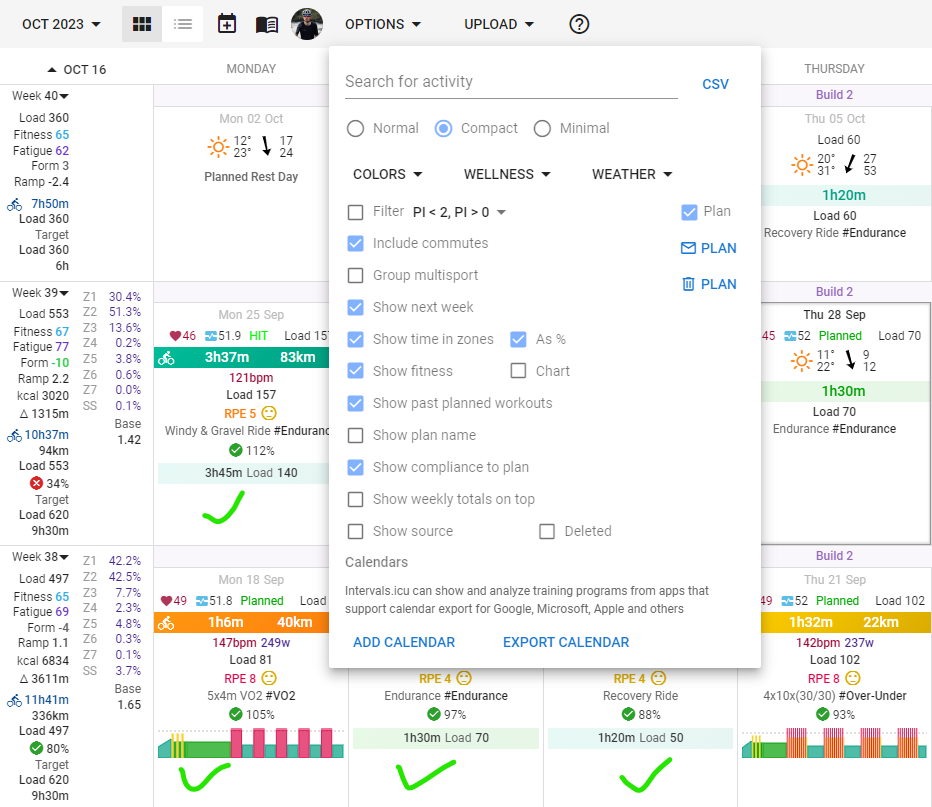
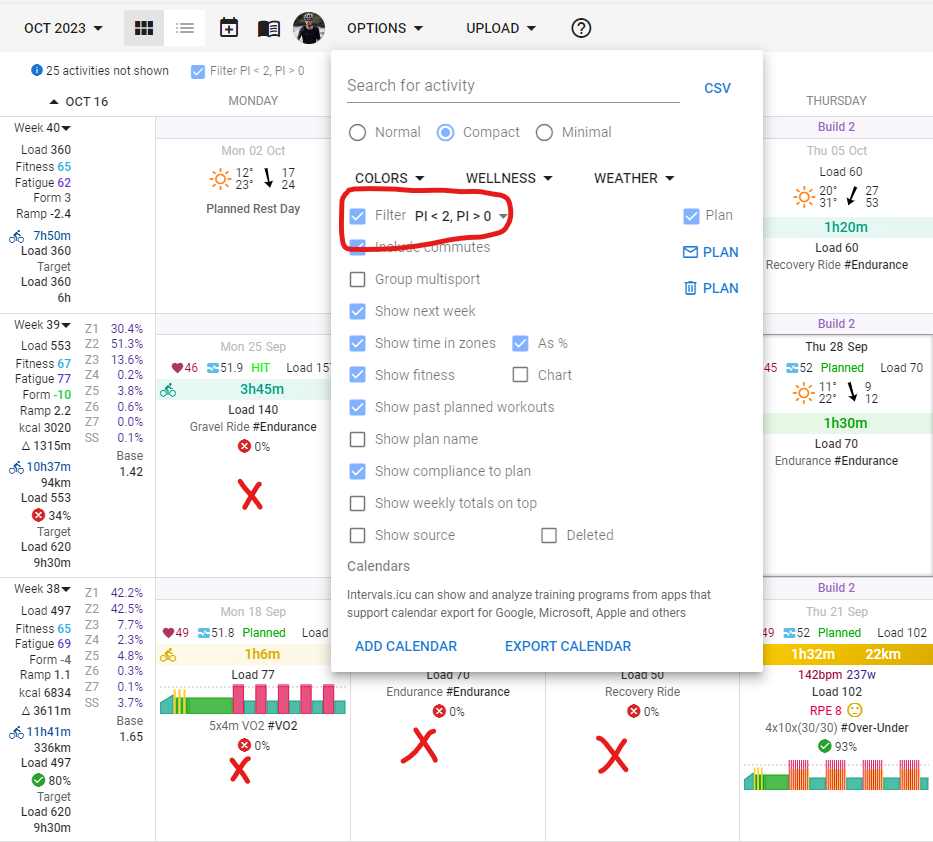
It seems that the polarized index is only shown in the bar if the event indeed was polarized. My I suggest that it is displayed always? It is such a handy thing to have the PI-score in the top bar.
Also, it seems that not all events have been calculated. How can this be? See image.
Morten
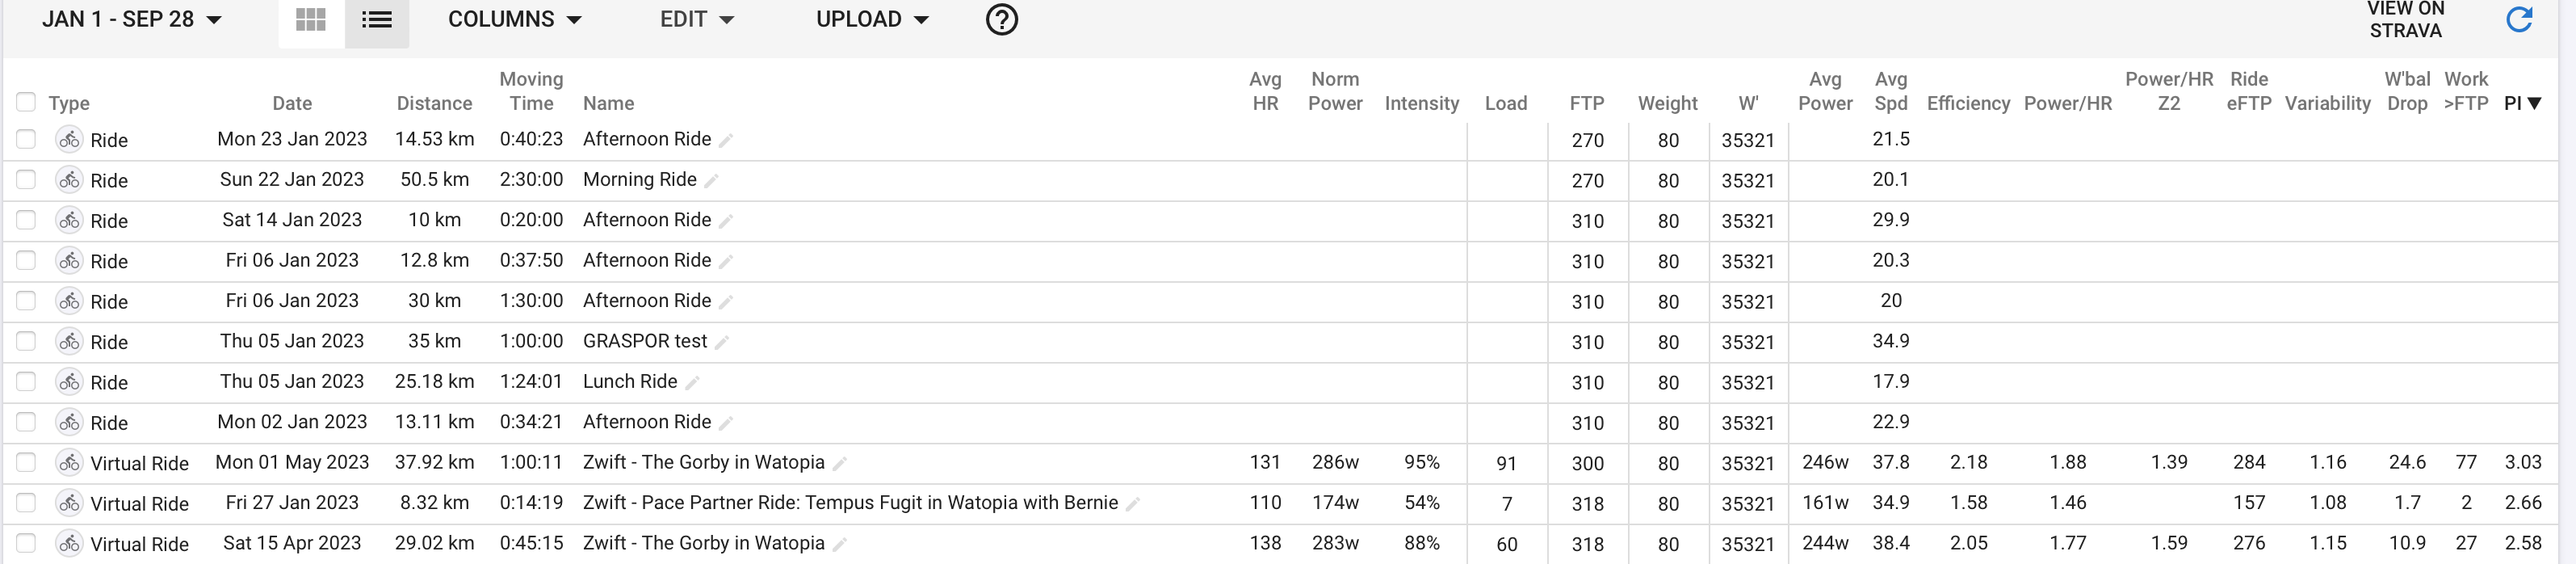
It is only calculated if there is “time in zones” information for the activity which requires power, HR or (for runs) pace data. So @Morten_Horning_Jense your ride on the 23rd of Jan 2023 doesn’t have any power or HR data so no time in zones.
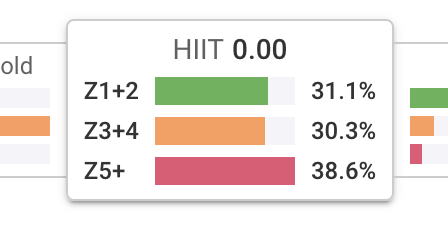
@Adrian_M_Gamble I can see quite a few of your rides have 0.00 PI. Thats because you don’t have any time in Z5 or Z6 on those. Is that what you mean by not displaying?
Thx, David,
That explains my commutes without data info.
But what about the race in the clips below? There is a fair distribution across the power zones but no PI-score.
Morten
Thanks David. The rides with 0.00 against PI are either recovery or Zone 2 rides, so that’s fine. What was confusing me, having thought about it further, was that I was l looking for a PI heading in the summary of all rides but then realised that while the number always reflects the PI rating, the name/ heading could be Threshold, Pyramidal, etc.
Is there a way to get a PI figure for a week, or a month? Thanks, again, for all you put into this great resource.
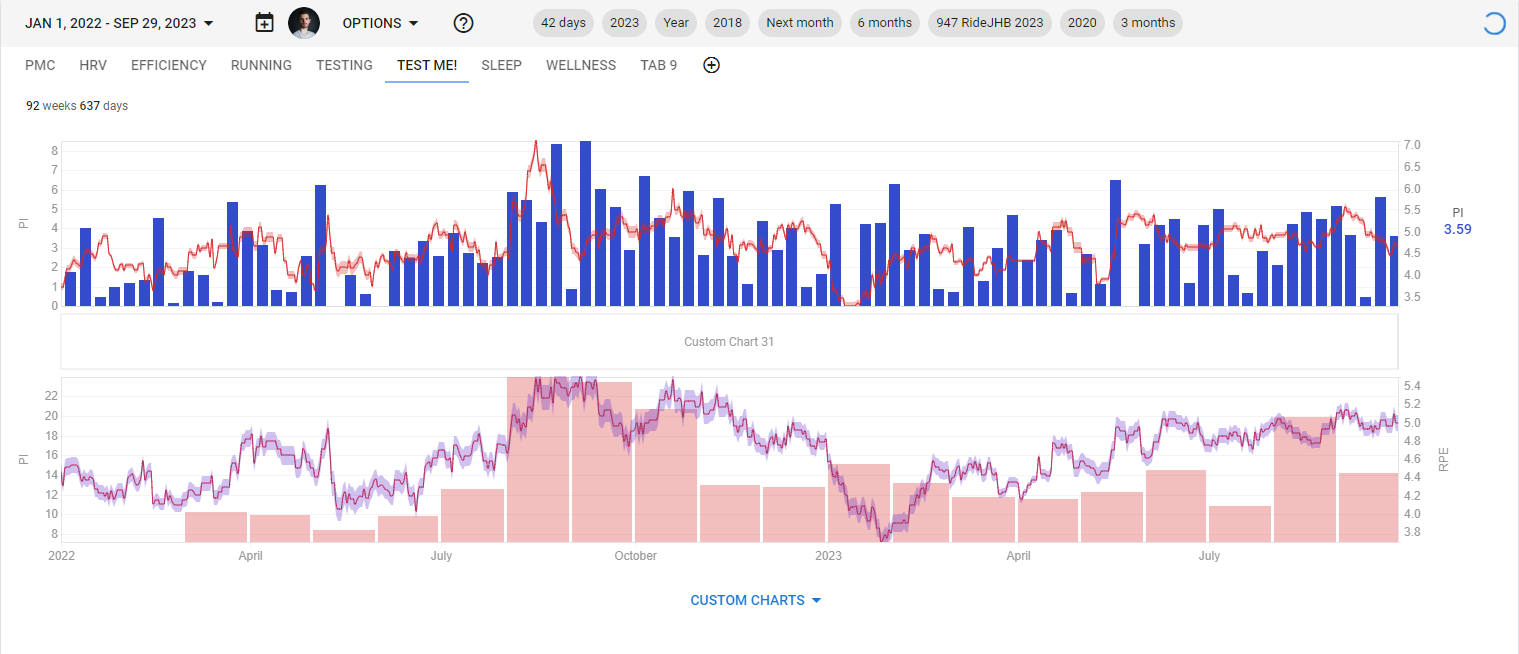
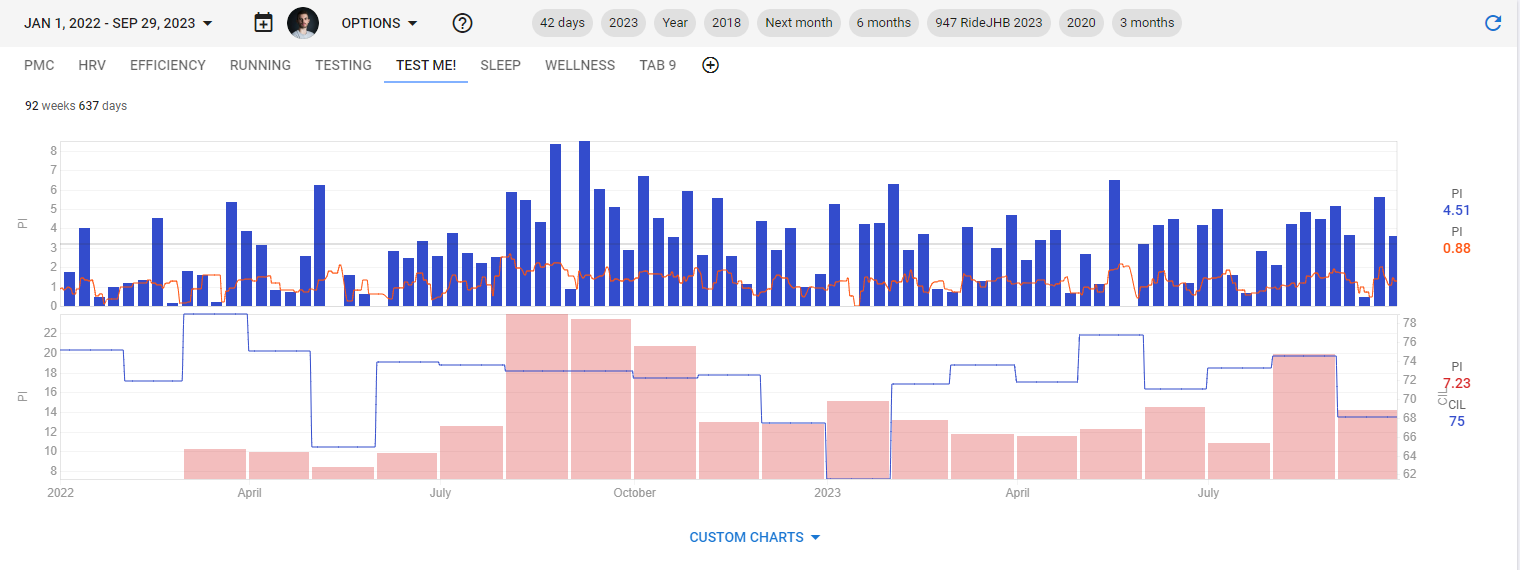
You can in the charts, but it all depends what you want the data to show. This is just an example of PI vs RPE per week and per month, as well as PI per week/month with the moving average. This is a test only, and no significant meaning to want to use it. It all depends what you want to get out of the data.
Gerald - that’s really helpful, thank you. I’m also using bar charts of weekly time in Zones 1&2, 3, and 4>, which gives me a good sense of the overall percentage split of my riding time. Thanks again for being so responsive.
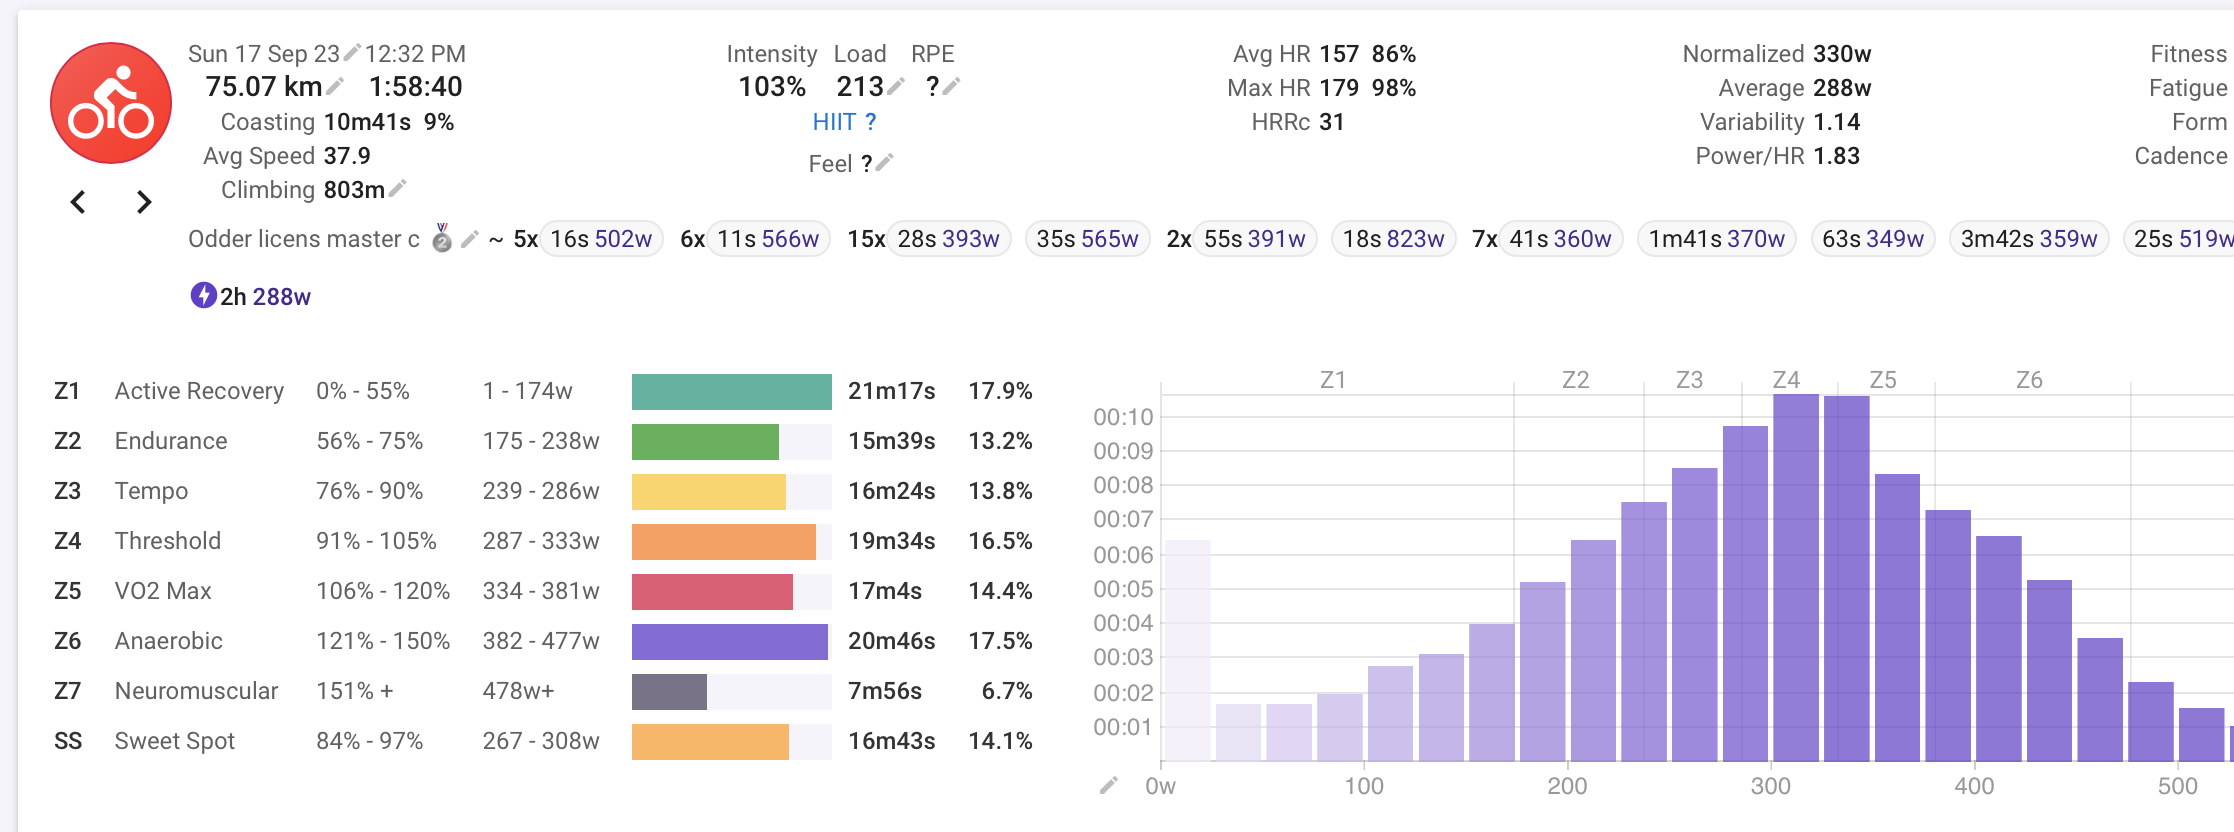
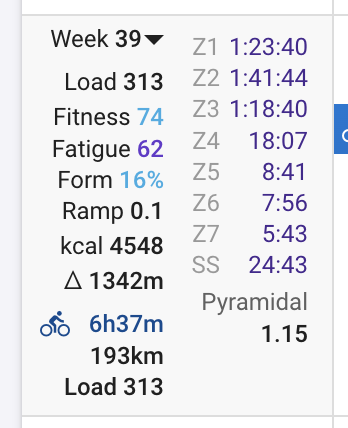
I just had a look at the formula and it will return “null” (cannot be calculated) if there is no time in S3 or time in S3 > time in S1. This is using the 3 zone model (S1 = Z1+Z2, S2 = Z3+Z4, S3 = Z5+). As you can see that is why your 17th September race has no PI:
Very helpful David, thank you. I also use the 3 Zone/ Seiler model, though I find it helpful to group zones 1&2 as Z1, 3 as Z2, and 4&5 as Z3. For each workout I can look - thanks to what you’ve built - at how much time I’ve spent above various heart rates; having weekly totals on time in (my) 3 zones on the Fitness page gives me a good overview of how my training breaks down. Thanks again for providing us with such a great tool.
Adrian,
Could you kindly post a screen shot of how this looks in your setup of intervals.icu? I am looking to do exactly that, ascribing to the 80/20-training philosophy. So I would like to monitor that I am not drifting into too much sweet spot training.
Morten
Thanks for this. I’ve been using clunky charts to track this. But a few things stand out:
I really think S3 should include Zone 4, or any threshold / FTP work, because those workouts occur at or above LT2, which the paper notes is the line between S2 and 3. Because these things are spectrums, the line has to be somewhere, and because workouts at FTP/threshold will always cross and remain above that line, then they should be listed as S3 in a polarised model. I read the paper for its physiology content, and I noted that they presume this everywhere, but yet in the second paragraph of the introduction casually toss “threshold” into S2, which is not reflective of Seiler’s et al. who place FTP/threshold work at LT2 and above because these workouts do indeed aim at or above the LT2 line (unless I and many others are missing something important, which is entirely possible).
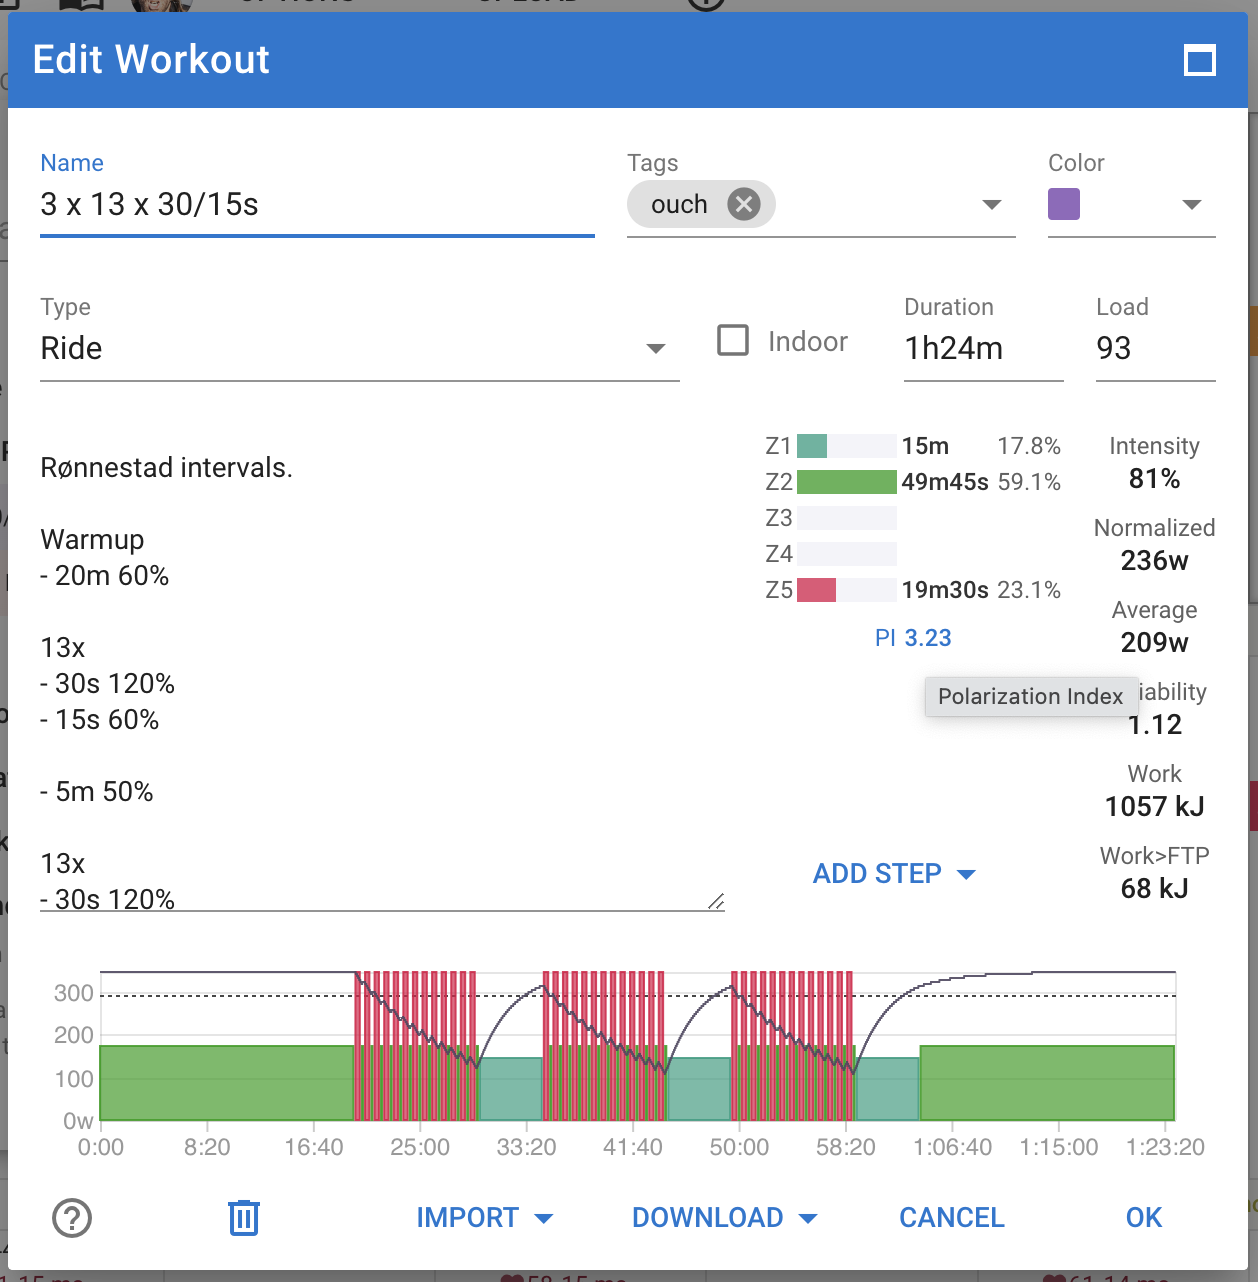
It may be misleading to mark a given workout as polarised or not. No single workout can be polarised, the workout trend can be polarised, and single workouts (low, med, high intensity) contribute to the nature of that trend. Each workout will regularly touch on all zones, but for polarisation purposes, the workout is defined by the main goal/dominant performance. An example is 5 X FTP-VO2 hill repeats followed by a long slow ride home, will still only be an S3 workout, even though there may be an hour or more of S1. In that case, it will look polarised as a single workout, but that info has no value at all in following a polarised training model.
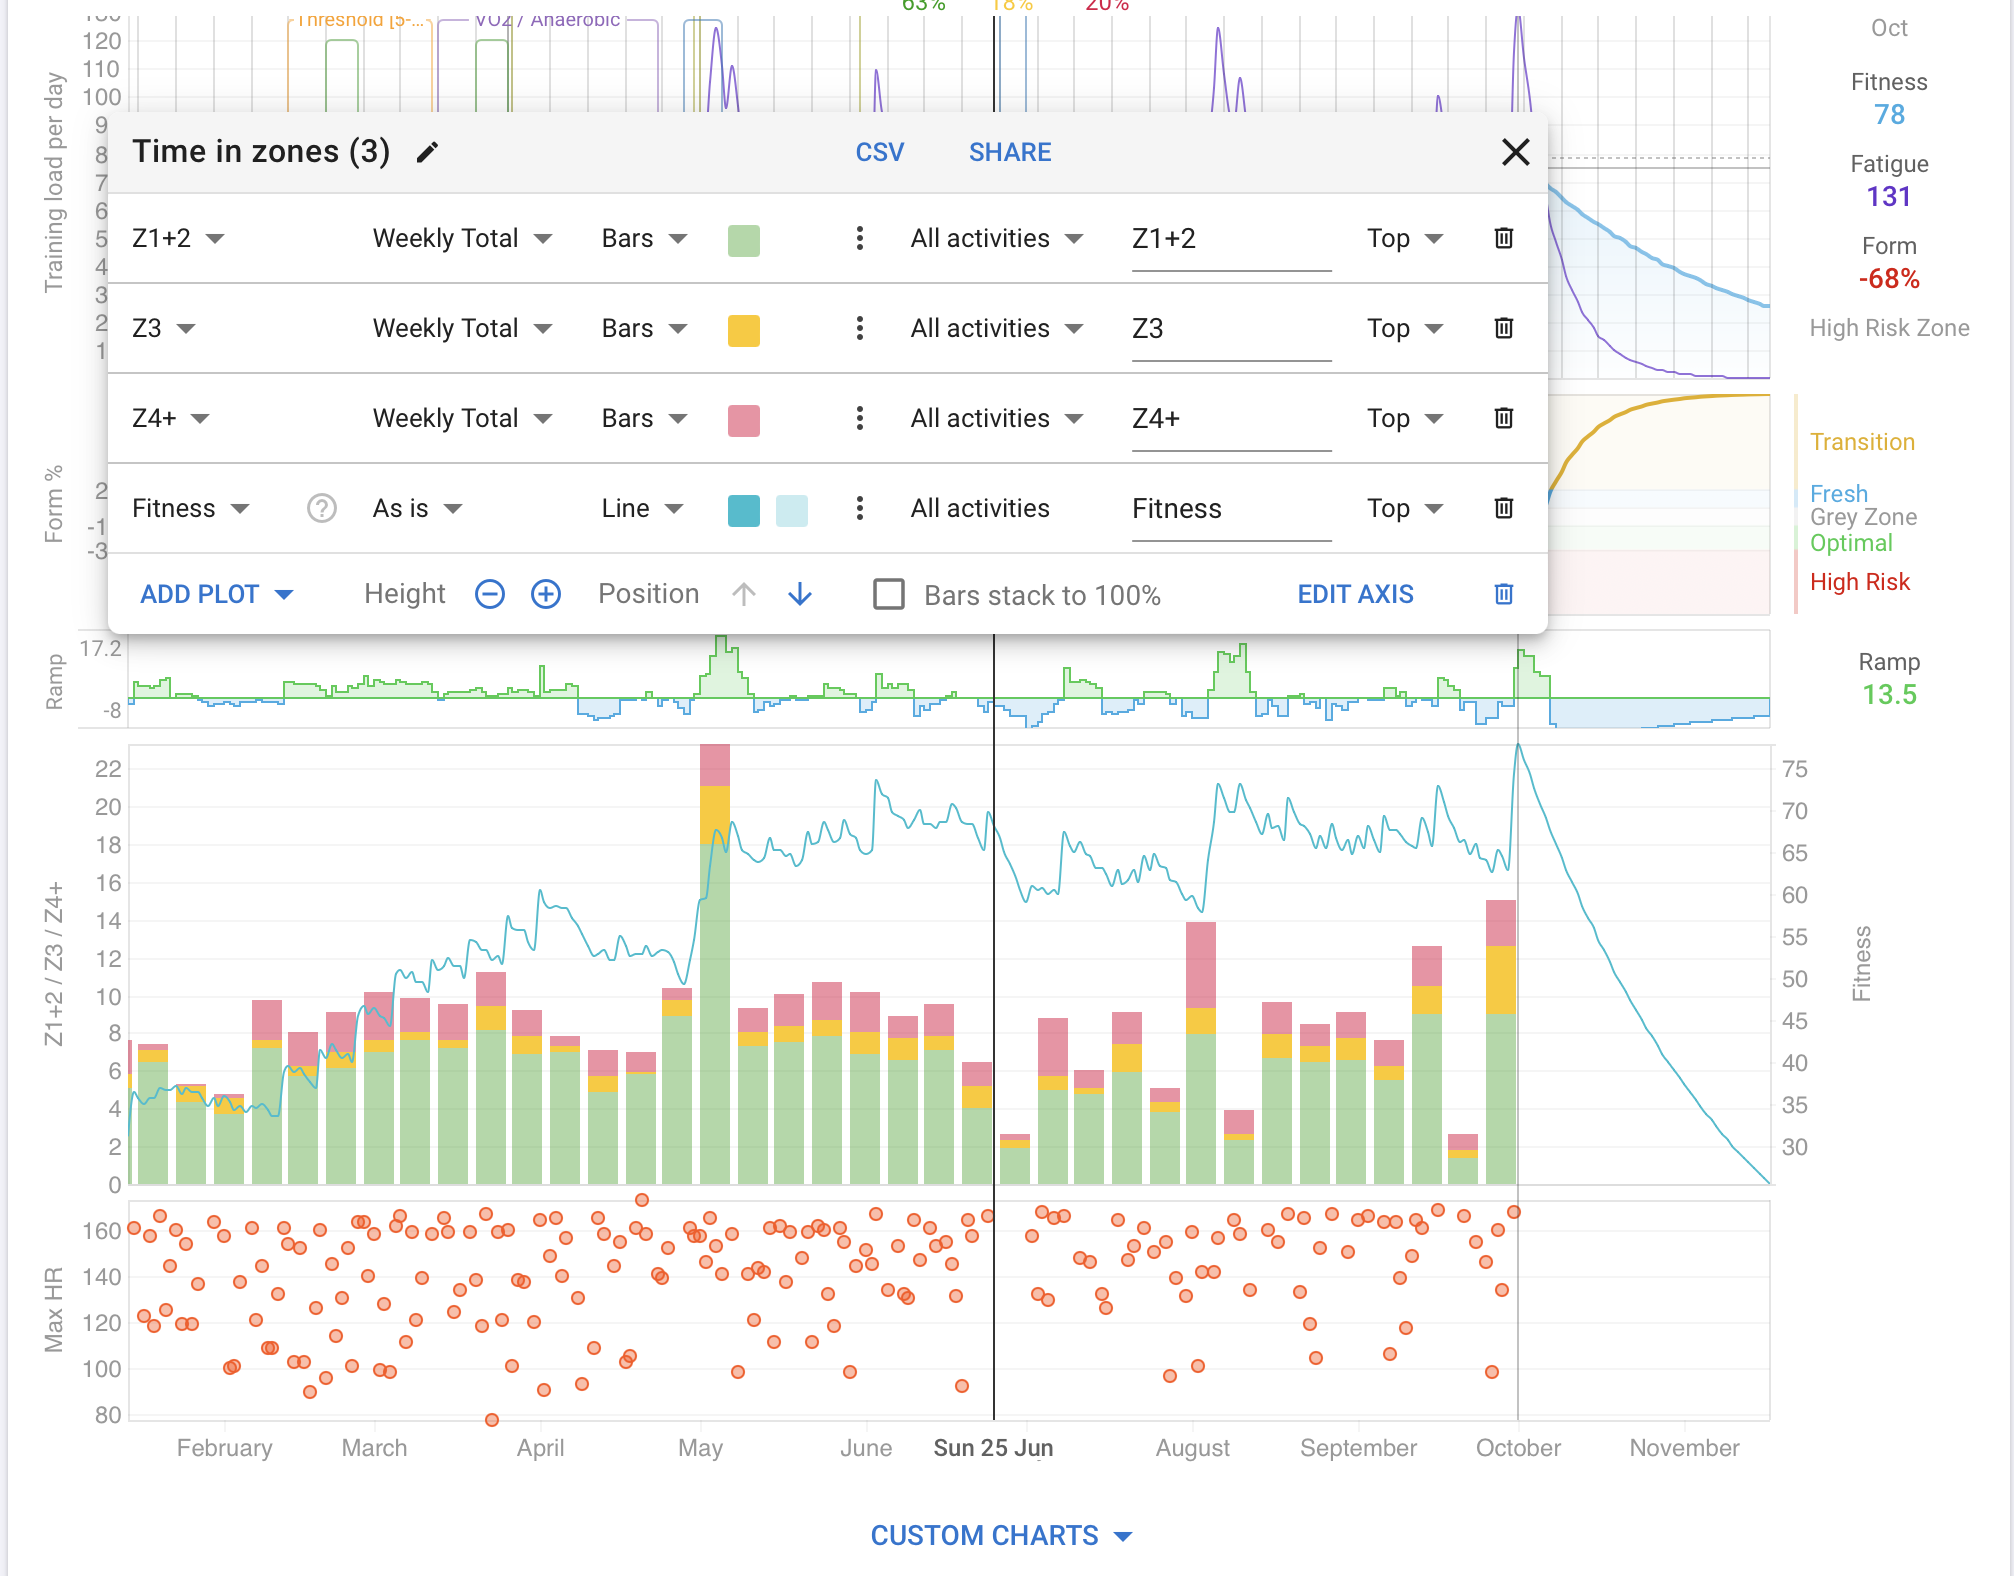
Morten - sure. Please see the attached. Essentially I created a Custom Chart with 3 plots on the Y axis for time in Z1&Z2, Z3 and Z4+. I use weekly totals and bars for these. I’ve added an overlay plot of my fitness, with a line. When you create the custom chart all of these variables appear in a drop down list when you click on “Add Plot”. Let me know if any of this doesn’t make sense. Adrian