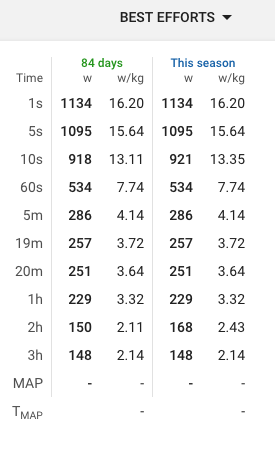
Using Intervals.icu for a few months now, and yesterday I stumbled upon data I had not yet noticed within the “Power” section : MAP and TMAP.
I understand that MAP stands for Maximal Aerobic Power (i.e. power at VO2max, yet correct me if I am wrong) and TMAP stands for Time at MAP (i.e. duration for which MAP can be sustained).
I would like to understand what kind of intervals the app uses at to derive those values, to make sure the data I get is actually accurate.
You need a very nice power curve with a good spread of data for it to work well. I am going to experiment a bit with calculating the regression line (PO) from short durations (maybe 10m to 20m) that people are more likely to have good data for and from the model power curve and see how that works. I also still need to add help and link to the paper.
Interesting, but how do you use it for training?
My FTP is 2.89 w / kg, Vo2Max 49 ml / minute / kg, MAP 3.89 and TMAP 3:31 seconds.
What does this say about me, what exercises should I pay the most attention to?
maybe you can use my data? I have a powermeter since 2015 and the last 80 days a lot of all outs in the range 30s till 40min and a lot in between… (1m, 2min, 3min, 5min, 7min, 20min, 40min etc)
If FTP / MAP > 0.85 , should focus on V02Max intervals?
Should the V02Max interval last PMAP and be at MAP intensity? Two minutes break between?
If FTP / MAP <0.81 is better to practice an interweave sweet spot?
EDIT:
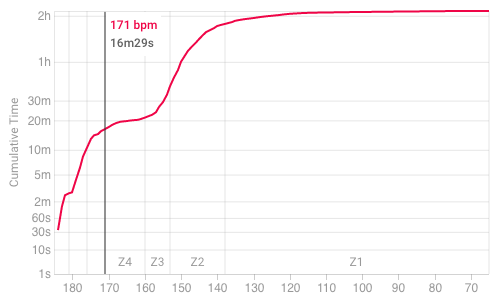
I think thats what they use iLevels for? You can also look at how much time you spend over VO2max heart rate in an interval session to get another view on this. The “Cumulative time” HR chart on the activity HR page is good for that.
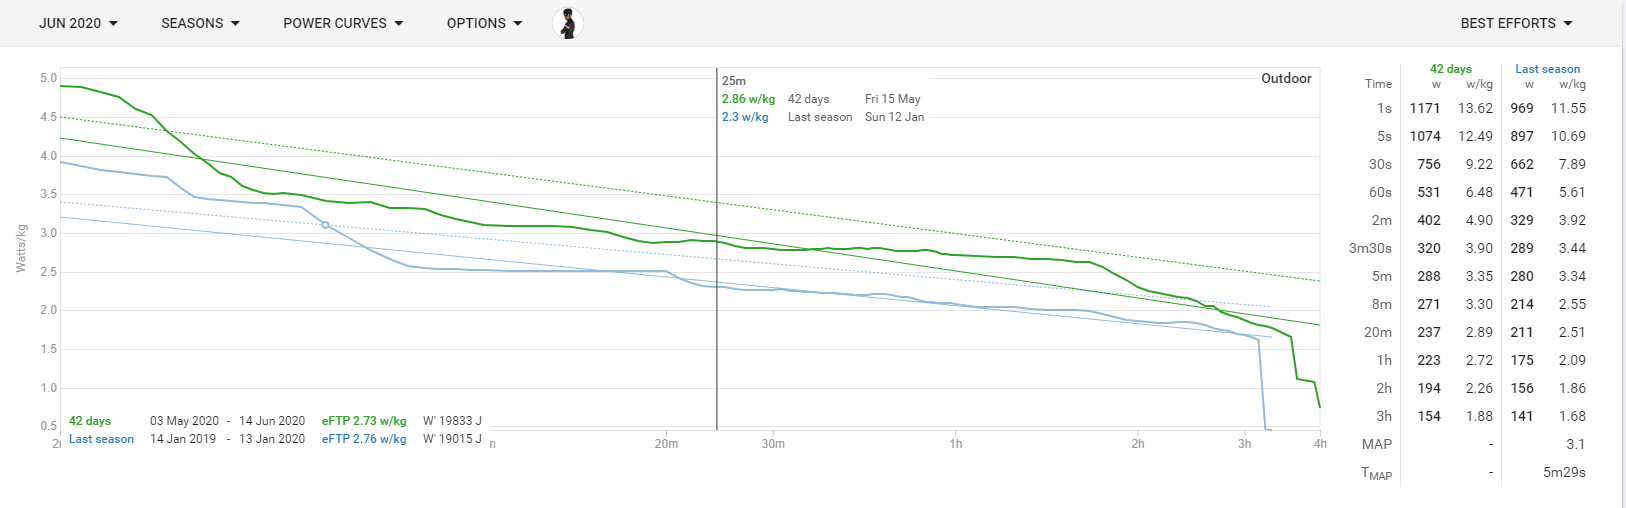
That would be hard to do because the duration differs. Someone with a shorter T-map is likely to have a better w/kg number. Probably best proxy is to just look at 5m power.
Maximal aerobic power (MAP) is the power at VO2max (maximum oxygen use) for a given test protocol. T-MAP is the duration for which this power can be sustained. The values depend on the lab or field test protocol. Intervals.icu uses the power duration curve and the method described in Pinot & Grappe 2014. If no value is displayed for a given power curve then the data was not good enough for this methodology. Choose MAP in power chart options to see the regression line and confidence interval described in the paper.
One of the interesting challenges a colleague of mine is working on is a consistent method to assess MAP empirically with a single session lab test.
MAP being defined as the highest average workload over the shortest duration that will elicit VO2max before task failure.
We’re currently using standard 100 W + 30 W/min continuous ramp test, with MAP defined as peak 60sec power. Then after 20-30min rest we perform an additional TMAP test. TTE should be ~90-180sec, depending on VO2 onset kinetics (how quickly VO2 responds to the onset of workload).
We wanted to pilot test it on more athletes of different bodyweight, fitness, female cyclists, etc. We were considering comparing this empirical method with modelled predictions from Pinot & Grappe, WKO5, etc.
But then COVID…
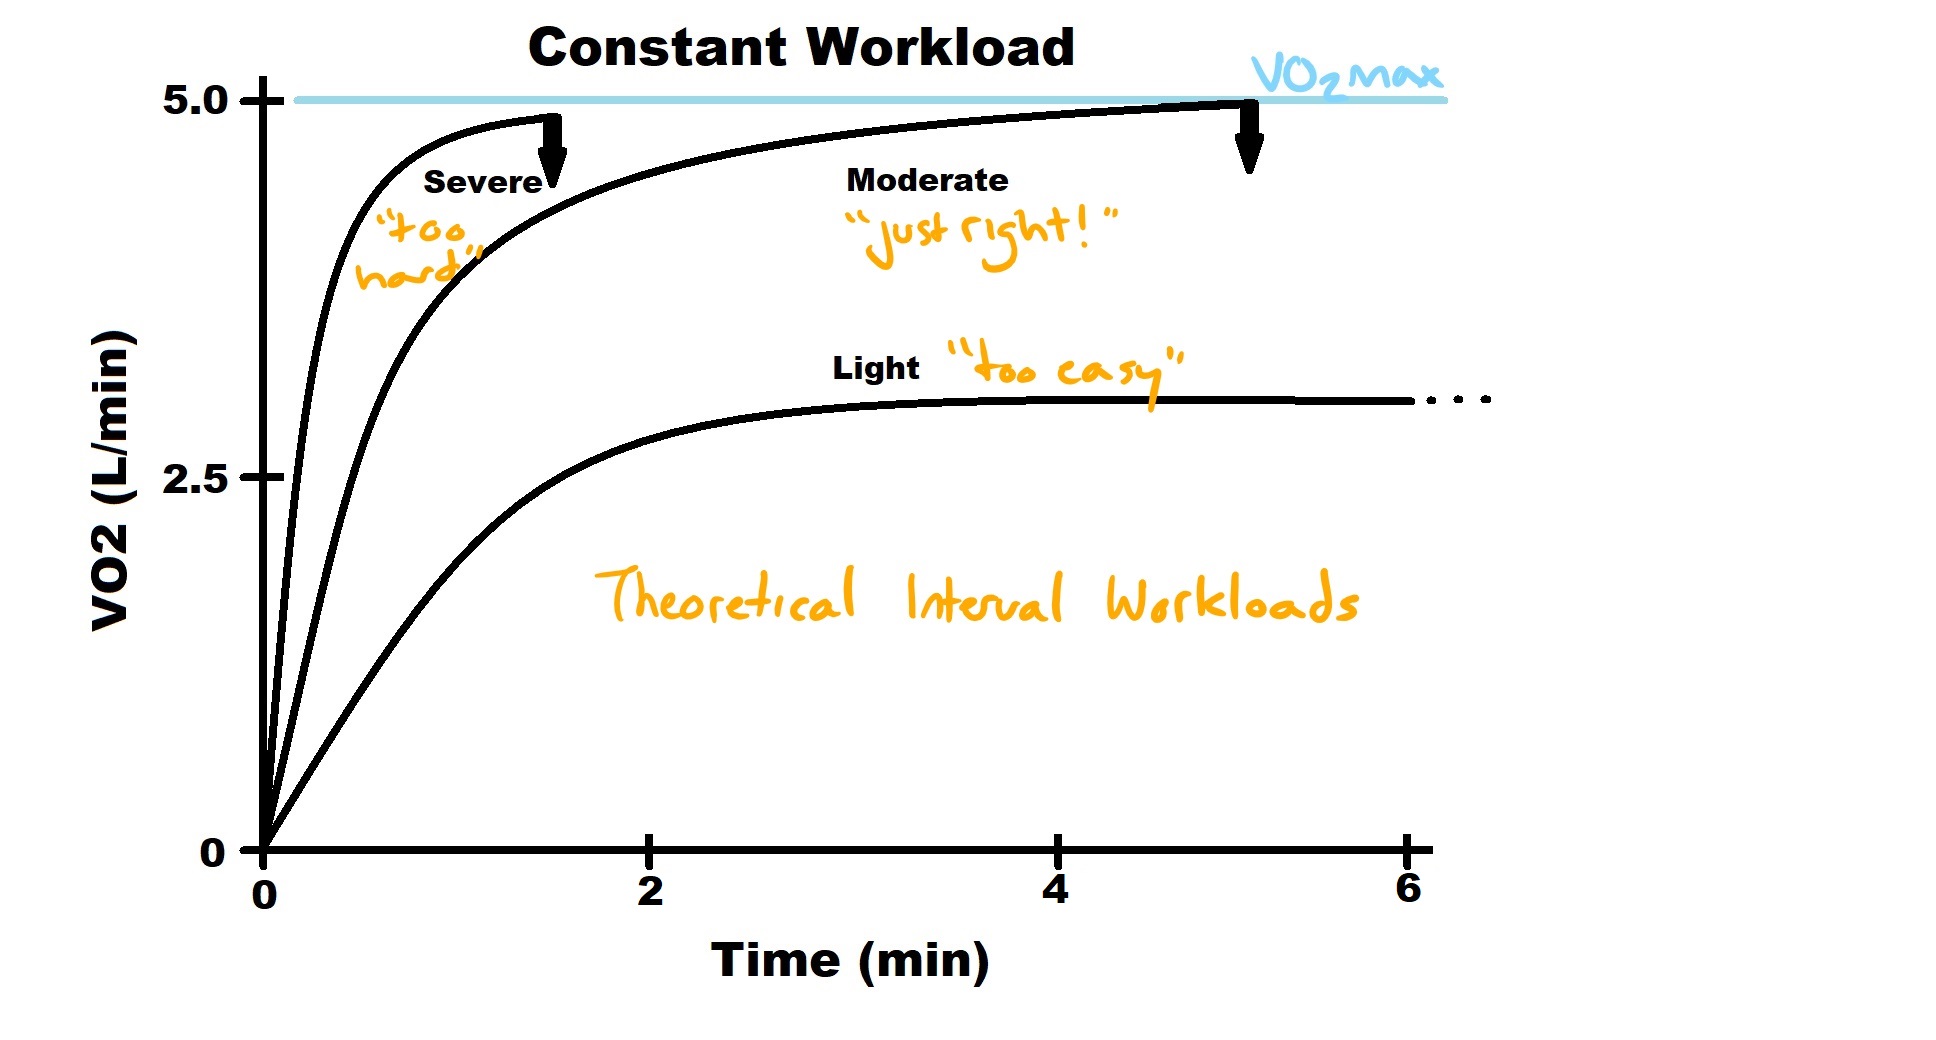
The relevance of MAP for our purposes is for HIIT interval prescription in the severe intensity domain, ie. between FTP/CP and VO2max.
I just wrote an article looking at how metabolic intensity and mechanical workload are related to VO2max training. ie. how can we modulate interval prescription within that severe intensity domain to optimize our own individual adaptations?
Forgive me for blatant self-promotion on my first post here, but someone suggested this community would probably be interested. I hope you are!