So MPA [and HIE] will be depleted by working at MAP, until MPA = MAP, meaning roughly ‘no more watts are available’ and indicates TTE @ MAP.
But in theory and in practice, you could continue to work by decreasing your power below MPA. Since you still have some work capacity available.. just not enough to continue performing at MAP. You might be able to see how hard-start intervals would fit into this model. It’s very compelling.
Actually, you pull MPA down by working above TP (threshold power). When MPA drops below TP, you have what they call a breakthrough (BT), where you increase any of three parameters, Peak Power (1 sec max, but that usually only occurs if you exceed your previous PP at any time during your effort), High Intensity Energy (available energy to perform above TP) and/or your Threshold Power.
I would be interested to know how Xert decides between increasing your HIE (W’?) and Threshold (FTP/CP) or some combination when you achieve a breakthrough. Intervals.icu will put you on a higher power curve (FTP) and slightly higher W’ but the W’ number comes with the curve and isn’t individual.
Picking this thread up - one of the things I like to look at in relation to MAP is Fractional Utilisation (relationship between FTP and VO2Max - FTP/MAP as a %) to see whether I would benefit from some focused VO2Max work or FTP work.
It would be great if we could have this % calculated based on our MAP value and set FTP (and/ or eFTP) shown on the /Power page and also as a field to be able to plot in a custom chart on the /Fitness page. Could this be added?
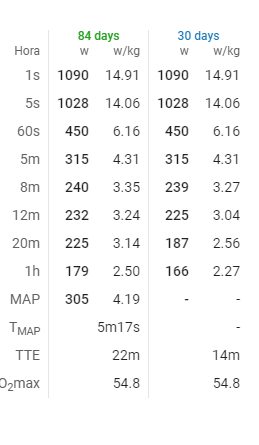
Same for me for this season, I don’t see MAP and tMAP. Previous seasons are shown, power curve seems well populated. I am riding mostly indoors now but rode outdoors in this season too. If I add a filter to show only indoor or only outdoor Map and tMAP are shown but If I leave both they are not shown for this season