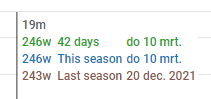
On the FTP curve I see that my 19 minute max is 246
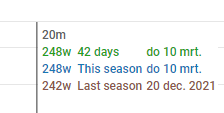
20 minute max is 248
and 21 minute max is 250
my 19 and 20 min max should also be at least 250 so I think something is wrong in the curve.
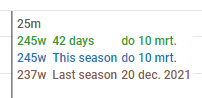
a similar situation exists on the FTP curve at 25 minutes → 245
and at 28 minutes → 247
also at 95 seconds → 386
and at 70-90 seconds → 385
That doesn’t make sense right? If I managed to hit a certain value at for example 20 minutes then that value automatically becomes my minimum for everything shorter than 20 minutes. You simply cannot have a lower value below that of the 20 minutes for the shorter timings.
I see what you mean Ben and it makes sense that way.
I guess perhaps the problem lays in the interpretation of the curve… it looks weird now like in your example according to the FTP curve, gathering data across many different rides, you were not able to do more than 250w avg for 2 minutes yet succeeded in doing 300w avg for 3 minutes.
Hence my confusion when looking at the FTP curve, if I was able to do 300w avg for 3 minutes, the FTP curve should then also say I was able to do 300w avg for 2 minutes. Representing actual data versus capability
I agree, the power curve should be rectified backward. Any power that you are able to sustain for “x” seconds, you are obligatorily able to, at least, sustain it for “x - n” seconds (“n” being positive ;-)).
It’s all a matter of definition [what the power curve is]. The power curve is your personal record for each duration – it’s what you did some time. It is not a representation of what you are capable of.
Ben has given a great example of the curve and this idiosyncracy. It’s what the rider did – who’s to know if the rider was capable of 300 watts for 2 minutes [continuously]?