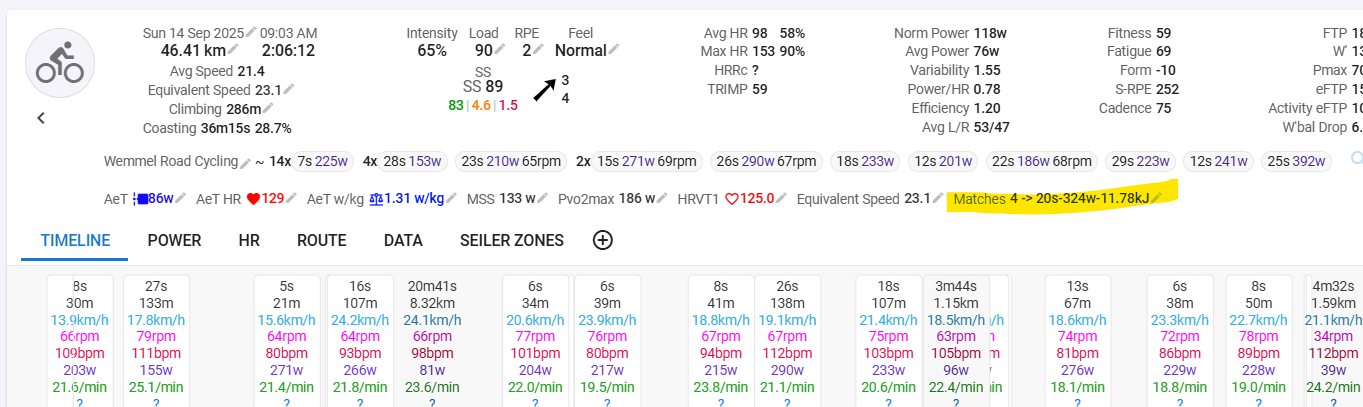
How can I select, filter or find how many ‘matches’ I did burn during a race? For example, I did a criterium, I would like to see which sections of the race have been decisive. So it would make sense to see what power outputs I did so I can train for it.
I can see in the “Work” under the activity quite some interested data but I am not sure if this randomly selected or with filters? Because I see a lot of 5s surges, but I would also be interested in power outputs of for example 1m - 5m.
In addition, what filters (range of interest) do you select for burned matches for a criterium and century rides?
Where can I find this Matches Counter? I can’t find the Custom Section you are referring to, I think…?
Yes I found it, but it doesn’t seem to do anything? When I select it, nothing changes in the WORK tab?
But how does it by default select the work? Like I have a workout from a race, I didn’t press any lap button, so how does the algoritm select/filter the work in this workout?
You have to reanalyze afterwards (Action → Analyze)
If you select something, you don’t create new intervals. You have to create or change them, to see the changes in the WORK tab. Create them by pressing A (Add), S (Split) or M (Merge) intervals on the chart. Drag and Drop the borders of an interval to change the duration of it. You could also use Actions → Find Intervals.
It searches for high power intervals. I don’t know the exact algorithm. But it works better for “steady” intervals. If you have lots of short high burst and short recoverys during a race, only these burst will be recognised.
This gives an idea on the ‘cost’ of the efforts. I have seen ,utiple time, where athletes go to hard closing a gap, making a break and they get to around 10% left and are unable to recover as well.
Don’t forget to look at the ‘context’ of the bigger picture with races, what else can help influence those efforts, cadence? Is it the ability to recover? Less time above CP? and tactics of course.
I have a W’bal effort finder and W’ match counter.
Hei Alex, interesting mentioning. How does W’bal output works? I have tried to find it, and I can see it is selected in my charts, but I can’t find the graph?
The W’bal chart should be a chart you can view when looking at a work out.
it has CP aka ‘Threshold’ and W’ which is a work capacity above CP that allows us to predict the how much work you can do above CP.
Once it is depleted, task failure at the power occurs so you have to drop the work rate below CP, this does mean it can become a negative value. (We have a few papers re defining the W’ definition)
Some call it AWC for anaerobic work capacity, but the research has moved away from it, it isn’t just ‘anaerobic capacity’.
But the W’bal frame work allows you to see how your W’ aka your battery depletes and recovers throughout a race. The lower the value the more physiological stress you are under. It’s a good analytical tool to see how you battery was used during a race.
For example, you do a hard effort and get into a small break away but you deplete say 80% from that effort, you will need to recover from the effort before you can pull some quality turns, if you don’t and push your turns, you may find yourself getting dropped if they push through/counter again. Hypothetical but this can be shown in the W’bal graph much cleaner than a power file.
Got it! No I haven’t entered data there. Is there a way you could define you W’ J? In my case, it would have changed quite from time to time I think…
You re-evalute this W’ J every time you redo a FTP test? The Pmax is also what you should define yourself? I see I haven’t filled it as well. I can look it up at my power curve I guess?
I have added some numbers for the moment, but still doesn’t see any W’bal charts…