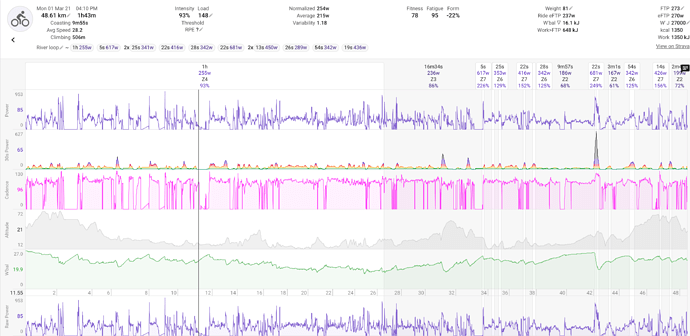
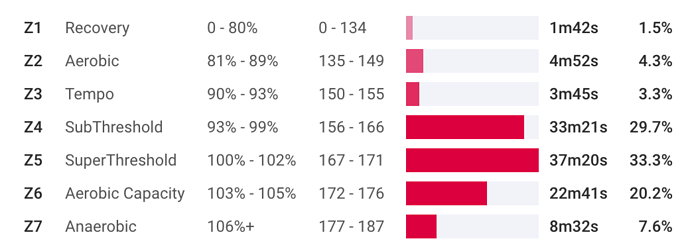
Just to add to the confusion, I went for a 48km ride this afternoon and averaged 255W (same power meter) for the first hour. This was a hard effort but not all out since I had another ~50min riding to get home. Also got a KOM 4km from home 
Have you done this yet? If so how did you go?
I’ve had an interesting few weeks, other life events changing my riding plans a little bit. I’ve been using both the new indoor trainer and riding outside. But my other life events usually involve running around (eg. gel blaster comps, which are like airsoft, and a paintball comp which was 8hrs at a relentless pace equiv to a hard 100km ride according to my HR monitor) so I get some good cardio but then have to have a rest day. So I just had 2 days rest, still a bit fatigued this morning so went back to sleep and rode this afternoon instead. Managed just under 2hrs @230W and NP of 263W. On Saturday I smashed a 14sec PB up a 2:20 climb which boosted my FTP 10W to 280W on both this platform and Xert (I just have a trial login there out of interest). Felt really strong today.
I would suggest just training for a while and uploading your data here. The eFTP seems to be a pretty good estimate for setting your training zones. The FTP test really needs to be done when you are really fresh. I felt so strong today if I had done an FTP test I’m confident I could have gotten the same as my eFTP here or better. I wasn’t overly motivated, I just felt really good once I started riding.
This is what my HR looked like today, I was working hard but it definitely didn’t feel that hard.
Adding to the discussion, this might be a good alternative to get a propper figure for the majority of the cases with the advantage of estimating TTE@FTP as well.
No Not done it yet. I probably wont do an indoor test any time soon as I am going out more now and just enjoying riding.
Those are some good numbers your posting seems to be going well for you!
My goal is to hit 4w/kg which for me is around 320W. So while I’m happy with my progress I don’t see them as ‘good’ numbers, at least not until I hit 300W FTP 
We are in a snap 3 day lockdown here, can still exercise outside and it’s a great time to be riding since there’s less traffic. I think I would go bonkers if I had to do all my riding indoors
Its all relative. they are better than my numbers so to me they are good.
I know what you mean though, goals are individual and as long as they are achievable a good thing.
Absolutely! I follow a bunch of the pros on Strava. Sometimes it’s demoralising I guess but it’s also good to look at their numbers as motivation to improve your own even though you know you’ll never get near theirs.
Yeah, Kolie Moore’s testing protocols seem to be exceedingly robust for determining FTP by testing in a longer, progressive way.
Helps that with his podcast he’s clearly exceedingly knowledgeable when it comes to sports physiology and coaching.
If I weren’t finally seeing the light at the end of an Achilles tendinopathy, I’d absolutely be using his protocols for my FTP testing.
As it stands, I have been with eFTP and had just drastically lengthened my minimum duration for eFTP calculation because I tend to be able to push pretty far into the anaerobic cave and it shoots my FTP estimated to hell.
What if my eFTP for a 17 minute cat and mouse crit race came out way above my prior 20min FTP result? I assume this just means I’m in better shape now and probably more motivated by a race than a solo ftp effort
This is unrelated to the subject of this thread but OP’s image is the perfect example, why is the 30s (shaded) power stretched along the y-axis? The 30s power graph of the ramp part looks like it’s parabolic when it should be linear. I’ve noticed that before in my graphs where there are high power spikes.
Yes 17m minute max effort in a race should give you a good number. In theory you should be able to do better with a steady effort in training but then there is the motivation problem 
It is 30s power on a log scale to accentuate the high power bits. It shows you where the training load (TSS) for the ride came from more or less. A linear scale wouldn’t do this as nicely. It does break a bit if you have some big sprints and are good at that.
Ah yes, that makes sense. I had a couple of rides with sprints where the rest of the power curve was squished into a few pixels. I love the the shading because it’s much easier to read, is there maybe any plan of adding this to the normal power chart?
Thats not a bad idea. I could also make the exponent used for the log scale configurable per activity.
Configurable exponent would be perfect!
Whew… join the club.
Hello, what duration do you consider when modelling the CP curve with Morton’s 3P?
Do you think it is feasible to make the TTE of eFTP for the WKO fact?
Thank you in advance.
I don’t think the FTP ramp test on Zwift is the most accurate way to estimate FTP. Let’s also remember that FTP is not the sustainable power for an hour. Based on the tests I’ve been able to perform, it’s better to calculate FTP at 82.5% of the MAP in a ramp test. To do this, you would need to perform an incremental ramp test with a 10-minute warm-up at 100 watts, then increase by 25 watts every 150 seconds. Once you reach your limit and can’t go any further, immediately stop the recording. The MAP would be calculated with the final completed stage plus the percentage of the uncompleted ramp. The FTP would be 82.5% of the MAP. VO2max could be calculated from the MAP using the following formula: 0.01141*(MAP value) L/MIN + 0.435 L/MIN.

