Easy custom formulas on fitness charts

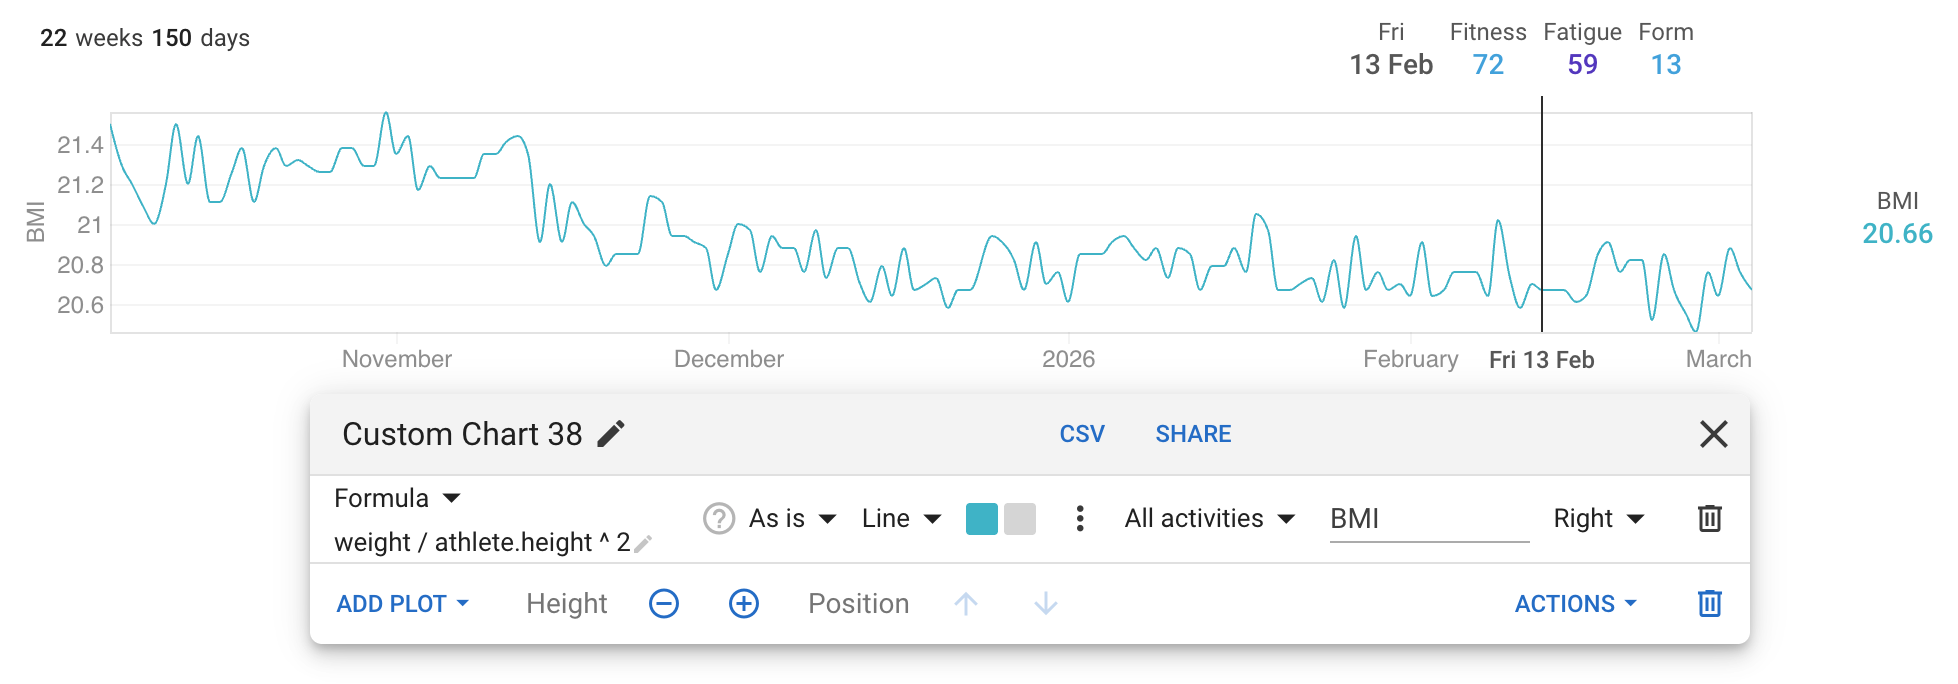
We (tx @ryandev ) have added support for custom formulas on custom charts on the /fitness page. These are simple math expressions and (hopefully!) easy for non-software developers to write. Here is a BMI chart:

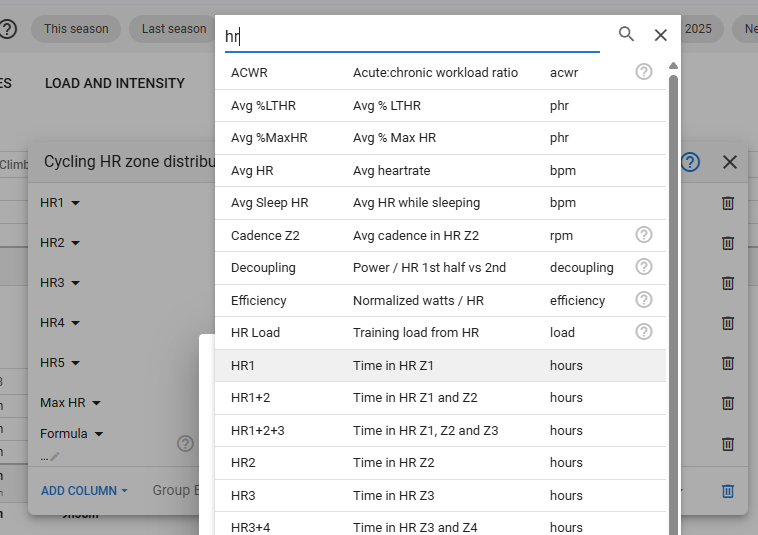
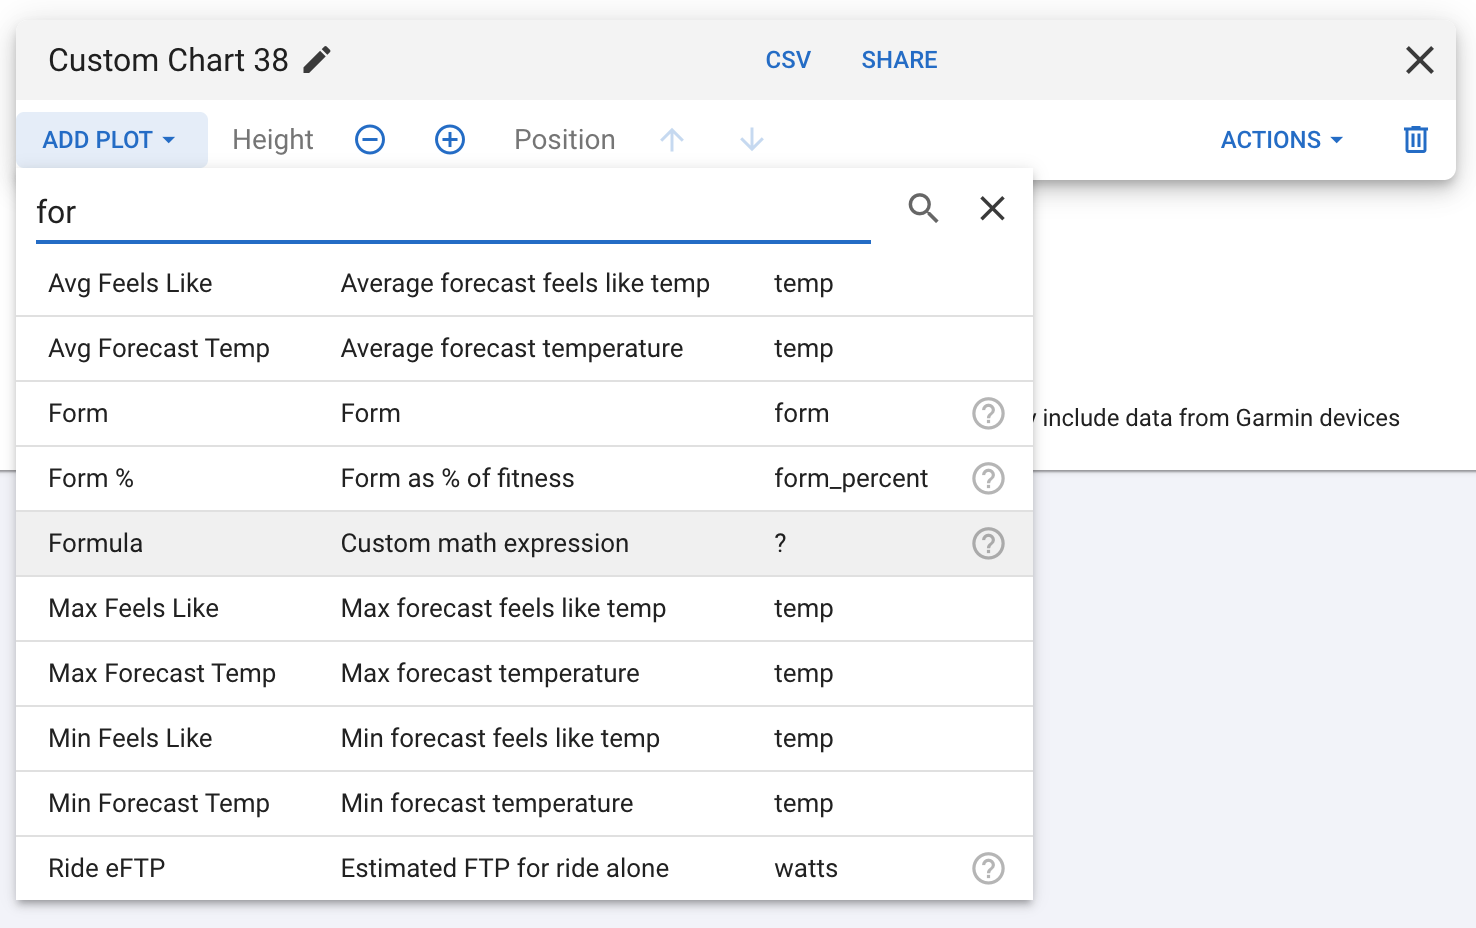
Choose “Custom Charts” → “Add” → “Chart” to add a new custom chart. Then do “Add Plot” and search for “Formula”:

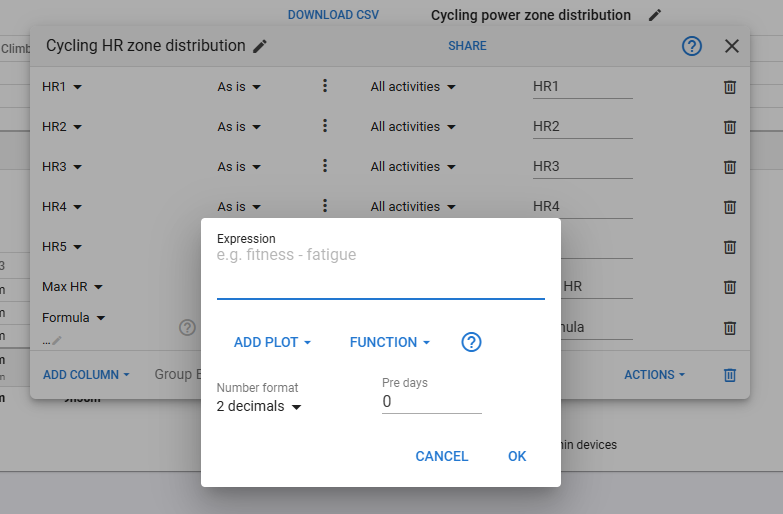
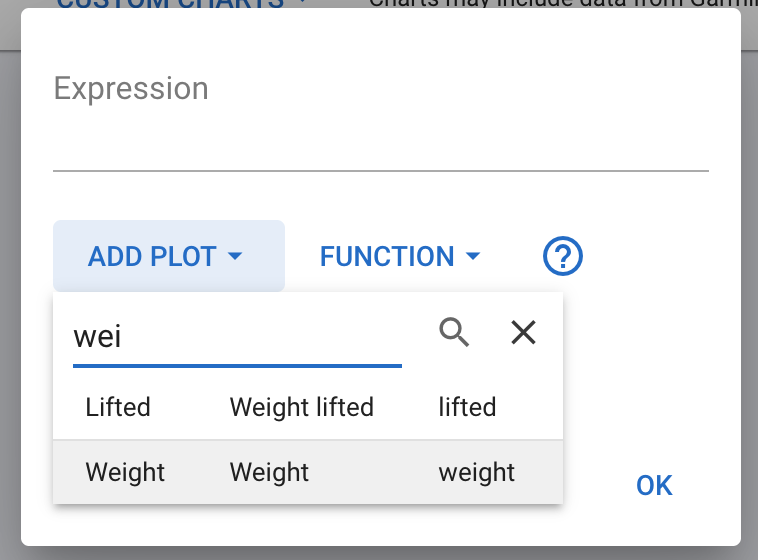
Click the little pencil under “Formula” on the table to exit the expression. Choose “Add Plot” to insert the expression for weight into the formula:

The athlete is available as a variable for fields like ‘height’ so you can complete the BMI formula:

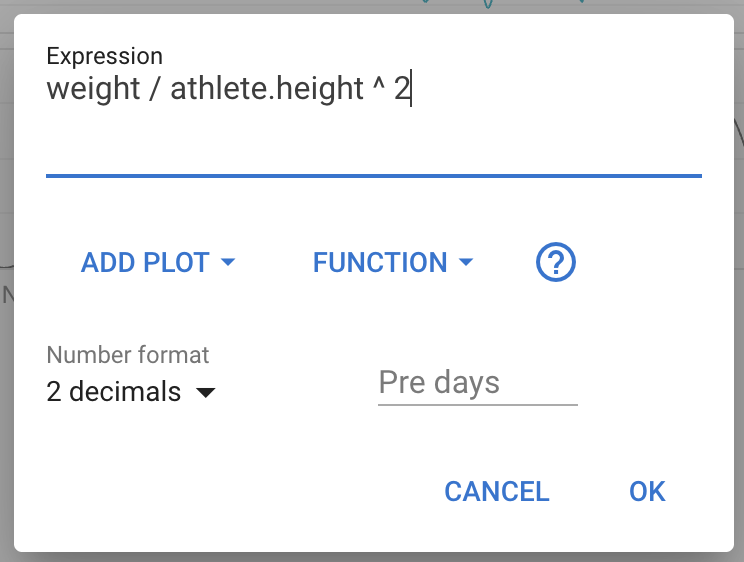
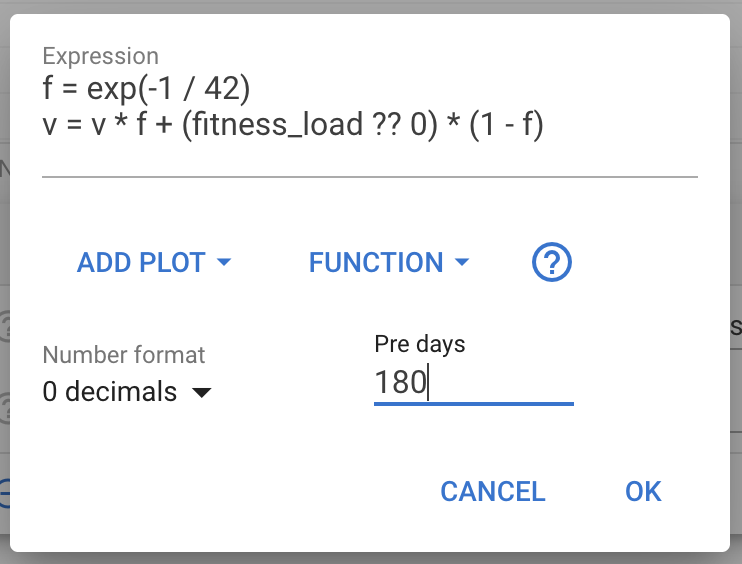
The pre days field specifies how many days of data should be included before the start of the date range. This is useful for formulas that compute moving averages and so on. Pre days will be at least this number and maybe more depending on other plots and charts.

There many built in functions, some of which are on the “Function” drop down. For a complete list please see this list of mathjs functions.

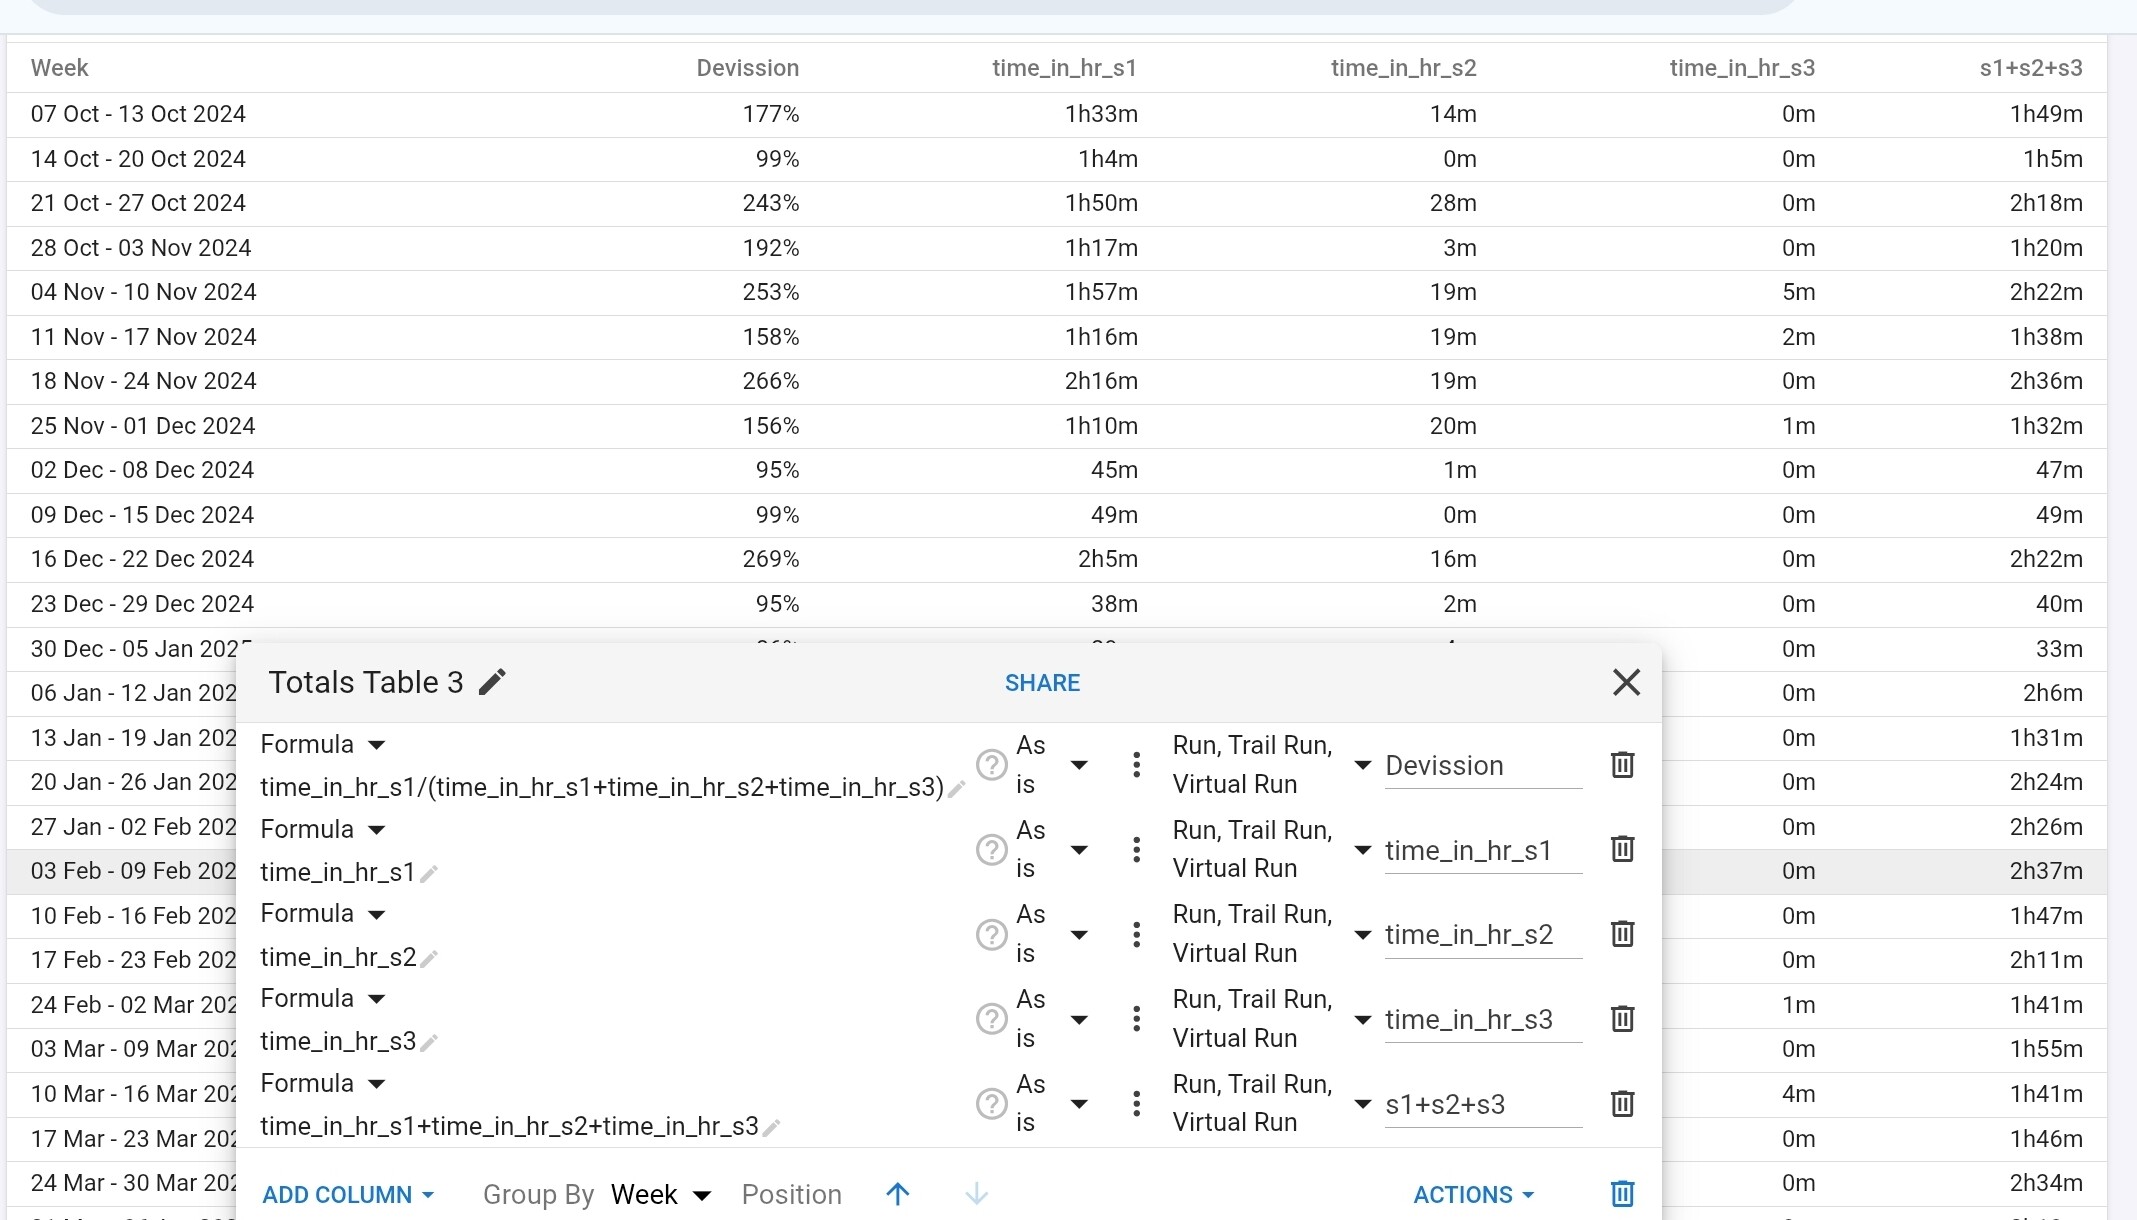
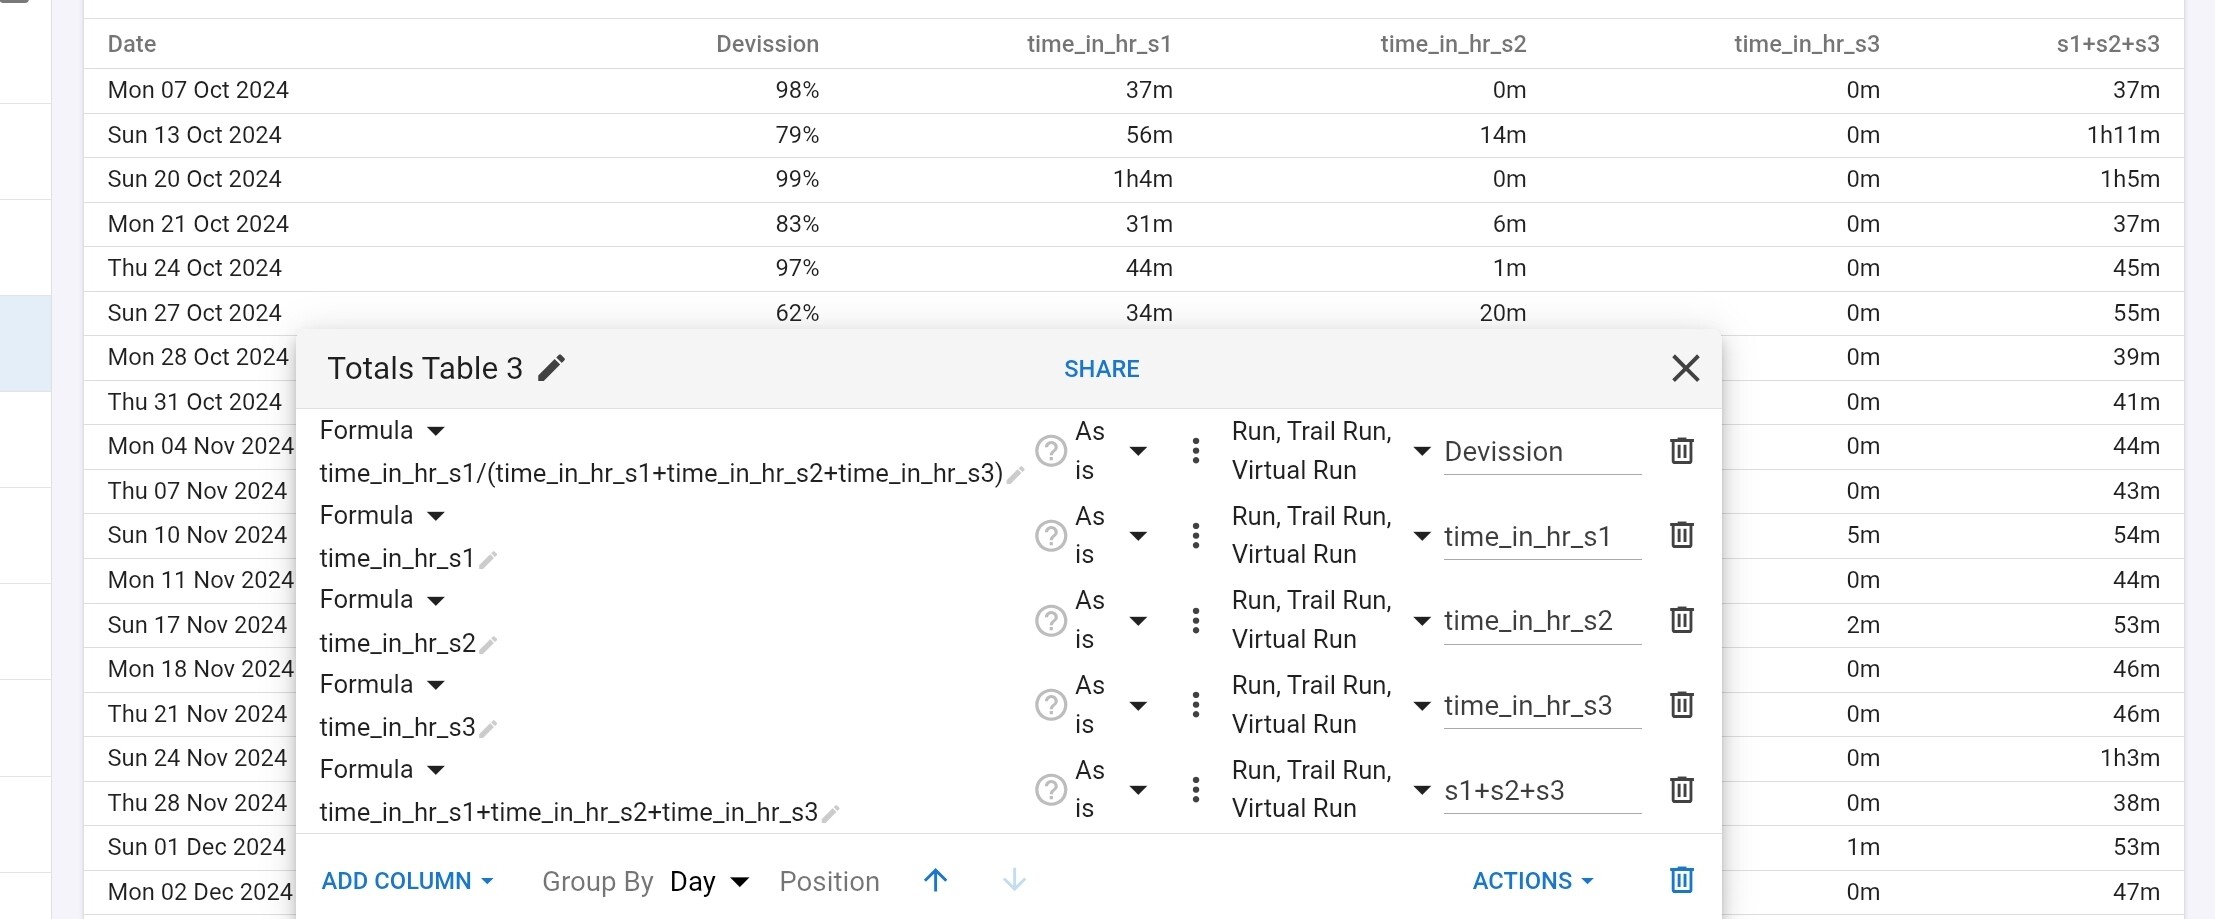
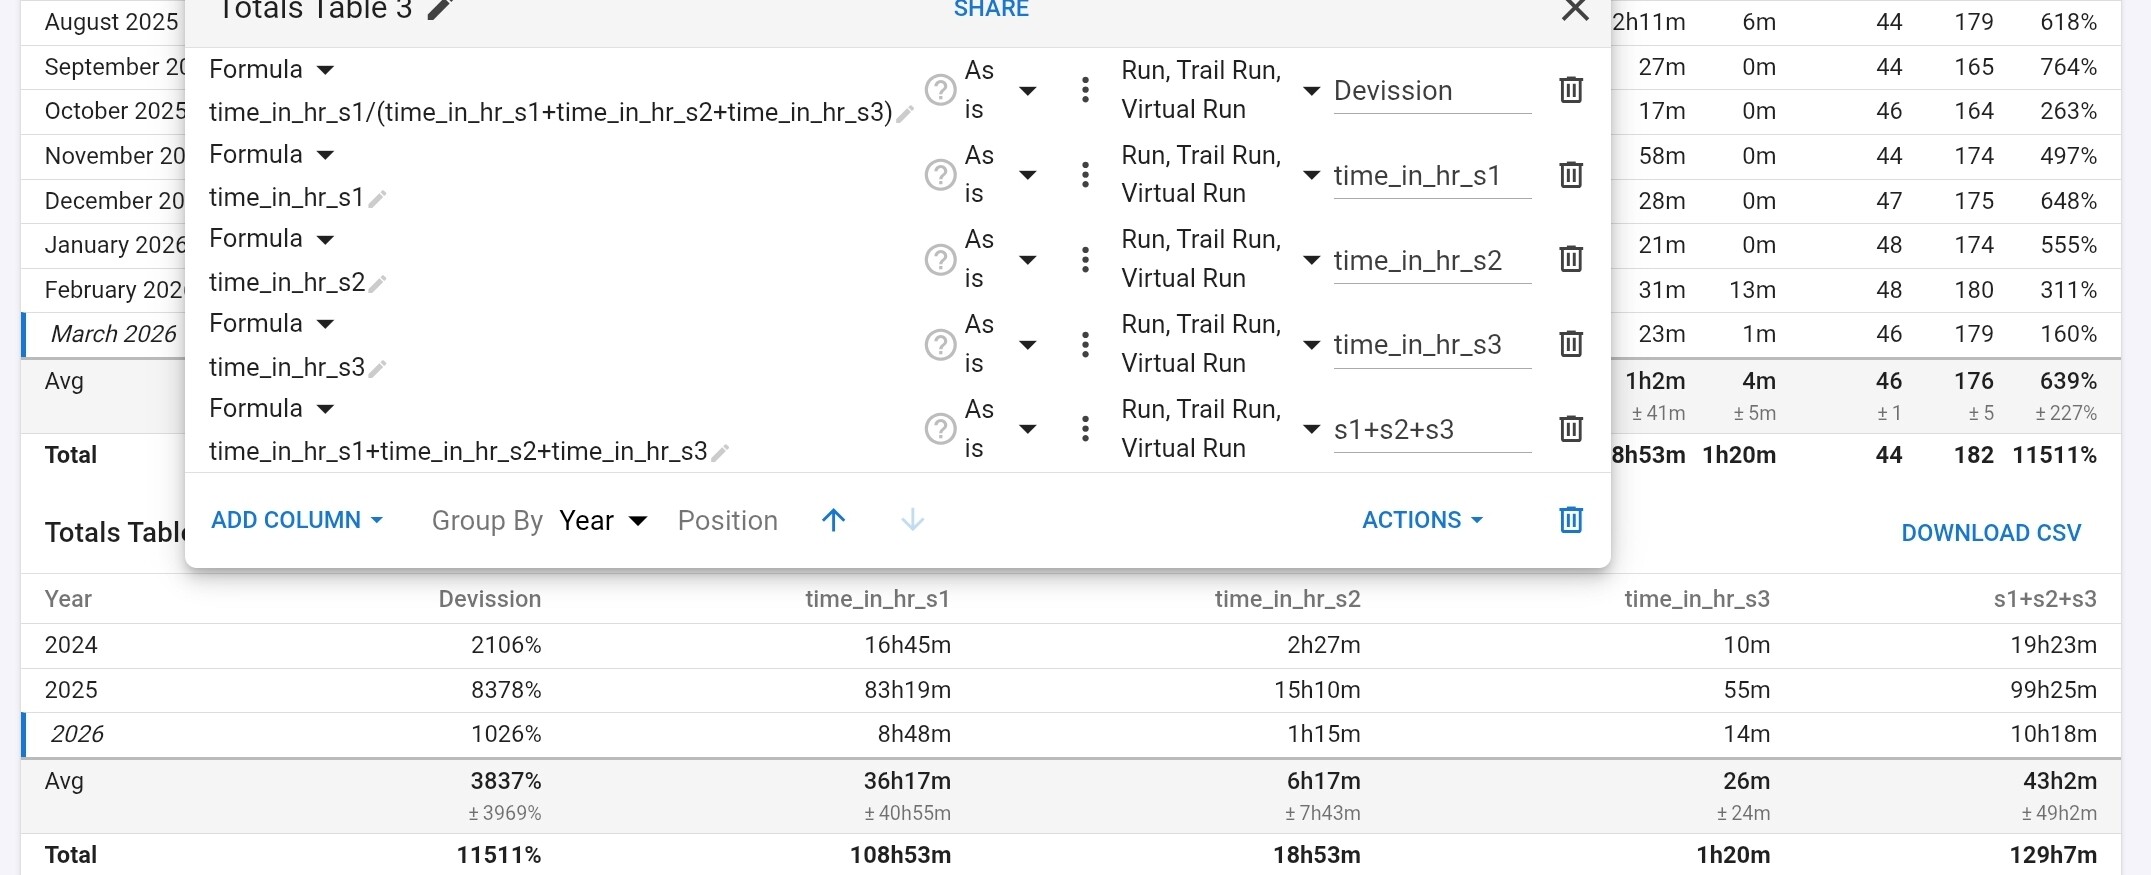
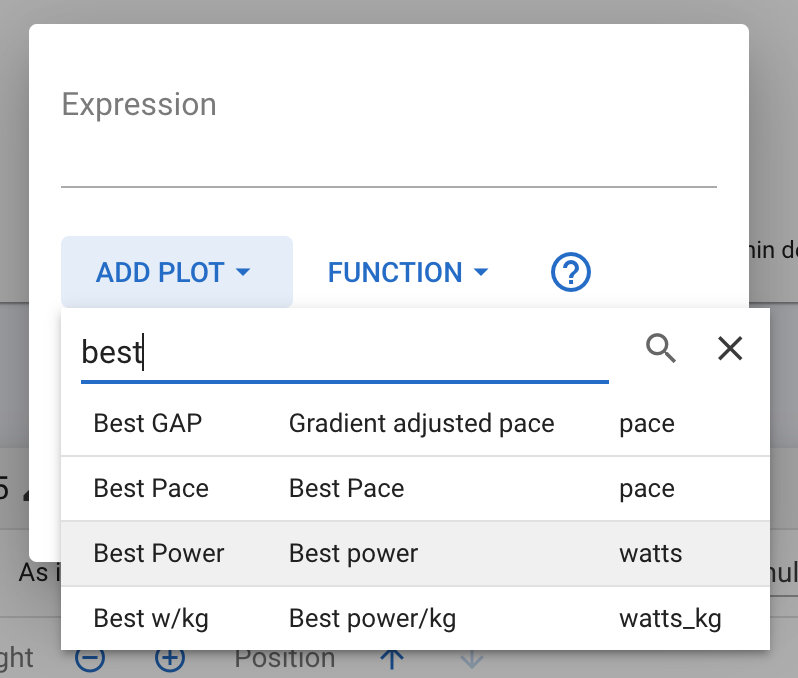
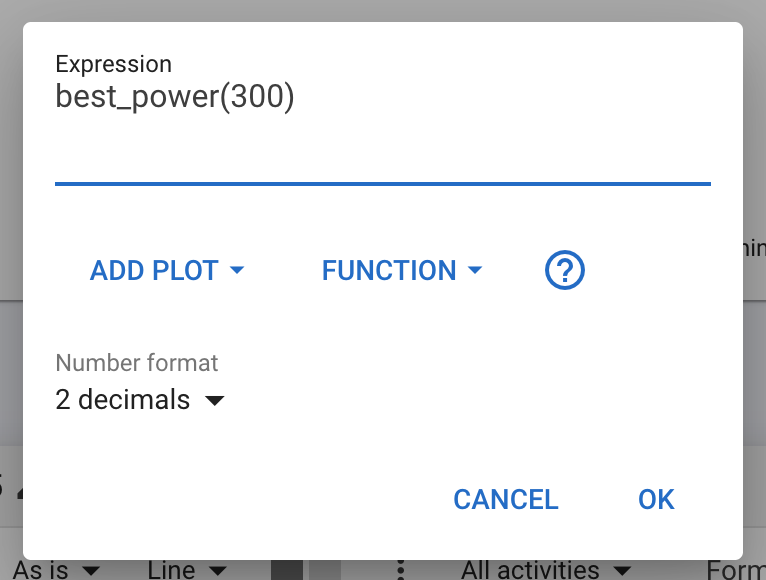
If you select a plot with argument (e.g. the duration for “Best Power”) then these are prompted for and inserted into the expression:

Advanced Usage

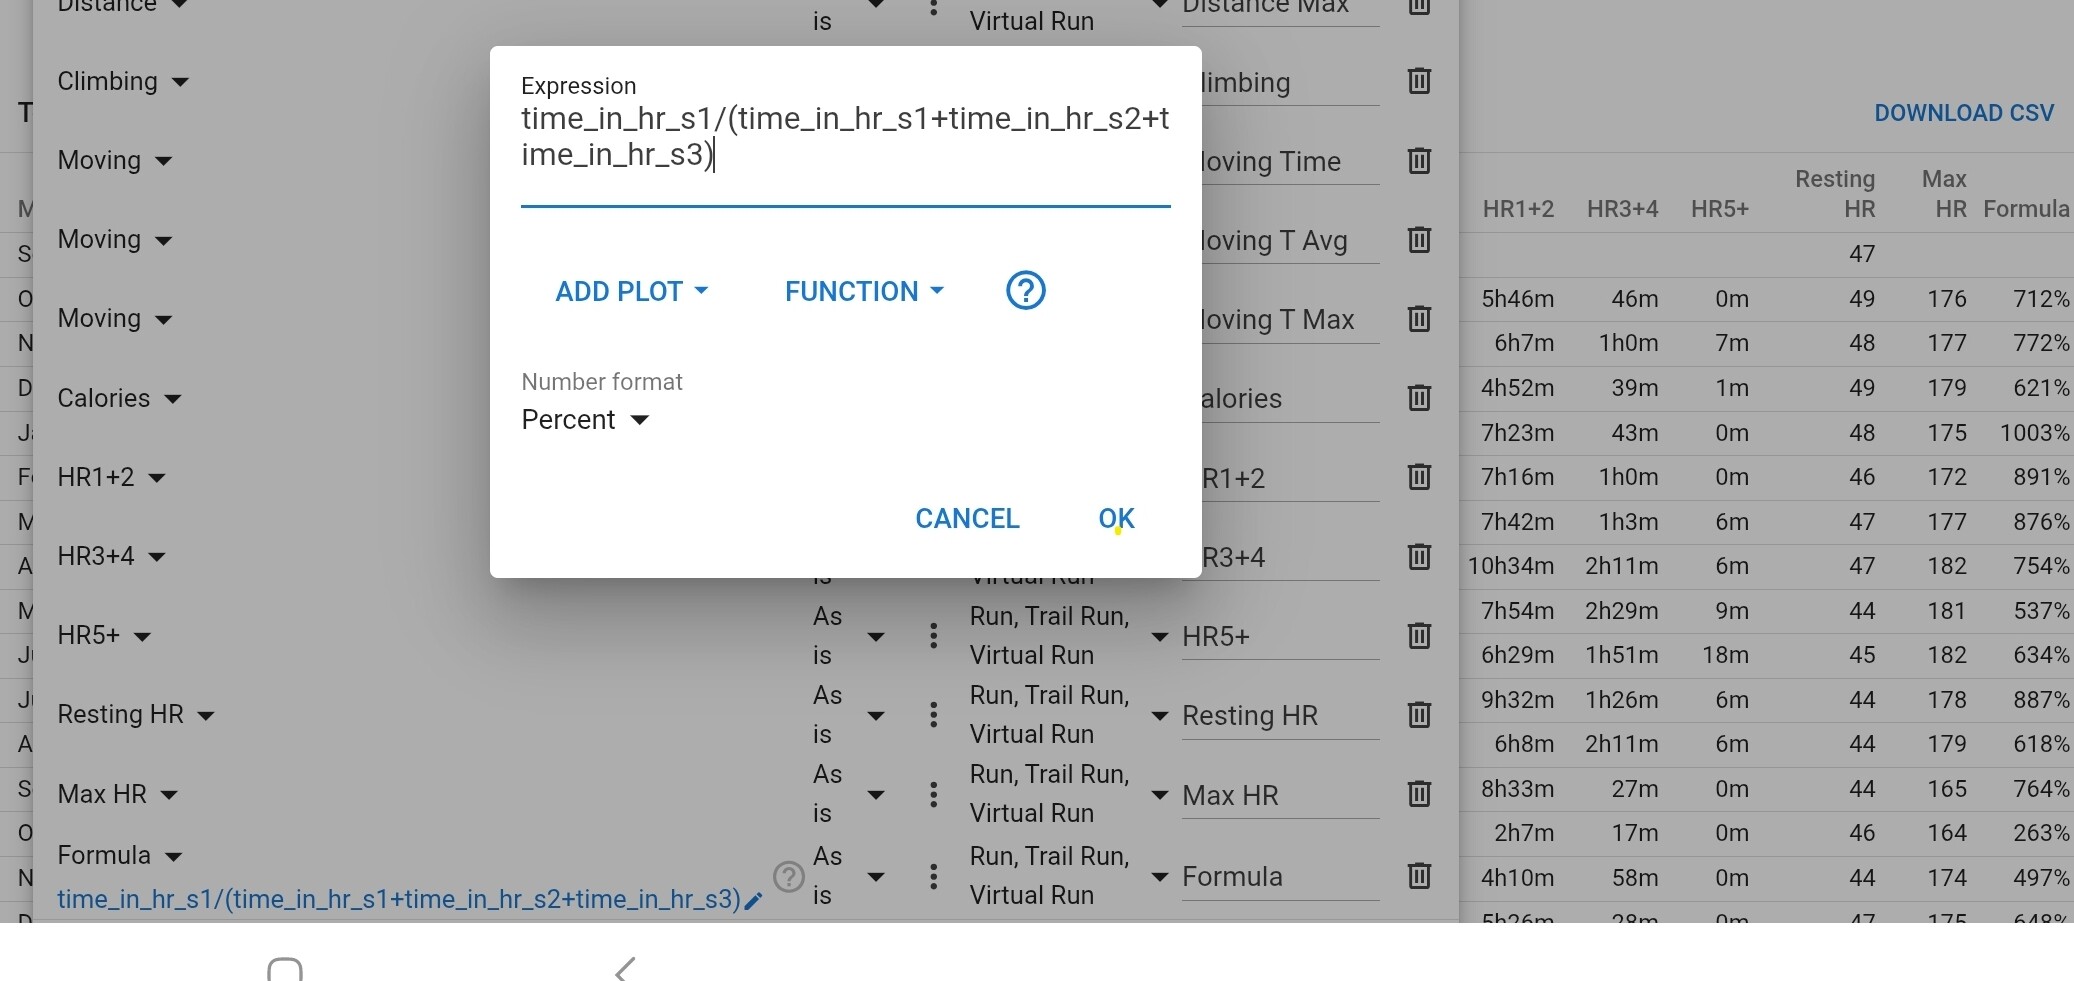
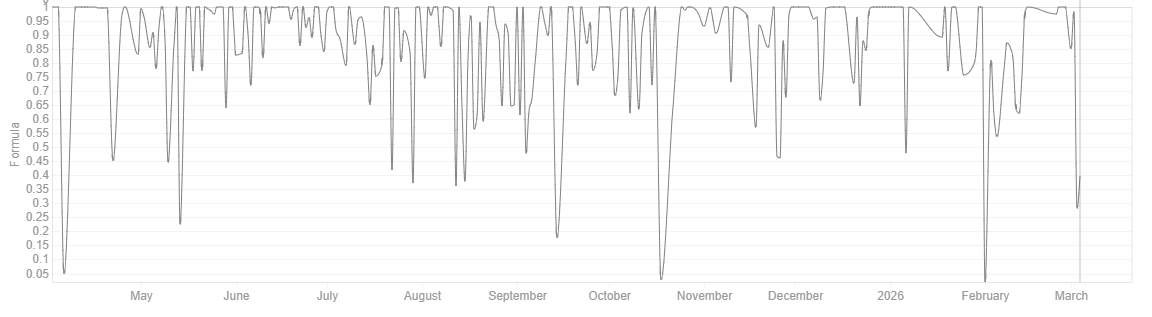
The expressions are evaluated by mathjs and most functionality is available in Intervals.icu.

The formula is evaluated once for each day in the date range. You can assign values to variables and these carry over from one day to the next (0 for the first day). You can create multi line expressions where the value of the expression is the value from the last line.

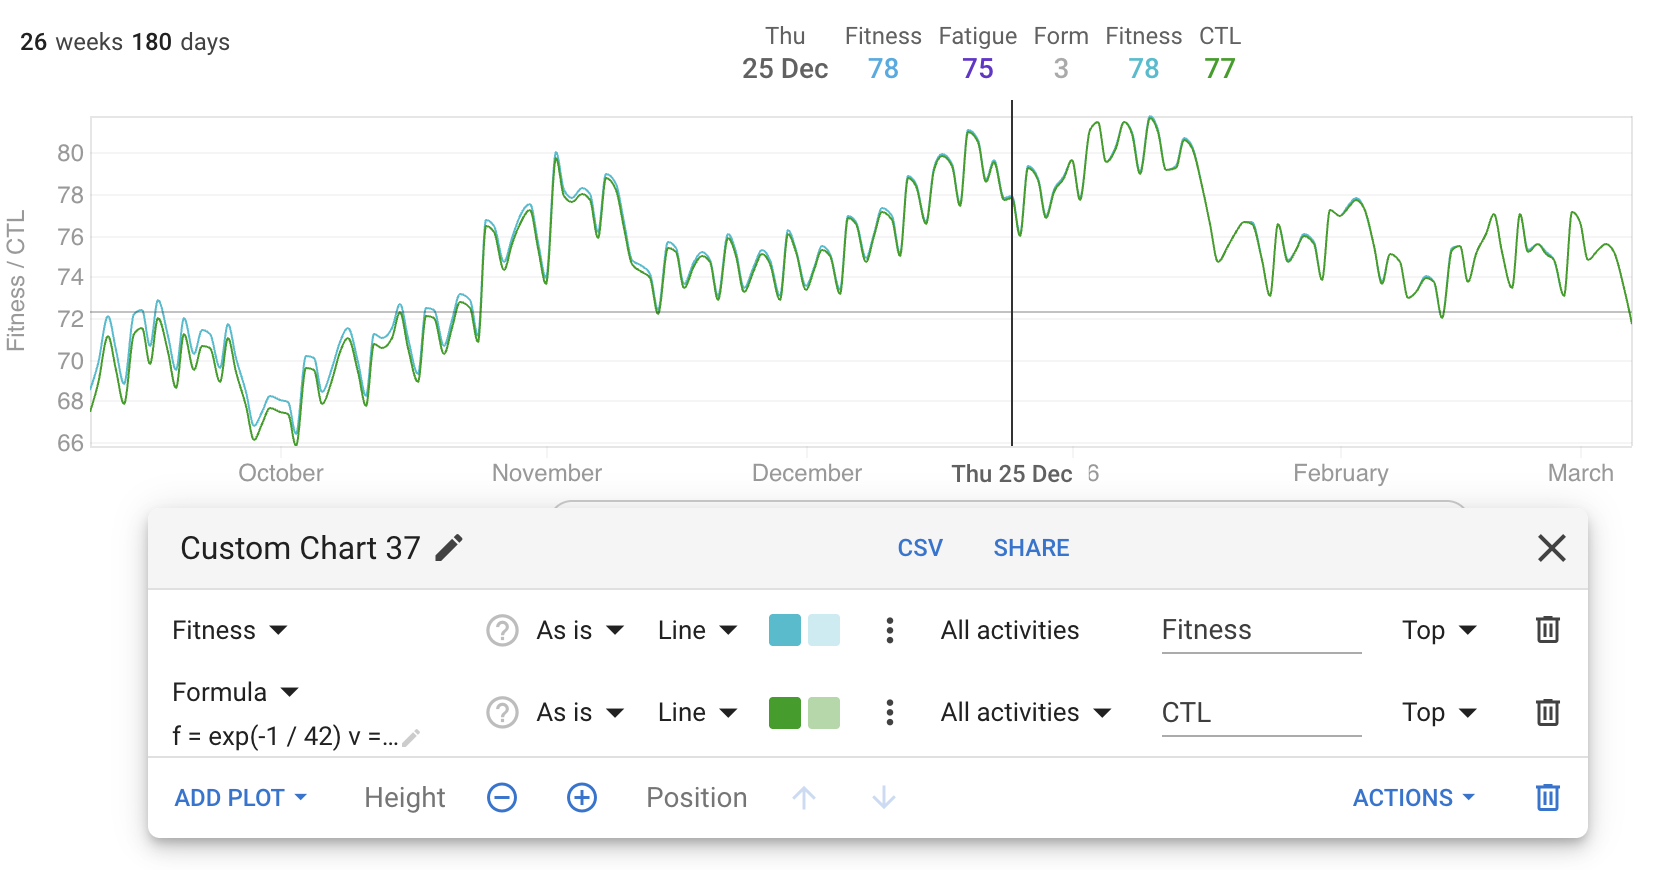
Here is the exponentially weighted moving average for fitness (CTL):

f = exp(-1 / 42)
v = v * f + (fitness_load ?? 0) * (1 - f)

Note the use of the ?? operator to convert null or undefined fitness_load (no training on that day) into zero.

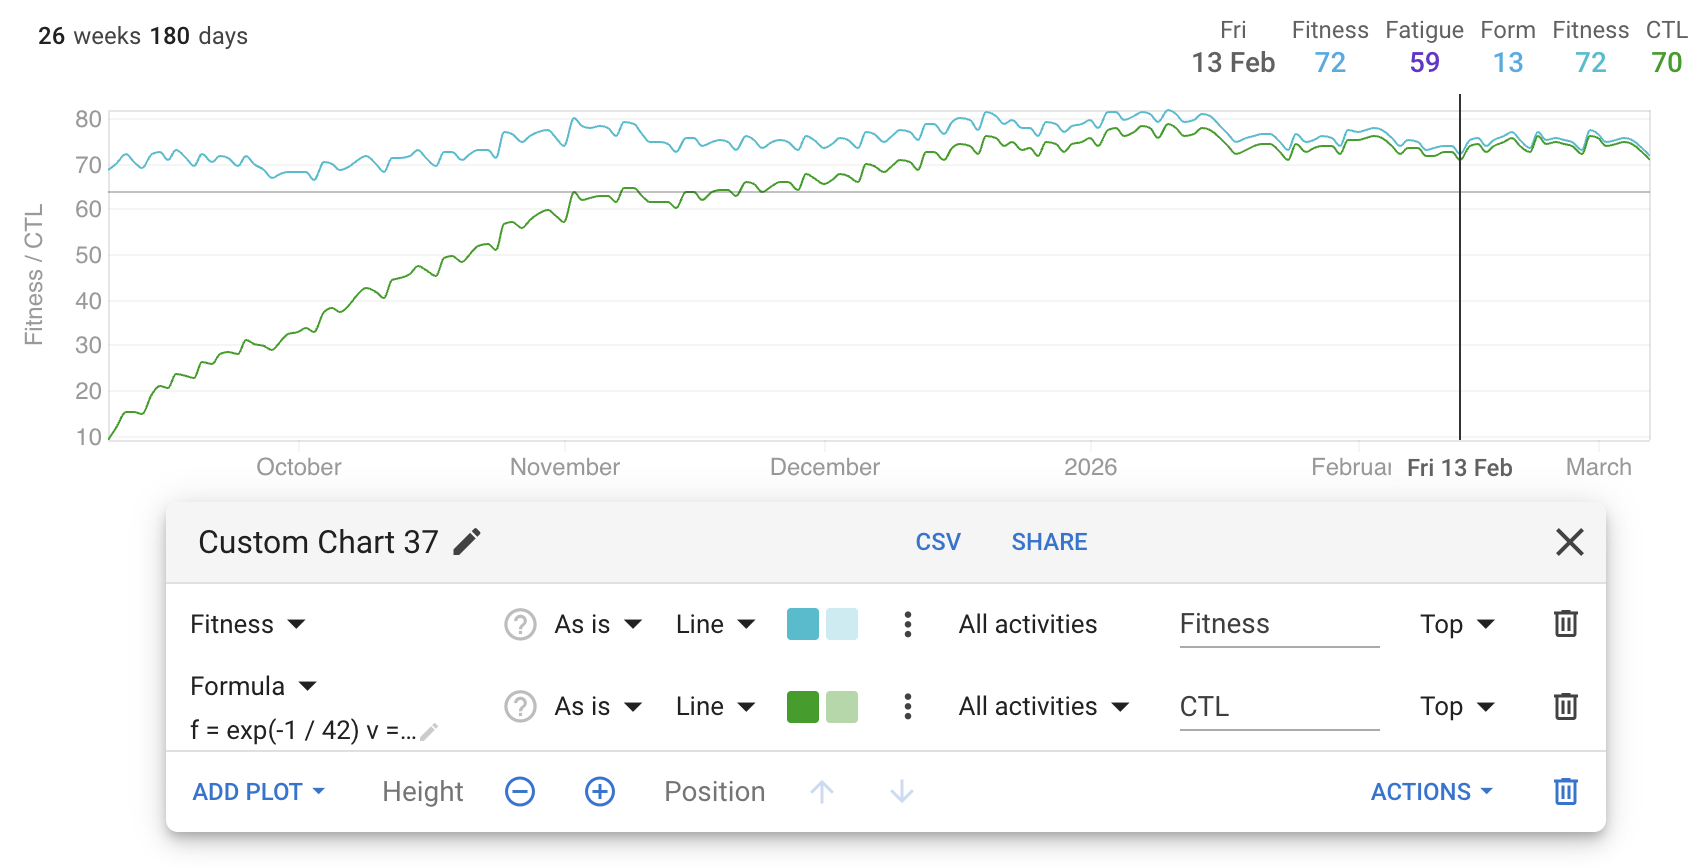
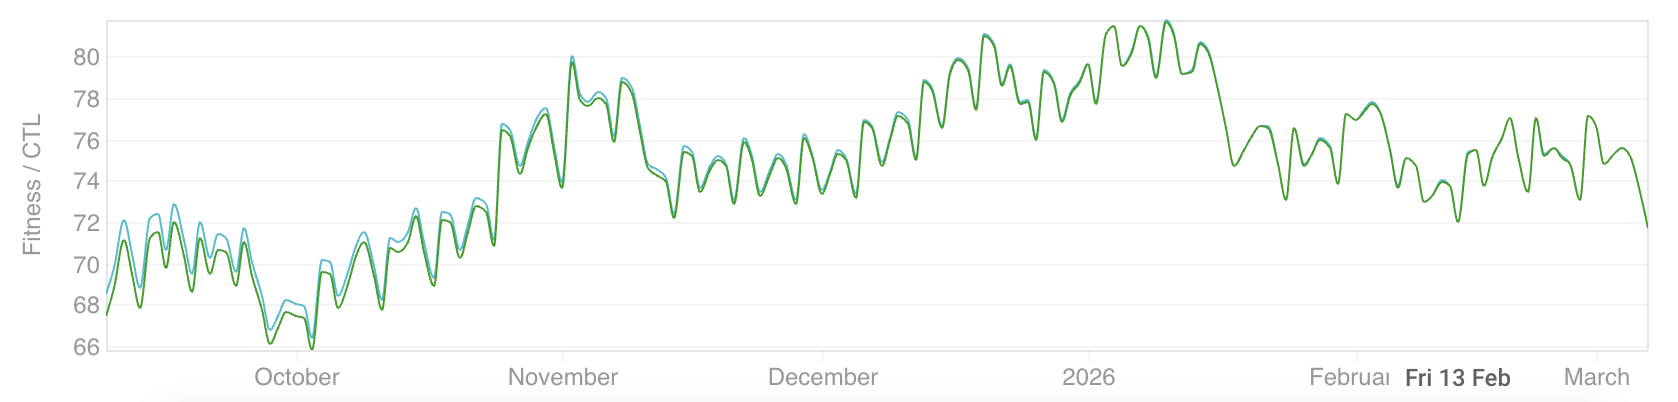
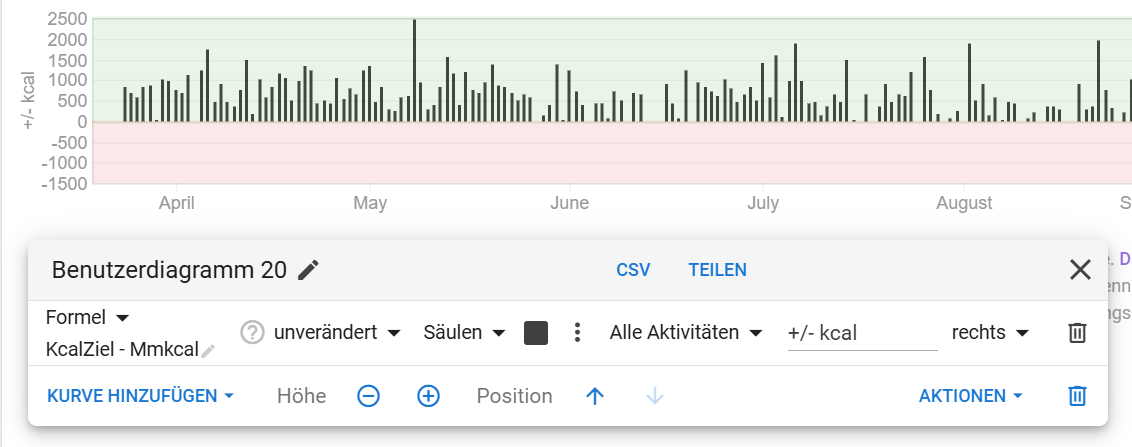
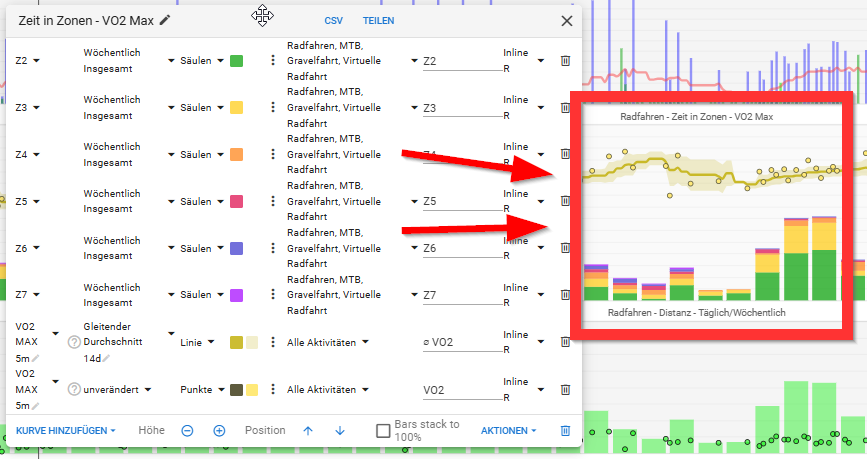
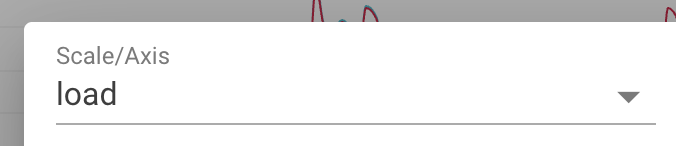
I used the dot dot dot menu for the formula plot to put it on the same axis as fitness:

To get this to match the built in “Fitness” plot you need to change pre days to fetch more data before the start of the date range.


28 Likes

Very nice addition!

1 Like

This is fantastic for us non-programmers, thank you!

1 Like

Trying to use the formula to calculate “percentage time spent in zone 1+2”
but I must be doing something wrong because I get values way above 100%

I’m using “time_in_hr_s1/(time_in_hr_s1+time_in_hr_s2+time_in_hr_s3)” as the formula

1 Like

Your formula works well for me.

Awesome, thank you.

strange, for me the formula does not work, the results of the formula are way to high, way above 100%.

Is seems the devission is the problem “time_in_hr_s1+time_in_hr_s2+time_in_hr_s3” works and time_in_hr_s1 works but deviding the two messes things up.

EDIT:

The formula works is charts but not in the new Totals-table.
When you Group by Day the results are correct, but when you group by Week, Month or Year things go bad.
The Day-results get summed when grouping, instead of calculating the totals for the week(group) and then deviding.

3 Likes

Am I correct in thinking that there’s no way for the formula to use data from previous days (apart from variables created specifically for that)?

Yes. I suppose we could add a prev binding and make the expressions a bit more concise?

Well, I meant more things like averages over arbitrary periods of time, rather than just the previous day itself - but that would probably massively complicate what’s meant to be straightforward.

If your moving average is for the field you are calculating you can add that on after like for normal plots.

No, it would be used in a calculation. Not a problem, just thought I’d ask.

Mathjs supports arrays and there is a mean function so you could probably implement a moving average quite easily. I haven’t had much time to play with this and figure out what is possible yet.

We probably need to add a “pre days” option to start n days before the date range for moving average type calculations.

We have added pre days and an example calculating CTL to the original post.

1 Like

Thanks @david and @ryandev for this feature. It’s brilliant. It’s yet another reason for me to recommend Intervals to friends.

Could you please check whether a bug has crept in? I had been playing around at creating different formulas when the feature first dropped. Approx 3 days ago, I found that when I select a field to add it to a formula (Add Plot in the Express dialog), the selected field does not transfer to the Expression.


Browser: Chrome 146.0.7680.72

Thanks in advance to taking a look at this.

Thank you for the bug report, the fix will be live soon.

I would like to create a bar chart (or column chart) to show my daily calorie balance. I simply subtract the calories consumed from my total daily calorie allowance. This works perfectly with point and line charts, but for some reason, the bar chart isn’t displaying negative values?

Thanks in advance for the support!

Interesting so except using this new formula feature, there was no other way to chart time spent in HR Zones on the platform?

There is a way …

Michael

1 Like