That’s great unless your last experience of coding was with Basic and Fortran using punched data cards being processed in a computer the size of a small office block. 
3 Likes
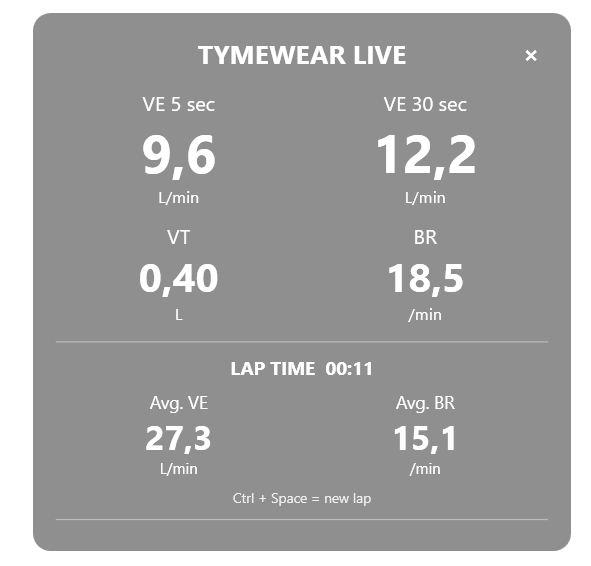
Just developed a little overlay tool for windows. I can use it in Zwift as an overlay view so that I don’t have to use my garmin or TW app to view the data. A direct screen is little easier.
Just a few fields visible and also possible to get averages for laps. Maybe I can add some extra calculated metrics? Like BR procent changes towards a baseline value that you can set with a special lap button and then when you press on the lap button you see the difference to that baseline…
But ok, work in progress…
3 Likes
Whoa!  That looks impressive — so it’s an overlay on the Zwift screen?
And how is it implemented technically? Where and how is the data transmitted? And is it possible in MyWhoosh? Yeah, it would be convenient to see ventilation metrics on the computer screen rather than the bike computer. Plus an immediate calculation of BR growth.
I usually have VE 15s and then VE, BR, VT Lap. I thought it would be nice to be able to record a baseline BR/TV so I don’t have to keep those numbers in my head. I think in the Connect IQ app this could be implemented in the future, if the concept of assessing stress via BR/TV drift is recognized by TW itself — they probably evaluate certain conclusions more cautiously.
You can use it on any windows device. And then overlay in Zwift, Rouvy, MyWhoosh or just connected to another device.
Connection is directly made to TW strap for the 2 sensors over bluetooth.
I gonna try it out later today, see if it is ok and what tweeks I can do to make it better. Currently I will also record with the TW app so I have all data after my ride. But goal is to export data also and maybe merge with another file like from zwift or something else. But ok…work in progress 
I can also add this as a metric, because now I quicky added some fields but no idea which one is nice to view, or not. Sometimes you use BR% towards a baseline? But also BR/TV?
Very cool.
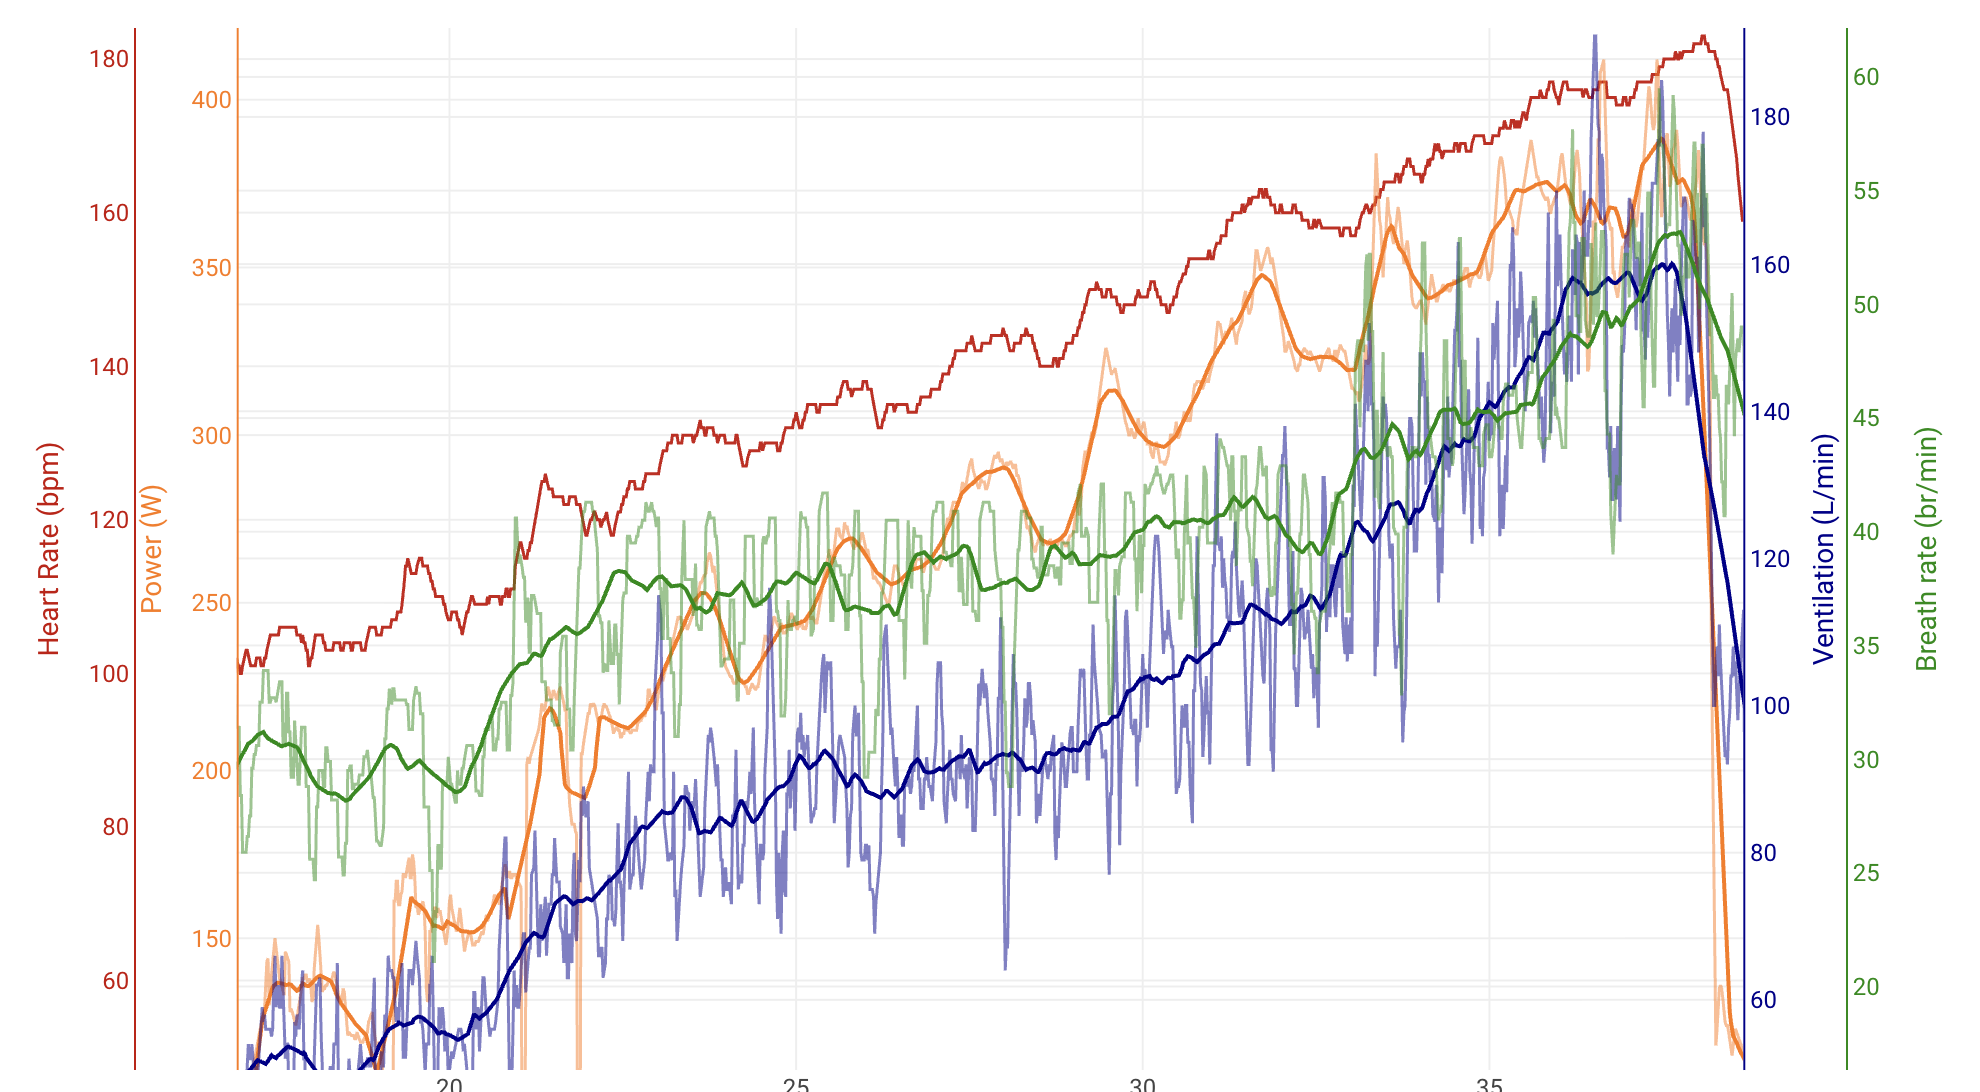
Did a restest after haveing some time off. I feel like the breakpoints are getting easier to detect as I look at these. What do others think
Can you share your Ventilatory Data Visualizer. chart?
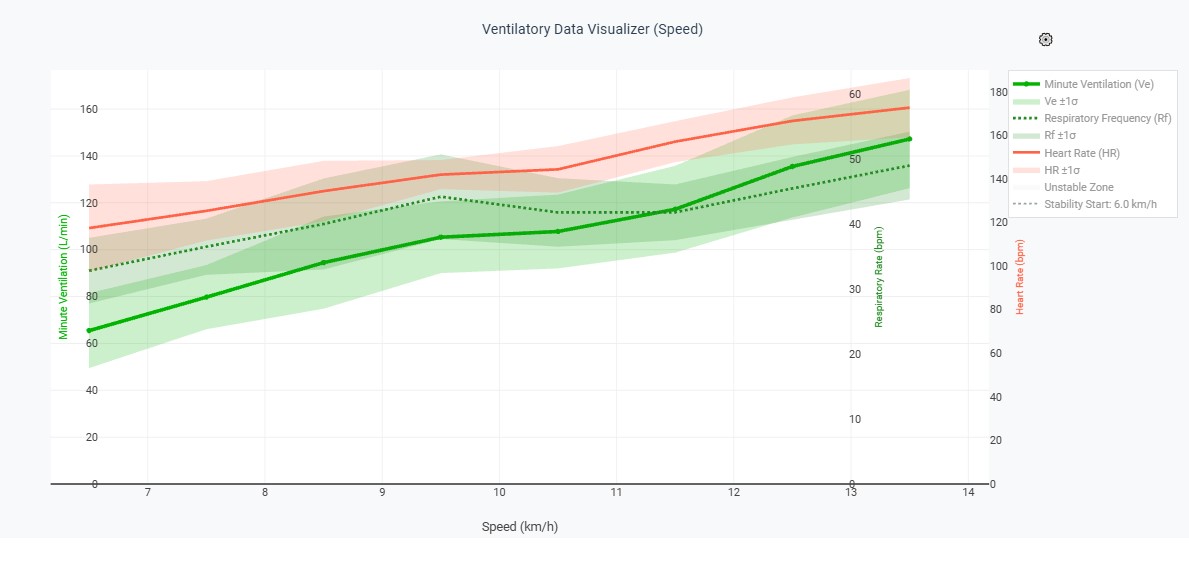
There’s no clear baseline here. When 2–3 steps have stable ventilation that isn’t rising. On a graph like this it’s hard to determine the aerobic threshold. But it’s probably VE 90-95, BR ~30, Power ~270.
The anaerobic threshold VT2 is usually always more pronounced: VE 116-118, BR ~36, Power ~340.
Some of that might be because of the warm up. That was a bit more intense but I walked for a couple min to let everything calm down again before starting the test. Here is the whole workout. warmed up a few min, then had to tighten down shoes, more warm up then trying to control things before starting the test
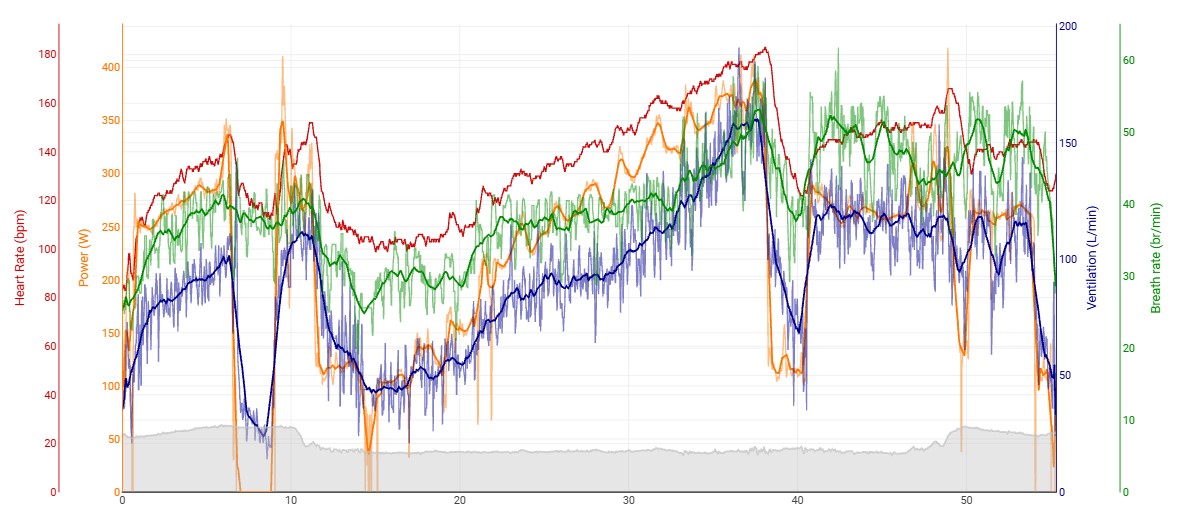
VT1 not conclusive
VT2 Speed: ~11.5 km/h Respiratory Frequency (RF): ~45 br/min Minute Ventilation (VE): ~120 L/min
1 Like
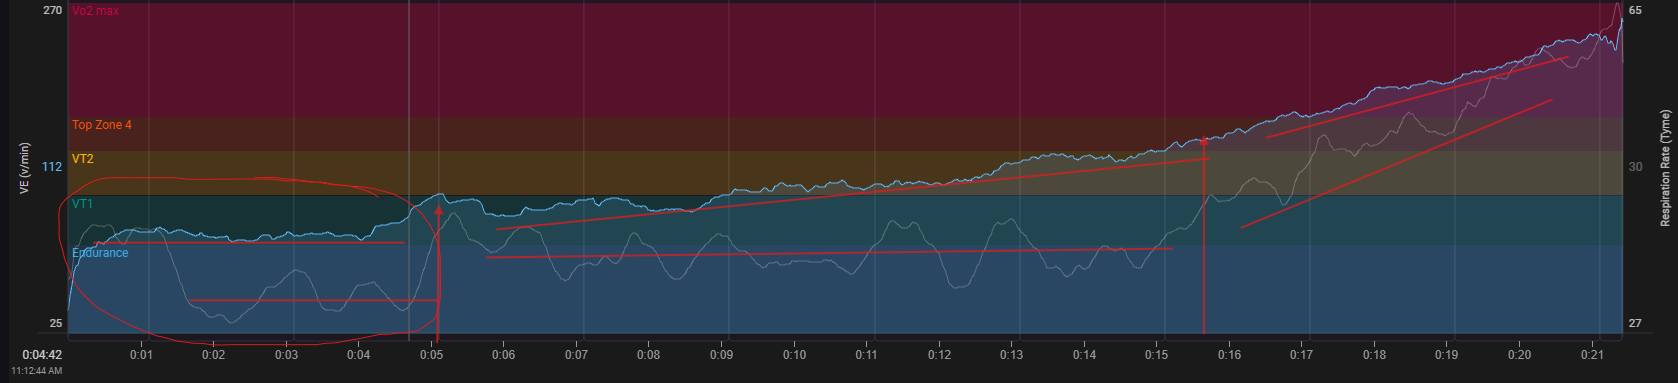
After the warm-up, ventilation starts rising basically from zero. Here it’s desirable to have stable readings for at least 2 steps.
Here’s one — not ideal, but it roughly shows that the first 4 minutes — 2 steps — ventilation is stable, as is breathing rate (MA60).
From minute 5 to 15, ventilation increases monotonically but smoothly.
From minute 15, there’s already fast growth.
Here you can see very precisely where the breathing pattern changes — and consequently where metabolism changes.
1 Like
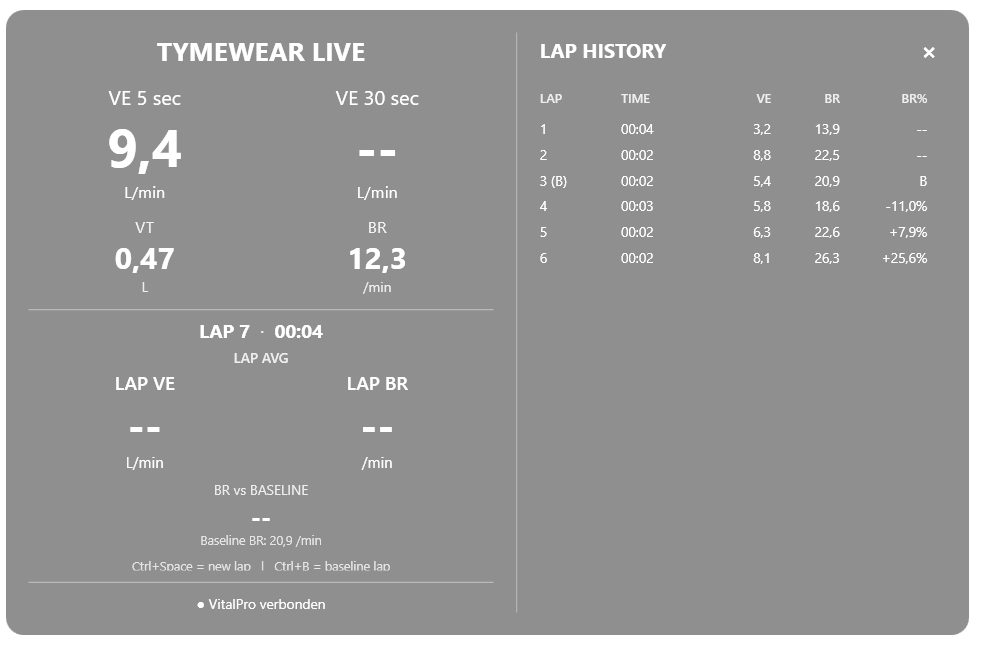
Well…used my screen during my zwift ride. Here a screenshot. Sorry for the bad quality.
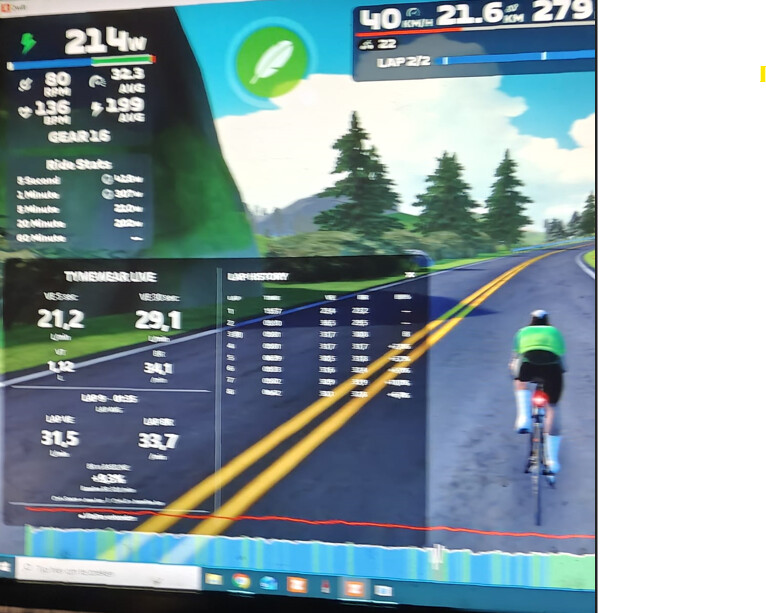
But it was a very good workout. Goal was 45min around VT1. Too bad for the quality but otherwise you could see I did a baseline for lap 3 and in left corner the lap data you can see live BR% towards the baseline. And when I finish a lap in the right overview you would see avg VE, BR and % towards baseline. Was perfect too pace and watch realtime data.

At the end BR began to rise almost above 10%, and RPE was also little harder then in the beginning.
Power around 200w, and that is more inline in what I would expect (VE for VT1 was 36).
Overall, this is was a perfect ride for validating the use of the tymewear strap.
2 Likes
In the next days, if I find some time I will try to make it better and if ok for use, I can share my project executable for if people want to use the screen during indoor training, no matter what platform…
3 Likes
Yeah, that would be great.
I’ve actually already started building an overlay for myself. But I have doubts about how well the raw data from the sensor matches the data in the app. Is it possible that the TW app “smooths” the readings (VT), for example automatically removing artifacts or? How well does the raw data match the readings on, say, a watch or bike computer? Although my breathing rate does match.
PS
The stress criterion of BR 10%–12% is purely my observation, empirical. It’s probably very individual here too and needs to be tuned to yourself.
The second important point — BR is only relevant at intensities below the anaerobic threshold, or rather around VT1 and below. When it comes to threshold workouts at FTP/VO2 — there the leading marker is VT, because breathing rate rises with intensity, and only when breathing depth drops sharply does it mean stress for me (well, just like in normal tests, only during the workout).
2 Likes
very cool! the style reminds me of Rainmeter skins. i’d definitely be interested in testing the app.
Arnar was recently on the Ignition Coach Matchbox podcast and mentioned they were working with Zwift on integration but your app might be more useful for more users
1 Like
I have updated the windows app. Few tweaks in layout. So VE30 and BR are visible on top.
During a lap you can view current lap VE and BR values. And if the baseline is set you can also see current percentage of BR against that baseline. With key CTRL-b you can start a baseline lap. With CTRL-space you start a new lap. For every finished lap you see VE, BR, VT and BR%
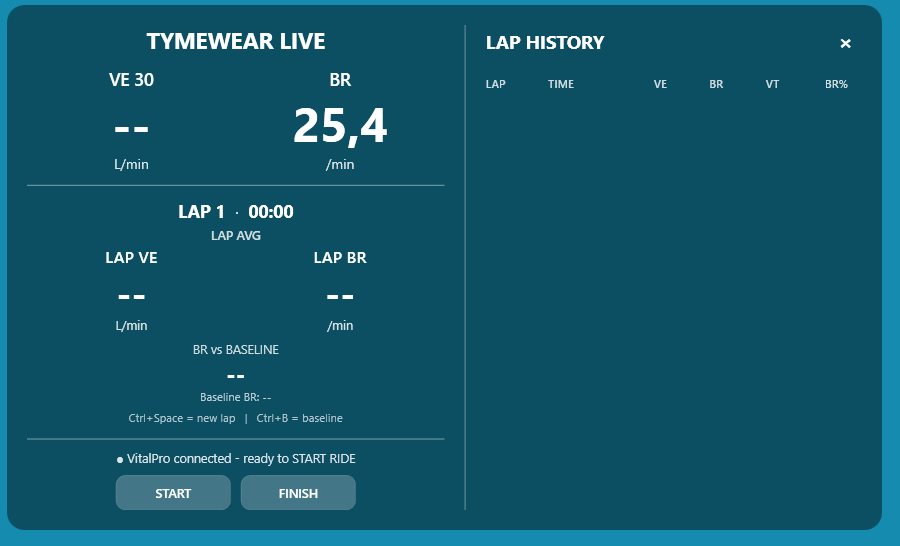
When you click on START, all tymewear data is recorded in the background. When click on finish, you get a popup were you can select your fit file were you recorded all other data, for the moment this is based on a zwift fit file. So if you used zwift, and you just finished your ride. You can then select that fit file and the tymewear data that was recorded will be merged into a new fit file that you can upload were you need it to be. In the TW dashboard, intervals, strava, …
Still in test mode so have to see in live working mode how good this merging works. But I had used this evenings zwift and tw fit file and the merging was ok. So…let’s hope. When doing my next indoor ride, I will come back with an update. Tips and insights always welcome…
I can also look for other platforms like rouvy, mywoosh, tpv, … If their fit files are more or less the same then zwift, the merging could also work for those platforms…
1 Like
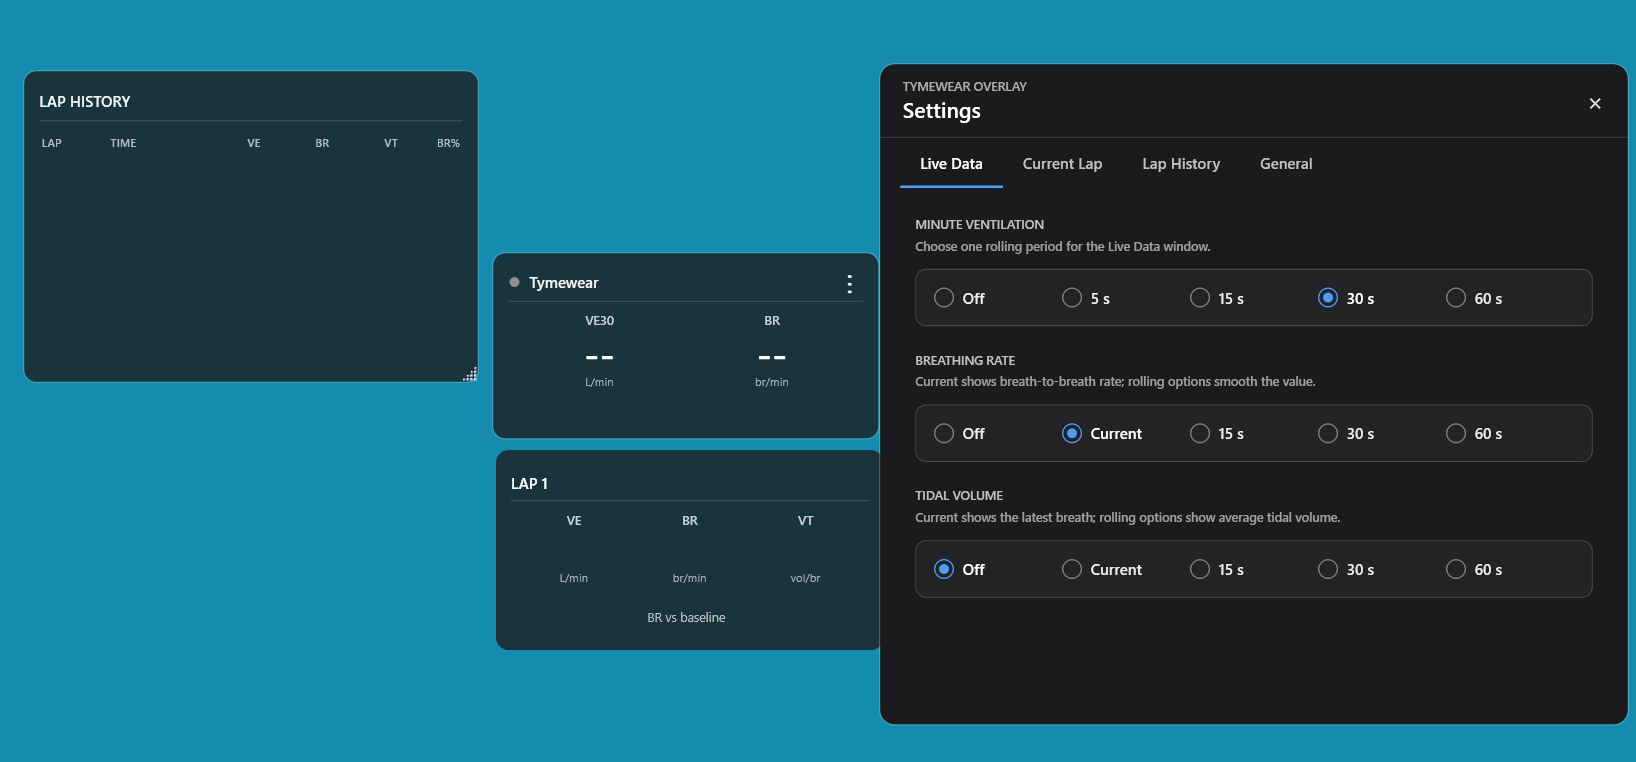
Some new updates again:
- Separate screens for better placement within your platform. Positions also saved when closing the app.
- Menu bar where you can select which windows will be visible or not. The main live window is always visible. Also start and finish recording menu items added.
- Settings menu item so to be able to select which fields you want visible in your screens.
1 Like