I was about to comment on Lap average, but I see it’s already taken into account. Thanks. Waiting for the release.
But a question about the FIT recording — can power, heart rate, and Core temperature data be added to the fit file?
Or do you have to merge fit files recorded on different devices?
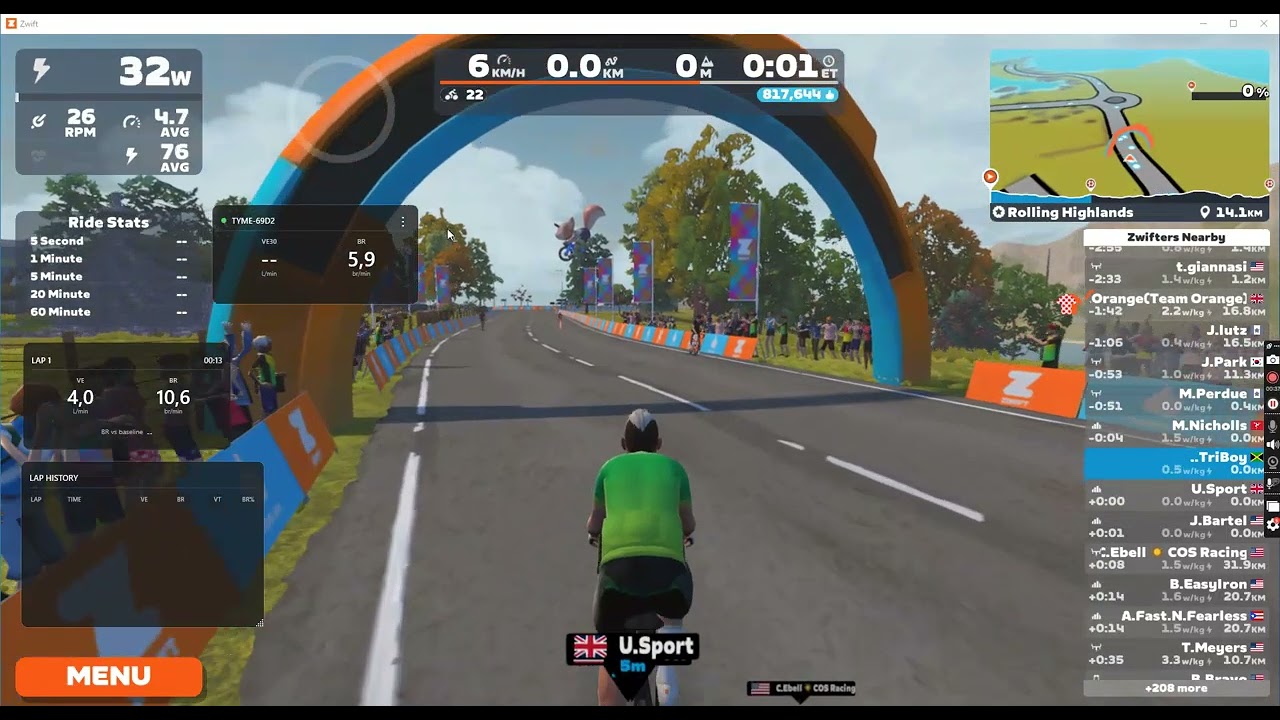
Currently, how I developed it (with intent for personal use so maybe not ideal for general use) is that all the tymewear data from the breath sensor is recorded in a local fit file. The main fit file comes from zwift. All data you have available there like power, heartrate (from TW strap or another) is normally within the zwift activity file when ending your ride. That file is used as the base, and all TW breath data is added (merged) into a new file that is available in a local map. you can upload this file into intervals.icu or strava or whatever you like. Even in the tymewear app.
I don’t have a core sensor, so I don’t know how you track this data or use it after a ride? Where do you see live core temperature data? is it a seperate app? Not in zwift I suppose?
But normally it will also be possible to add some other sensors and view this data in this app. I am thinking about reading power meter data from my wahoo kickr, and make it also available within the screens because the standard zwift power or lap averages are not that good imo.
I try and make a video later on when testing it within zwift…
I want to share two more observations: dynamic threshold detection in each workout, and how a cold (above the neck) affects heart rate/ventilation readings.
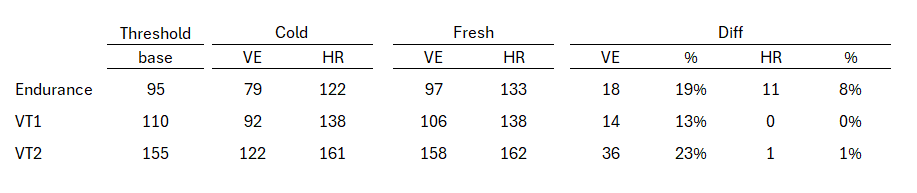
I didn’t do an “official” TW test on roller skis. I did a step test and then determined the threshold VE values. They’re in the Threshold column.
First observation: dynamic threshold determination of TW dashboard based on regulayr training is very close to the test. That’s impressive.
Second observation: 3.5 days after manifesting a cold “above the throat,” the first easy roller ski session with 2 pulls. I immediately noticed that my heart rate was generally normal, slightly toward the upper values — but surprisingly low VE values. After the workout I compared the dynamic threshold determination in the TW dashboard. I don’t have a clear explanation for this. But it’s obvious that a cold affects the metrics.
Is that the zone detection you can select in the dashboard? Yeah, that seems pretty accurate if I select that option. Better then the real treshold test
After 15min BR began to rise more and VT dropped, so VE stayed more or less the same. Power also was higher from that moment as is HR. Not significant, but enough to see values go higher.
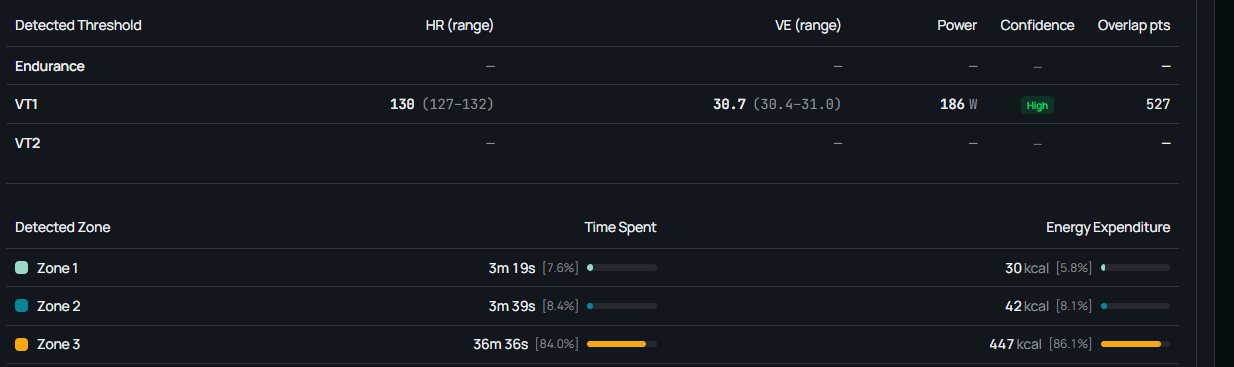
So what can I make of this ride? Ventilation was more or less stable but because BR got higher, it got little harder in second part of the 40min. Maybe I also was just above VT1? According to my treshold test VE VT1 is around 35 and BR VT1 is around 32.
What is the best approach to conduct a sub VT1 ride? Because when I check the beta zone detection in Tymewear dashboard, it gave me this and according to those values I did 36min in Zone 3. What was not the goal of my ride. Did I went to hard by going over 200watts?
For the Baseline, even at VT1 you need time. The warm-up is usually 12–15 minutes, sometimes 20, until the readings stabilize (maybe it’s the warm-up effect? For me it usually coincides with CoreBody 37.7–37.9).
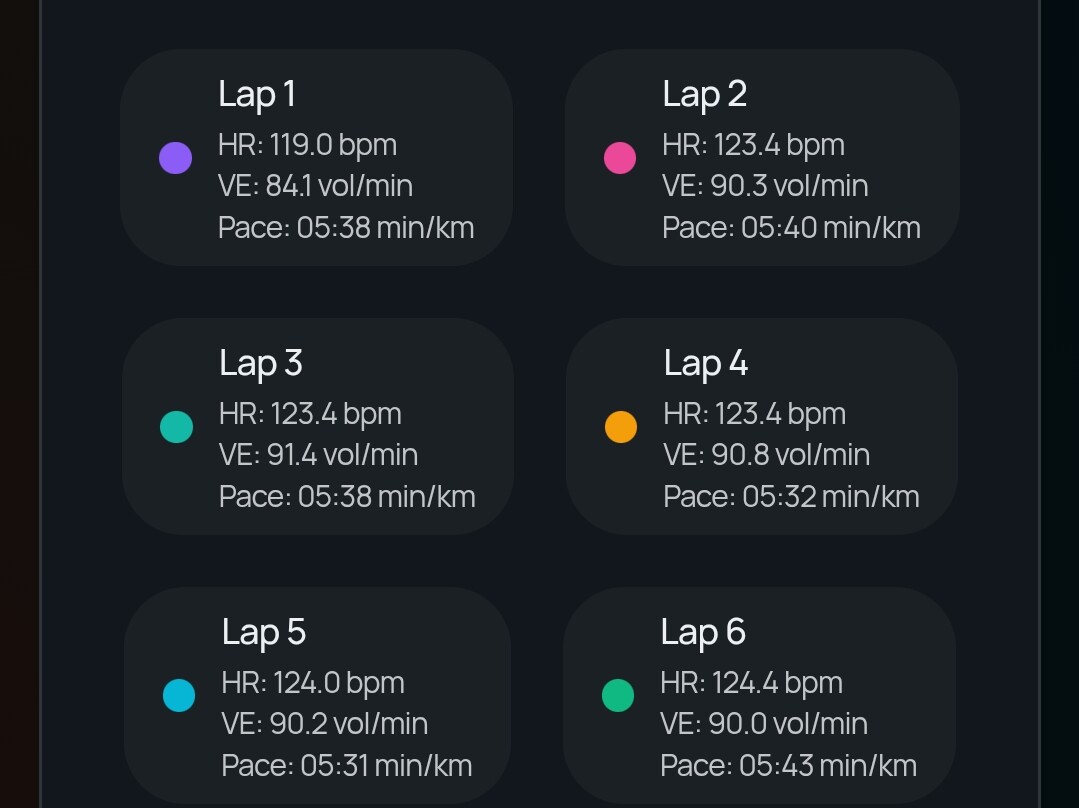
In your table I see the pattern changed on interval 6: VE -2.3%, Power +10%, BR +11%, VT -14%.
But once again I’ll point out, 10% is very approximate. It makes sense for you to get more practice so you can dial in your own “stress” criteria. Plus 5 minutes at VT1 is honestly a bit short. For VO2 my intervals start at 3 minutes (I don’t do short 30/15s), for VT2 intervals usually from 6 minutes, and for VT1 from 10 minutes.
Regarding “dynamic threshold detection” — just today TW sent out an email that tests are now calculated immediately, automatically (but they emphasize the importance of following the protocol), and further down the line, threshold detection from workouts and monitoring over time.
But here I noticed 2 things:
For a correct (more or less) determination of thresholds from workouts, you need fairly high intensity. If I ride 3 hours not above zone 2 (not above VT1), it underestimates Endurance and VT1. But if in such a ride I have long pulls at intensity up to VT2 or even above — then accuracy increases.
Heart rate/power ranges probably also matter.
Overall it’s still a beta version and I wouldn’t rely on it, though it’s very promising. I hope they add the option of testing for the treadmill and track separately, as well as for the trainer and outdoors separately.
Yes, looks like the plan is done. Even a little practice is enough to dose VE precisely — it’s actually not hard.
But once you build up more experience, more data, and “get your eye in” — the real magic starts. It becomes very obvious how your VE and, along with it, RPE change compared to pace (or power on the bike). When you feel off, when yesterday was a hard key workout and you slept badly, and today you go out for a run and at VE 90 your pace is slower than 7 min/km. In moments like that you really start to appreciate ventilation data. A fantastic tool.
I’ve noticed this as well. When there is a range of efforts include above VT2, everything seems more accurate. If I only do Sweetspot/Subthreshold it seems to overestimate some of the effortswith the dynamic estimate pushing them into zone 4 when VT/HR/RPE were below threshold.