Tymewear owners - worth it?

))) Bingo! No point waiting for other answers.

I hadn’t eaten breakfast, and didn’t use gels until I’d burned 120 grams of carbs (the Garmin app shows fat and carb expenditure online), which landed right at the 2-hour mark. (btw Yesterday I had a VO2 workout, so my glycogen stores were already low.) It was exactly the carb shortage that collapsed my power from 200 watts to almost 130 — at the same effort (VE).

After that I stopped at a gas station, drank an isotonic and took in 120 grams of carbs (60 from a gel, the rest from a chocolate bar and a croissant). The stop took 20 minutes. After that, for almost another 30 minutes my power didn’t change no matter how hard I tried — the moment I pushed the pedals a bit harder, my VE shot into space. But after about 50 minutes the legs gradually started coming back to life, though I’d already reached the finish point.

Yes, I didn’t get my original power back. But this is a classic example of interpreting ventilation data. This sensor is just a goldmine of useful information in skilled hands and a real revolution in endurance training.

I’d noticed this pattern with power and ventilation before, when I forgot to keep throwing coal on the fire.
But my experiment was inspired by research on fasted training. That’s a whole separate topic, where the real effectiveness of such training is questionable because it’s extremely hard to accurately assess glycogen availability at the start of a workout and then catch the moment when you need to stop, because too much has the opposite, negative effect.
But having this tool in your pocket, you can experiment with fasted training more effectively (and yes, this isn’t about fat metabolism at all here, as one might think).

2 Likes

the Tymewear zones are different than other zonal models (eg. Coggan, Friel, etc etc), since those are based on power, usually percentage of FTP. throw out all of that :slight_smile:

as you’ve seen in the workout library, “endurance” workouts target VE in middle-of-Z2, not Z1. i think of that “endurance” label as a floor: ride near that power for recovery. remember that the HR and power were just for this test, they’re not set in stone. some days they’ll be spot-on, but some days higher or lower.

because in the past you’ve used a different zone model and sometimes VT2 is “Top of Z4”, and some days it’s not.

2 Likes

looks like @Timur has got you covered :laughing:

electrical HR chest straps tend to be more accurate than wrist-based optical HRMs.

where were your hands during the threshold test?

i see VE increase when i change hand positions from hoods to bars but it usually settles back fairly quickly. there’s a much larger change in VE readings riding in the drops or standing but if i’m using either of those positions, i’m not caring too much about VE at the time.

1 Like

I love seeing this breakdown for longer efforts. Now what about shorter VO2 efforts? Are you looking at VE after the 1st min, or just avg at the end?

Overall yes, roughly the same approach.

I don’t do 30/15 VO2 protocols - either 3/1 or a cascade. Yes, exactly the same: the reference metric is VE above 171 during the interval, I control work time / time in the zone above 171 accounting for “entry and tail” = workout efficiency. Duration is determined by BR/VT dynamics, but specifically in VO2 workouts TV is the leading indicator. And I adjust the next workout, selecting work time so that the “threshold” falls in the last 10–15% of time in the intensity zone. That’s “time under stress.”

I don’t look at heart rate; usually within a session it plateaus and doesn’t change after that. But if you look between sessions, it differs. In good condition my heart rate is 177, whereas when I’m “suppressed” it’s 168.

2 Likes

Hands on the hoods during test. Is position I mostly ride so…not a super big deal but just seeing some elevation in VE when going higher in position.

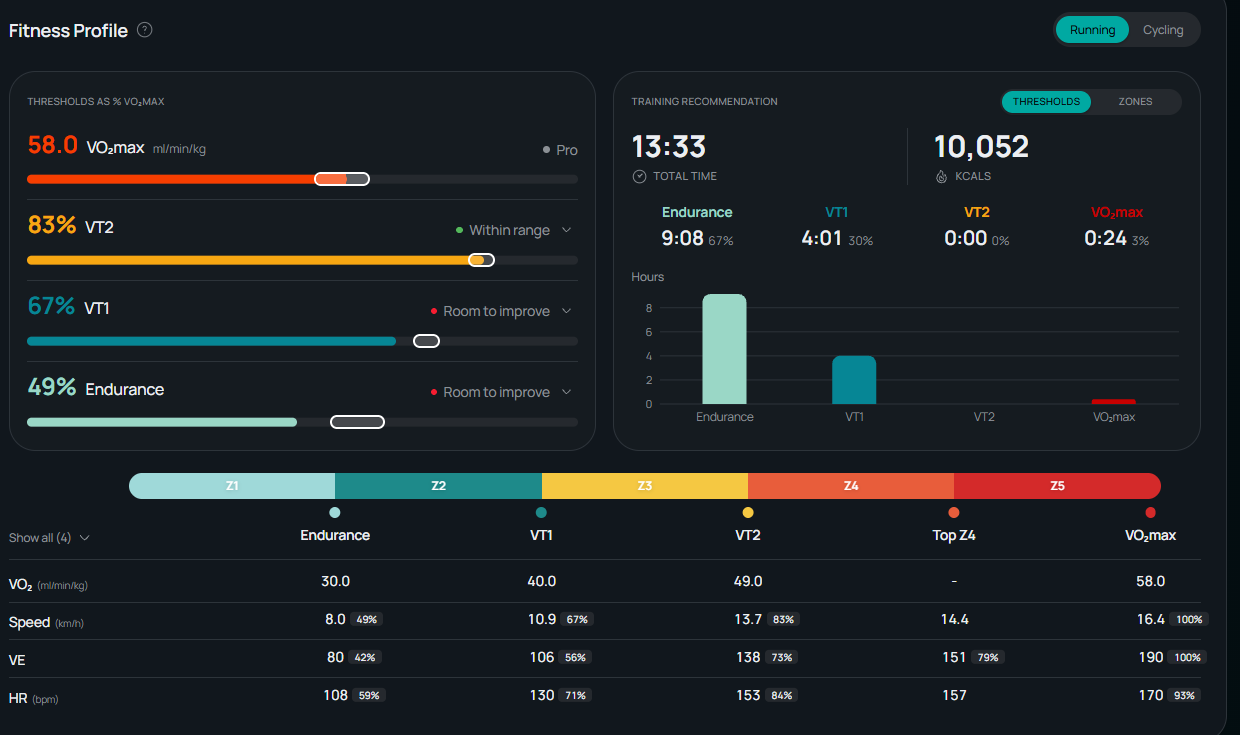
Yesterday received my results from running test. Seems quite ok. Only remark is that because I used the TW app on my phone the speed was not correct compared to my garmin. Used mph or I don’t know what ;-). But in calculation, speed is displayed well (but not when I check my zones, the km/min are not correct, but ok. I can convert it). Not a super big deal.

I tried to generate a plan but the combination run/bike is not that good, giving two bike workouts on one day ;-). Need to investigate more into this…

OK. Let me share my assessment of how form should grow with proper dosing of intensity and duration. If you dose everything precisely and always come in “fresh,” form comes back very quickly. Further form growth requires other factors and time.

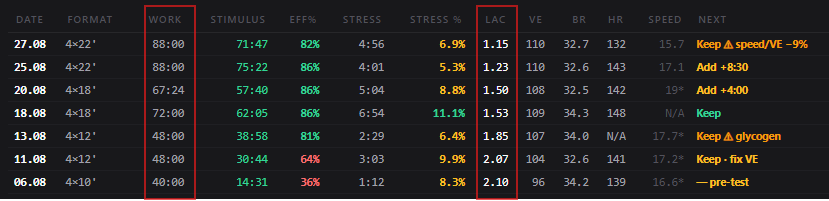
Example of a 3.5-week training block. This is roller skiing. My goal is to bring my ski form back at the end of summer for the autumn training block. The goal is to train at the top of zone 2, close to VT1 but not above it. I did a roller ski test and determined VT1 = VE 110. This intensity can seem deceptively easy (RPE 3–4), but I disciplined myself to keep VE no higher than 110.

Then I started training with a good margin. 4x10 at VE 96, then I began step by step to increase the work time in the target intensity zone. I monitored each interval with lactate measurement. The decision to add was based on the “stress share” and lactate readings.

  • Work — work time per plan.
  • Stimulus — all seconds with VE ≥100 (15 s smoothing): entry, work, and tails.
  • Eff% = Stimulus / Work.
  • Threshold — breathing rate BR ≥ +12% AND depth TV ≤ −10% vs Int1 (minutes 3–10, excluding cold start), 60 s smoothing. Main signal is BR, TV confirms. Condition: VE no higher than baseline +5% — otherwise BR rises from the surge, not from fatigue.
  • Stress — seconds of stimulus above threshold, across all segments. Stress % = Stress / Stimulus.
  • Economy check — speed per unit of VE dropped ≥5% (vs Int1 or vs the previous session on the same route) or signs of fueling issues → don’t add. % stress only sees breathing; legs and glycogen — it doesn’t.

Key conclusions for the future:

  1. Lactate is the cleanest signal of the block. It dropped monotonically from 2.10 → 1.15 mmol (−45%) while VE rose from 96 → 110 (+15%). Less lactate at higher intensity is direct proof of improved aerobic economy at VT1. The most reliable channel for tracking progress in future blocks.

  2. Work volume more than doubled (TTE 40’ → 88’, +120%) without worsening the metabolic response — the ability to digest double the volume in the same zone.

  3. BR DRIFT (not BR avg) is the key stress signal — it’s the basis of the stress dose. Clarification: absolute average BR per session is not very informative on its own, but the DRIFT from Int1 to the following ones remains the main indicator. HR avg and DFA a1 avg as standalone averages don’t carry useful information for tracking block progress.

  4. Separately: an abnormally suppressed heart rate response to rising load (not low HR itself, but the warm-up → Int1 jump being blunted, like on 27.08: +5 bpm instead of the usual +30–35) — a possible sign of CNS/autonomic suppression, worth checking in future anomalies.

  5. Two anomalies were uncovered only by cross-checking SEVERAL channels at once — 13.08 (substrate depletion, lactate↓ with VE↑ and early threshold) and 27.08 (probable peripheral fatigue — speed/VE dropped with fresh BR/HR/lactate/a1). No single channel alone would have caught this.

4 Likes

Another great post.

I am still in early stages so need to get more insights within the next weeks. Hope I will be able to monitor things like BR drift and so on when live monitoring with my garmin devices. Can you use the TW fields on your device in other screens? Or only the TW screen from connect IQ? Because you say you use some VE and BR per laps.

What I will do within next weeks is some lactate confirmation around VT1 run and bike values compared to VE ranges…

If I have one current remark that is for me uncertain. How do you know the readings from the strap are mostly the same every workout? I try to fit the strap always the same but it’s not easy to do this I guess and will readings differ much with slight different strap position?

I don’t know about other devices. I have the F8 watch and Edge 1050 — they have VE 15s, BR lap / VT lap, and that’s enough for me. But in Connect IQ settings you can select time in zone, % of time, etc.

You need to understand that BR depends on intensity, and in high-intensity workouts the leading indicator is specifically VT. Don’t try to dose it perfectly during the workout itself — these are just your reference points (like a beacon), not a constant. There’s also your overall well-being, your RPE. But afterwards you can analyze and ask yourself what was different, why your metrics changed. That gives you a reference for what needs adjusting.

I don’t see the point in trying to equate lactate threshold values with VE threshold values. They can be close and they can differ. Lactate itself is subject to variation — the absolute value depends heavily on two factors: dehydration and available glycogen.

What matters more is something else — lactate dynamics at a fixed intensity. If lactate is trending down, that’s clearly a signal of growing metabolic efficiency.

My strap is always at the same buckle position. Yes, readings can change, but it’s not really significant changes. Yes, when you change position on the bike — lower grip — in the moment you see VE change, but after 15–30s it stabilizes.

I’ll say more: in skiing there’s a very significant difference between skate and classic (double poling) — I just accept that as a fact and account for the fact that when switching from skate to classic I may see changes.

1 Like

How important is warm-up? Did a run and average VE was above 110+ for An easy rpe run. And VE for VT1 according my test was 106. I hope this is not strap position or accuracy issue. Because this way it Will be difficult to monitor real time.

My run Yesterday was within boundaries. But Yesterday’s run and threshold run was with TW app and today first time with garmin forerunner.

This is a great post. Realizing how much I can look at the data differently. Thanks Timur

1 Like

In the context of ventilation metrics, or in general?

If in the context of ventilation metrics — usually it takes 10–20 minutes for breathing (which I read as metabolism) to stabilize. It’s just that ventilation shows this more acutely. But heart rate can also have deviations until the body stabilizes.

For long easy runs I don’t use any warm-up protocols, I just run/ride steadily, and I consider that the first 10–20 minutes won’t be my baseline.

It’s a different matter for key sessions — there, the higher the intensity, the more intense the warm-up. For VO2max blocks my warm-up takes 30–35 minutes and it’s fairly intense, so that lactate is between 2 and 3 mmol at the end of the warm-up, which includes threshold intensity and 2–3x15s sprints.

1 Like

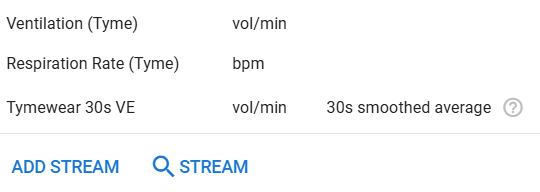
Now I’m trying to find the Tymewear data to add to the interval columns. Has anyone made a tutorial on the datastream addition?

yes a great post showing how to increase load using VE rather than the traditional HR or power. Looking forward to trying this once I’ve moved and discover where I put my TW strap

I don’t know, but the data is available
Columns-Field-Avg VE
And in general, the Intervals platform is phenomenal in its ability to customize the visualization of data and workouts. Everything I need, I can set up through the “JavaScript code to calculate the field value” field.

1 Like

Yesterday’s run was not that good for my concern about the accuracy.

Here some intervals of monday’s run, captured with TW app. VT1 VE is around 106, so stayed wel below around 90-96. Hr also more or less inline in what I would expect. Don’t look at the Pace because with my TW app speed is total wrong.

Yesterday I did a new run, also just a normal endurance run, on feel. This time captured with my forerunner 255. VE was a lot higher for same RPE, and even lower HR. Stopped several times to adjust the strap position (not included in below’s intervals) but not that much luck. So no idea how to interprete yesterday’s run. 5:40/5:45 pace is normally an easy run for me so I would expect VE be even lower then the monday run.

Hopefully I get better info next run…

I added these streams:

I don’t have an answer either — there could be many explanations here.

In the first workout, BR 34–35 and VT 280–275, whereas in the second workout BR 37–38 and VT 329–330, which obviously increases the VE in the second workout.

The first thing that comes to mind — that second workout was more intense. The second assumption — it was done in different conditions (treadmill vs outdoors). The third — ordinary fatigue, if it was the second workout of the day. I’ve had plenty of examples where a second workout on the same day (or a second one in the morning) significantly raised my VE at comparable intensity.

Ideally, you should test threshold values in the same conditions in which you plan to train. For running I try to do the test at a stadium. For cycling, of course it’s more convenient on the trainer, and I can see some difference in BR readings (which can affect VE) between the trainer and outdoors. We discussed this with Arnar — there are objective reasons for it.

But it doesn’t have a significant impact. In any case, I compare workouts that are identical to each other.

In your case, more practice is needed.

I’ll say one thing: if the testing was done correctly (no matter where — treadmill or running track) and you got reliable data on the ventilation breakpoints, you may be very surprised at how much your pace can vary depending on your state, and in most cases it’s much lower than you’re used to estimating. What seemed easy to you becomes very, very easy. It’s counterintuitive. But it’s what grounds you in reality — easy workouts should be truly easy.

And if you did the test well (even though I had questions about it), then your biggest potential is precisely in the aerobic base. Endurance and VT1. Which means that before this you were training more intensely than made sense, and simply took that as “easy” load.

Let me add an example here:

Overall, everything falls within my expected ranges.
Running, intervals close to VT1, lactate after each interval.
My VT1 values after the test: VE 143, Pace 4:37, HR 156.
And here’s my outdoor run:

1 hour of work
VE 140 (±0.8)
Pace 4:54
HR 150
Stress signal 10.6% BR, which is enough for an easy workout
Lactate in zone 2 (not above LT1)
RPE 4

1 Like

Could be true. It was outdoor on a track, so, conditions more or less stable. But threadmill would be better off course. But doing a test with a smarthpone in your hand to use the TW app is not that ideal I guess. And the speed readings were way off with the app. Also you have to dial in your speed every 2minutes so during that 2 minutes I had to look at my garmin watch 2-3 times to check the interval speed. Maybe that is also not ideal for getting the best possible readings.

But ok, most important is that I did a run yesterday ;-). So next run I can have another look at what the metrics give me during the exercise.

)))
A treadmill can be worse. The thing is, treadmills in fitness centers aren’t calibrated. They can give a completely different speed from the values shown on the monitor. I’ve tested this.

You can record the test on a Garmin watch, using a pace protocol every 2 minutes, do it outdoors or at a stadium, just mark it in the dashboard as a test. You’ll get the same report. You don’t need to carry your phone with you.

For the treadmill I use a Stryd sensor, which shows real pace very accurately, plus power.

In general, I test myself, and then use that data in my training without going to TW, for example for skiing. Or if I need to check my values at sub-intensity without driving myself to failure.

1 Like