Hemodynamically stable (plasma volume, thermal stress, venous return, and catecholamines without major alterations)? Isn’t that good to know?
That confirms what i said:
CO2 main ventilation driver always coupled with RPE CNS pathways, so intensity (RPE) is sensed coupled with ventilation.
By the contrast, Heartrate is controlled by another CNS region and is more dependant of hemodynamic factors (plasma volume, thermal stress, venous return, and catecholamines without major alterations) Sorry for the previous long AI assisted text
Interesting that the endurance zone defined by TW as VE 29 with power at 130w — in a workout with VE 29 your power was 165w. For me the picture is usually the opposite.
And what was the goal of the workout? Over 2.5 hours I don’t see stress. BR +7.4%.
I still don’t get the mobilization index metric.
On easy workouts, BR alone is enough as an indicator of accumulated fatigue, but in intervals — and if they’re intense, FTP or above — you need to assess TV, because BR rises on its own from intensity.
My theory is that either the workout is developmental — then it should create added value, a dose of stress. Or it’s just spinning the legs, clearing metabolites — but for that 30–50 minutes would be enough. Probably if I rode at VE 29 for 4–6 hours with easy climbs or VT1 sections, I’d accumulate the needed dose of stress.
Yes, probably. But what does that give you for understanding load? For many years I trained by heart rate, “bobbing around like a cork in an ice hole.” When lactate appeared and I burned through hundreds of strips to learn to control intensity, that gave huge progress and taught me to better understand RPE.
But a big question remained — if you ride long, how long? When should you stop? 2 hours, or 4, or 6? What will be the marker of “fatigue” when it’s enough but not too much?
Heart rate and even lactate don’t answer that, but the combination of VE/BR/TV (taking pace/power into account) — I think I’ve found my holy grail.
For me this is much more inline of what I would normally expect. A normal easy endurance ride would be around 160-165W. 130w would be a recovery ride. So maybe in my next treshold test, maybe better performed on initial stages, don’t know, it would reflect more towards let’s say 160w, instead of 130w.
What do you mean by this? It was just a planned Z2/endurance ride. Building endurance. Do you think this ride was not long enough to get some adaptations? Should I went towards 32-34 VE (like TW had proposed in the workout)?
@Timur and @miguell Basiclly you are saying the same thing by other words. Timur emphasizing empiric personal knowledge, miguell emphasizing CNS physiology . Thank you both.
@pepe Exactly right.
My point is not to go off into cause-and-effect theory. I’m looking for a concrete answer. “How much to weigh in grams?”
Lactate is a reliable and proven marker of intensity, but it doesn’t answer the question “How long can I sustain this intensity?”
Heart rate is murky water — it seems to reflect intensity, it seems to reflect durability, but there are no flags, no thresholds I can cross to get a signal — enough.
And it’s precisely in long workouts that the CNS signal — which is probably what @miguell means via the BR/TV flag — says: time to stop, that’s enough.
But I’m convinced that any workout should have a measurable goal. To create enough stress that the body adapts to it and becomes stronger/more enduring. If you just ride around for no reason, there won’t be a result.
Otherwise, delivery couriers on bikes would become Olympic champions.
Any activity is useful, but not every activity makes us stronger. I’m not against a free ride for good well-being and mood. But if I’ve decided to spend 2.5 hours of my time, I’d want a tangible improvement — and improvement in every workout.
If there’s not enough stress — there won’t be progress. If there’s too much stress — there won’t be progress either (or it’ll even get worse).
When I head out for a workout, I always try to answer the question — what’s the goal? If it’s just a coffee ride with friends, fine. Or just a walk in nature, also fine. But if it’s a workout for developing endurance, then I try to pick the intensity/duration that creates the stress that will make me stronger. The main thing here is not to mess up, because too much is even worse than too little.
Thanks, @Pepe, I’ll listen with pleasure.
I tried using double threshold back when it wasn’t hyped yet, and for me it turned out to be too hard. Age does matter, after all. It’s good if I can digest 2 key workouts a week. Moreover, right now I’ve forced myself to take two full rest days a week, and I feel much better.
Exactly right. For running (as well as for skiing), ventilation values differ significantly from cycling.
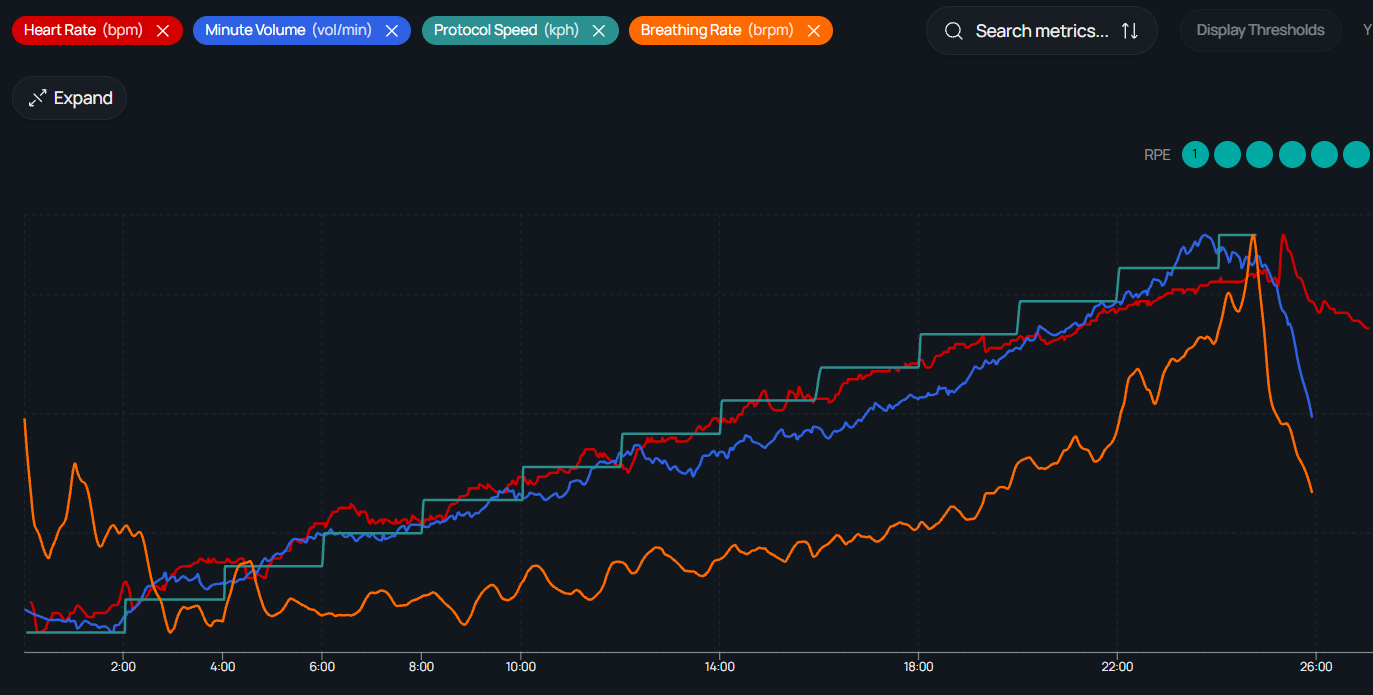
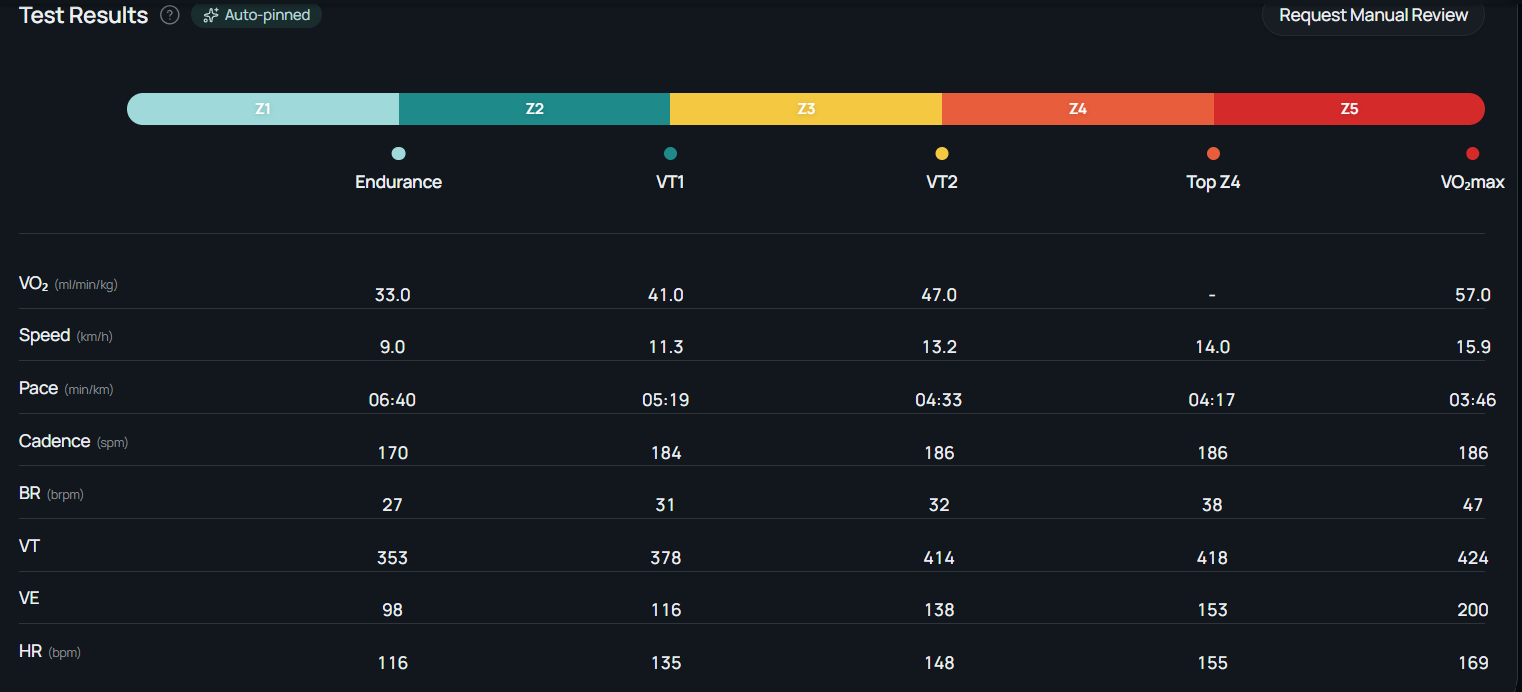
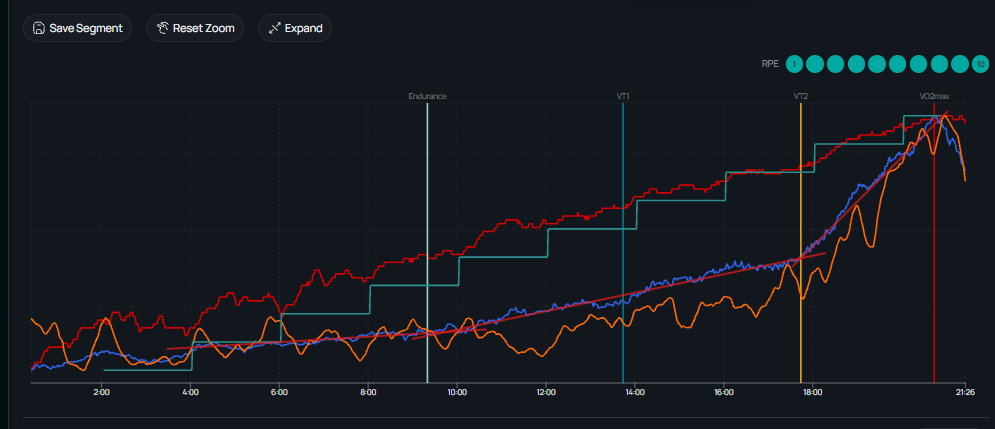
Question — the warm-up isn’t visible in the test, was it done before the test started? And also, ventilation starts rising right away. Ideally you’d have 2–3 steps where ventilation doesn’t rise. At least like in the cycling graph example, but even flatter. Then threshold detection would be more reliable.
Did a 10min warm-up before (not visible in graph). But first starting at 5km/h and 6, 7, …very hard to pace. So maybe some movement in body that interferes with good data? I followed the step protocol so don’t know why VE rises from start.
First 10min were some spikes in the beginning so that was higher VE but for the rest it stayed more or less stable. Power around 190W. VE still a good part under VT1 VE of 36. Will do a lactate compare this week around 190-200W to see what power does around VE values between 32-36.
BR is rising more towards end of ride, sign that stress is also rising?
Two remarks for tymewear use. Heart rate is lower with this strap than compared to other devices (whoop, forerunner). And also another remark, and a bit important. I rode this ride mostly in the hoods indoor. When I go with handsposition on the bars, so more upright, VE rises about 2-3 ticks. So does this mean you should always stay in same position during a ride?
Well, if there was a warm-up and the steps started at 5 km/h (which is really slow and not easy to maintain) — then it’s fine. Probably an individual quirk. Future tests can be compared. What matters is keeping test conditions as identical as possible, and of course starting 2–3 steps below the presumed aerobic threshold (VT1), both for cycling and running.
My subjective observation, based only on my own perception of load: a BR increase above 10–12% (as well as a VT drop of 12–15%) creates stress. The question is how long you stay “under stress.” Again, my subjective opinion — 10–20% of the time. Logically, on a long easy 3–4 hour workout that could be 30 minutes, whereas on high-intensity intervals it’s a matter of minutes.
You need to assess both BR (which directly depends on VE) and VT. Ideally, hold your target VE (whatever it is depending on the workout goal). Because if power rises, BR rises too. Here VT is the leading indicator.
In your case, VE and power both changed. To assess, you need to take one of the metrics as an anchor, and it shouldn’t change — then everything else is relative to it.
I take VE as the anchor. That’s why on control intervals I try to hold exact VE values — adjusting power as needed. When VE is stable and power is stable, then the BR/VT drift will tell you when stress (CNS) is being created.
But if you approximate the VE change to power, you can see very clearly that intervals 1–5 all had stable values (BR 6-7% and VT 11-15%), and the collapse happened on interval 6, when BR jumped to 36.8 (+15%) and VT crashed to 84 (-24%) - almost twice as much.
Total: 50 minutes of work and 6 minutes under stress = 11% stress dose. To me that’s a good workout overall. Whether to add time under stress or not is up to you. If this is work at the first threshold, I think you can increase the time to 10–15 minutes. But here it’s better to be more careful.
I think it’s a good workout.
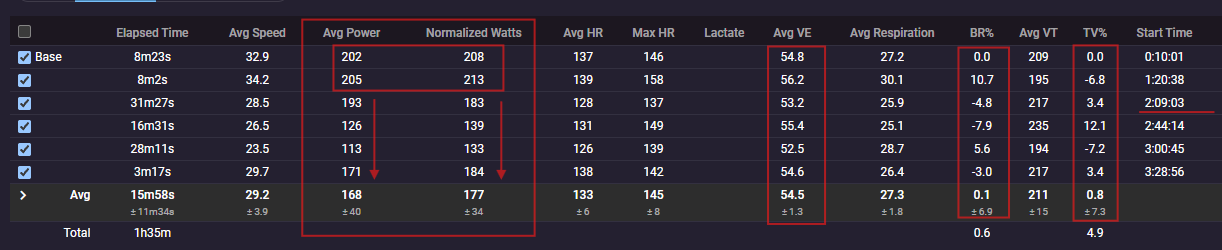
All intervals are identical in ventilation: VE 54.5 ±1.3.
I have no significant fatigue accumulation — BR 27.3 ±6.9% and VT 217 ±7.3%.
My power holds steady at NP 208–213w for the first 2 hours, but starting at 2:09:03 my power starts dropping to NP 133w at 3:00:45, though at the finish I manage to bring power back up to 184w.
Question for the experts — What single significant change happened in this ride? compared to the previous ones (in the message above), and why did power rise to 184 at the end even though all intervals had identical ventilation (effectively the same RPE intensity)?