Any triathletes here who uses the device? What is best approach for combining run and cycling? You do 2 seperate tests? But the recommended training hours? You can not just add them together I suppose?
And what about cycling test on TT vs road bike? Because TT bike is different position so you would receive different results?
I’m not a triathlete, but I run, ride, and swim.
Definitely, testing for running and for cycling differs and should be done separately.
Personally, I don’t use TW’s training volume recommendations. Though it roughly works out that way for me - about 8-9 hours total. (recommendation: running 11, cycling 10)
As for TT vs road bike - they probably can differ, and specifically at the moment of changing position. I see this on my road bike: when I change position, the readings shift but recover within 15-30 seconds. That’s better checked or confirmed with triathletes.
First
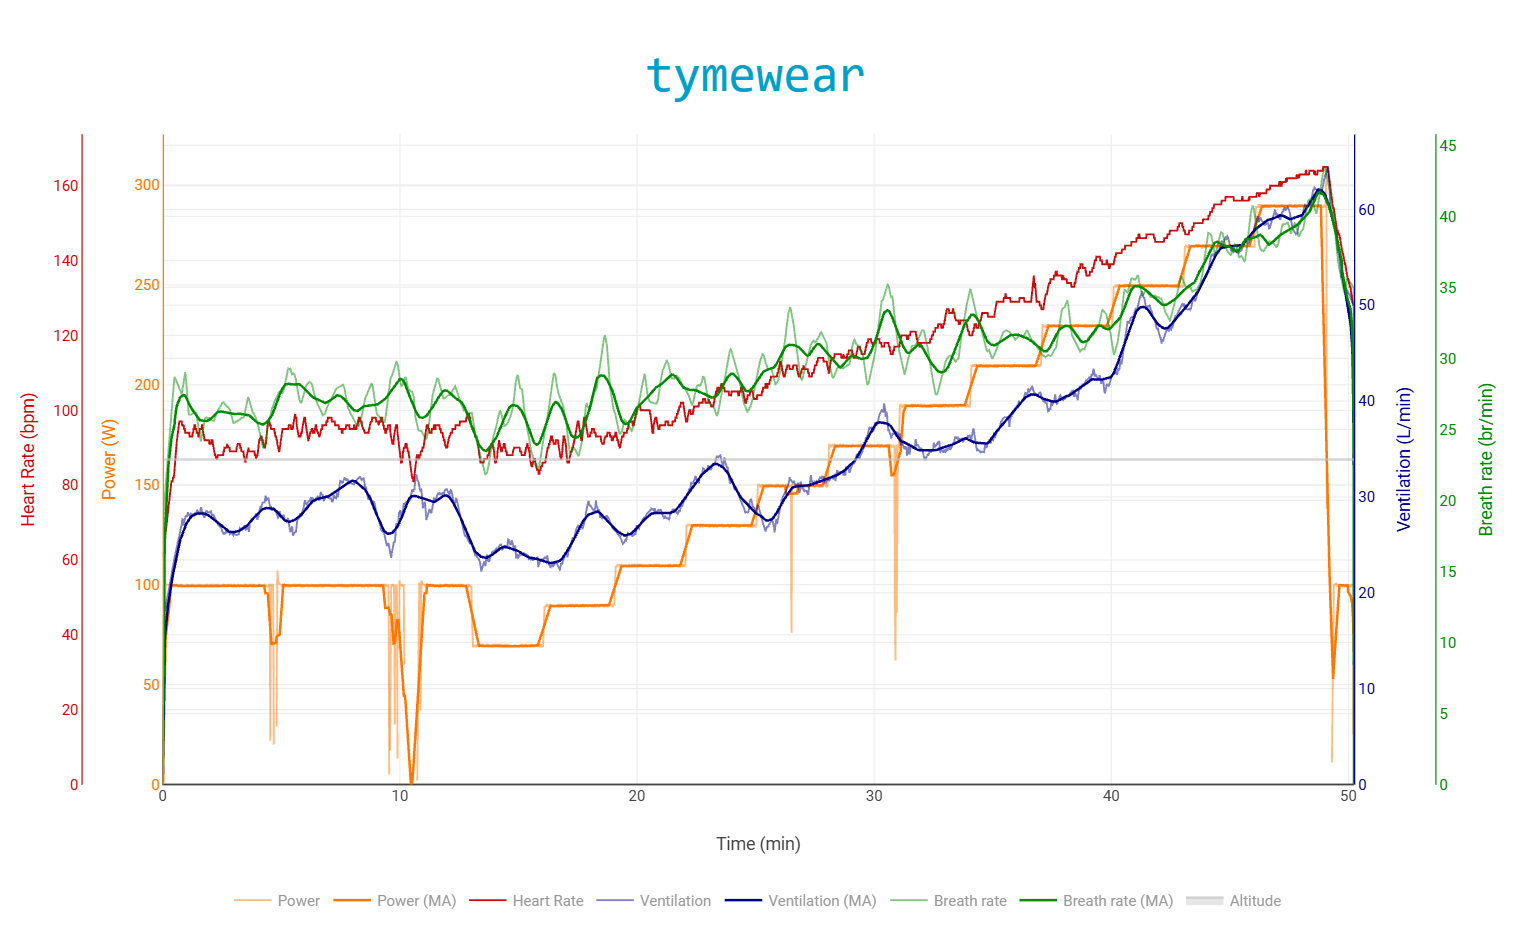
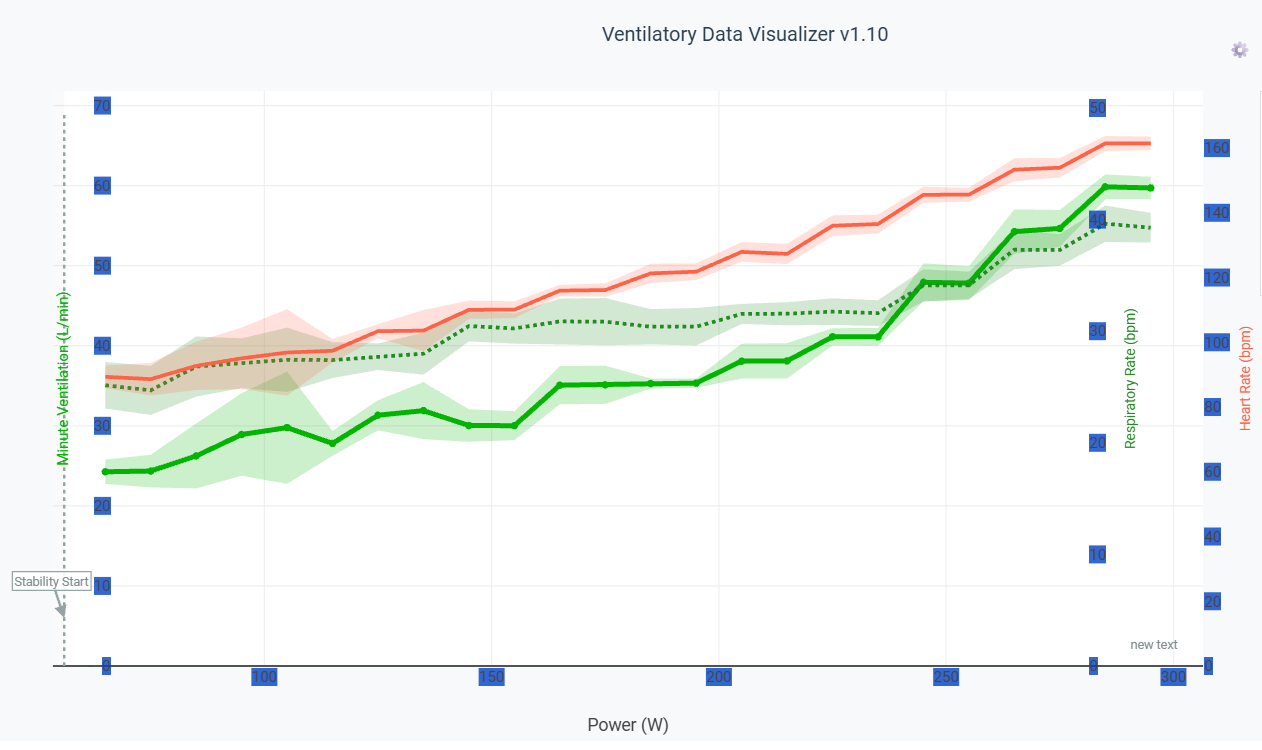
First test done. Too bad have to wait untill Monday for results from Tymewear ;-). Do not know how good the test went. Heart was no issue but could only finish the 290w stage, legs did not have power for more. But that was at HR little over 162? My max is maybe 170-175.
Maybe someone some insights in my curve?
VT1 180-190w, VT2 230-240w?
Yeah, could be. Based on lactate tests (not recent) I would expect VT1 little higher but maybe VT1 is not exact the same as LT1 lactate point.
This is what AI told me:
What is particularly interesting is that between 190 and 210 W, ventilation starts to rise clearly again, mainly because you start breathing more deeply. Around 210–230 W, your breathing rate remains remarkably stable at roughly 31–32 breaths/min. That fits reasonably well with the region of a first ventilatory transition.
Then something different happens. From approximately 240–250 W onward, not only does tidal volume increase, but your breathing frequency starts to rise consistently: 31.8 → 34.1 → 38.0 → 40.3 breaths/min. That makes ~245–255 W an interesting candidate for VT2.
For now I would use:
VT1: ~200–210 W / ~125–132 bpm / ~80–84% FTP
VT2: ~245–255 W / ~143–150 bpm / ~98–102% FTP
A VT1 around 80% of FTP is relatively high, but certainly possible. I would therefore regard 190–210 W as an uncertainty region, rather than claiming something like “VT1 = 207 W.”
Your comment about your legs and ERG mode also fits the data: 290 W was probably not a true maximal cardiopulmonary effort. You finished at around 163 bpm while you normally say you can exceed 170 bpm. This makes the end of the test less suitable for estimating things such as HRmax or VO₂max.
I prefer a conservative approach, identifying threshold bounds at the final data step prior to the inflection point.(last non-rising point)
VT2 is usually diagnosed fairly accurately in most tests, and the 240–250 watt estimate looks quite realistic. As the maximum value on a 3-minute step
As for VT1, I’d be more conservative. Definitely not 200 watts — say 180–190, and for myself I’d consider the Fatmax zone, based on this test, to be at 150–160 watts.
But the power number doesn’t really matter at all — what matters more is the threshold VE value.
If in the test at 200 watts your VE is 45, then I’d bet that in real rides and training your power at that ventilation will be significantly lower — and that’s the whole value of ventilation.
It doesn’t matter what power you put out — it depends heavily on your state at a given moment, on the distance, terrain, and probably a bunch of other conditions. But VE very accurately reflects your intensity in the moment. Whereas BR/TV tells you about your durability at a fixed VE.
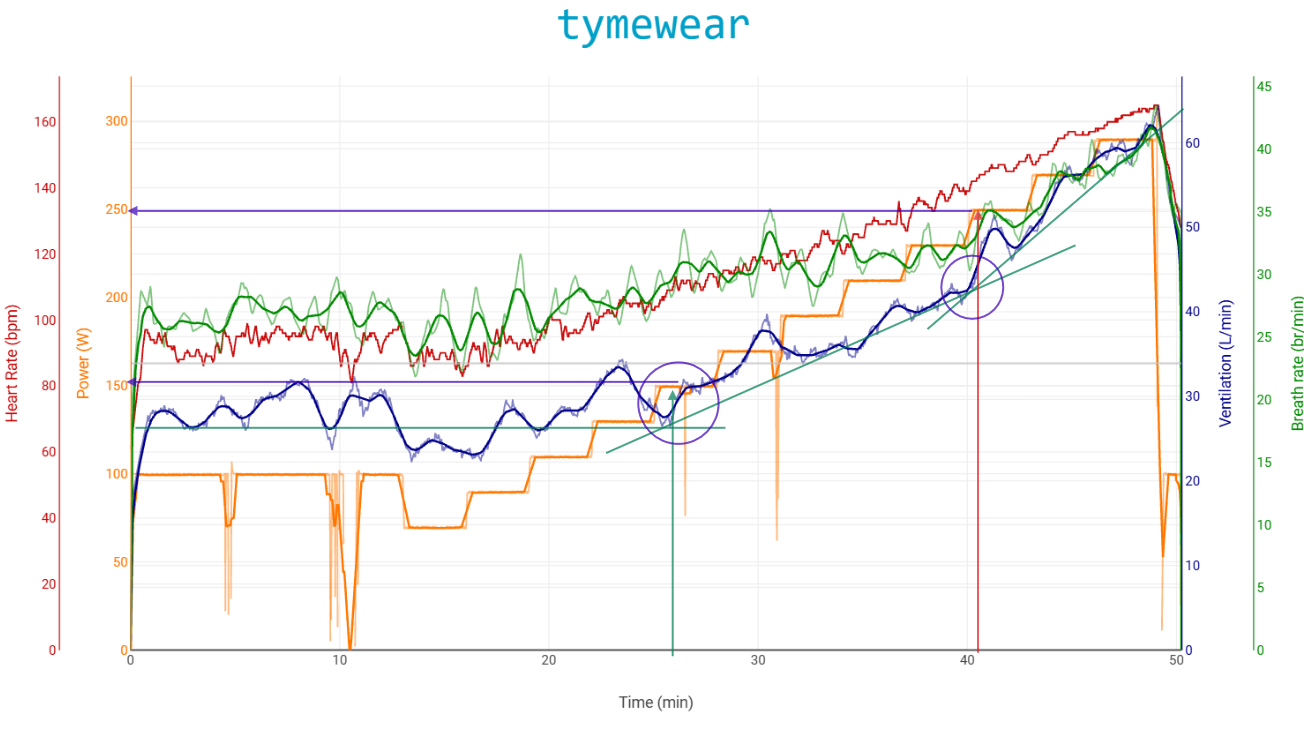
Ok. Cool. Thx for this response. Will wait the results from Tymewear and see what they propose.
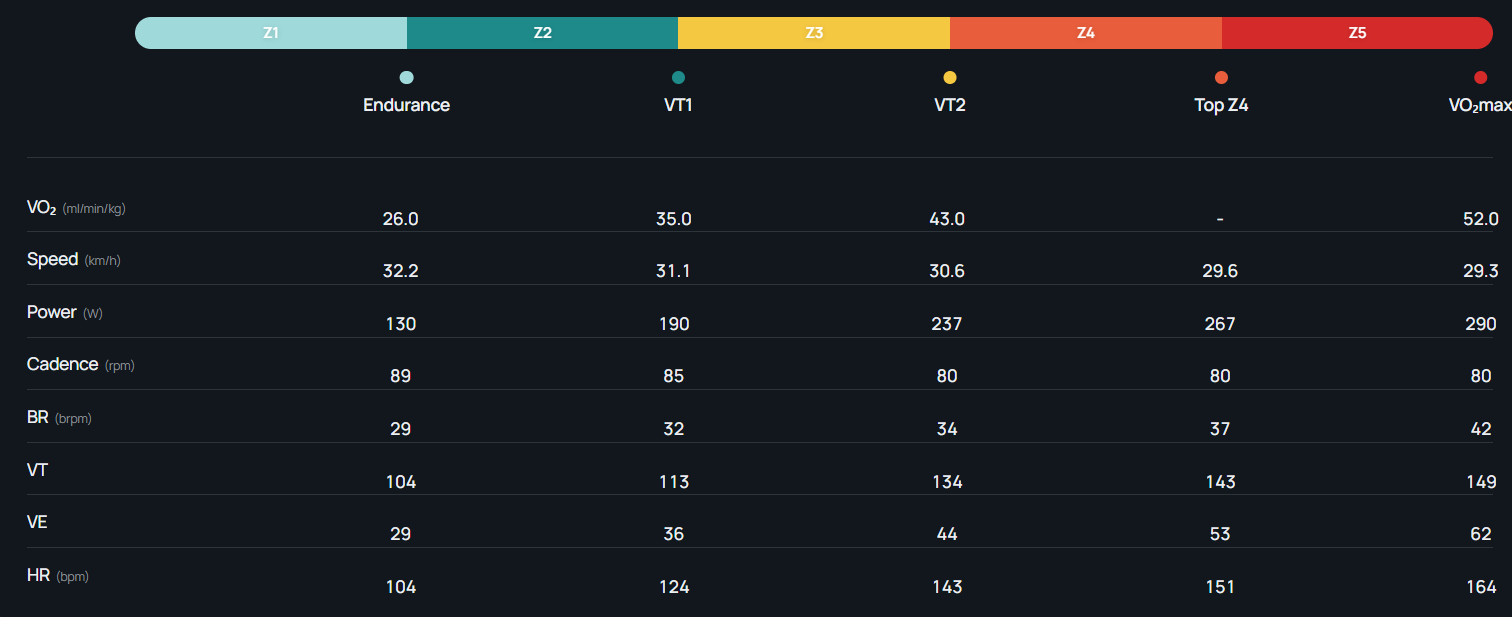
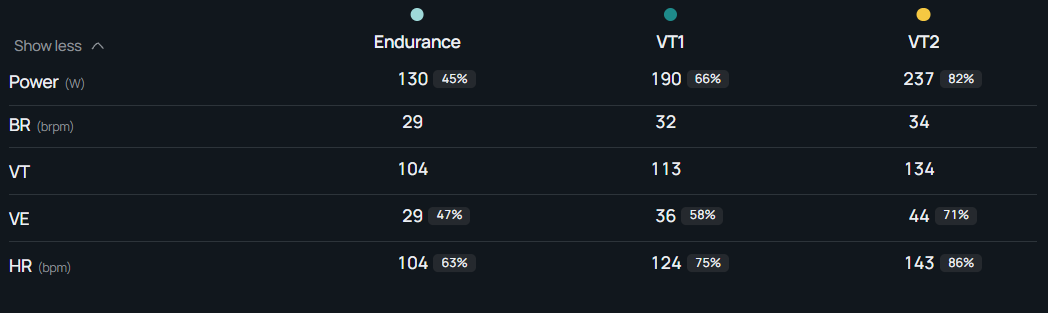
Ok, results already received. Tomorrow look a bit closer at proposed zones. Because endurance at 104bpm, that is recovery ride I am afraid ;-). And VT2 237W vs top of Z4 = 267W. Don’t know yey how to interpretate this value. Because I always had in mind that VT2 was top of Z4. But ok, maybe do some more readings and gain some extra insights…I can confirm VT1 with my lactate meter more or less…
Gemini Chart analysis.
Comparing the Charts: Tymewear Continuous vs. Ventilatory Data Visualizer v1.10
While both charts represent the exact same test session, they present the physiological data through two completely different analytical lenses:
-
Tymewear Chart: Continuous time-series plot (0 to 50 min) showing real-time trends, raw signal noise, and protocol execution.
-
Ventilatory Data Visualizer v1.10: Stage-binned plot (100 to 300 W) aggregating data per power step to isolate true steady-state physiological responses.
Key Findings & Feature Comparison
| Feature / Metric | Tymewear Chart (Raw Time-Series) | Ventilatory Visualizer (Power-Binned) |
|---|---|---|
| Primary X-Axis | Time in minutes (0 to 50 min) | Power in Watts (100 to 300 W) |
| Data Format | Real-time continuous lines with moving average smoothing | Mean values per power step with shaded variance/confidence bands |
| Protocol Noise | High: Shows exact test glitches (e.g., ERG dropouts at min 9–11 and 31) | Low: Filters out transient dropouts to expose true underlying trends |
| VT1 / LT1 Identification | Visible around ~20–25 min as power hits ~190–210 W and blue ventilation line starts drifting upward | Pinpointed cleanly at 190 W (last stable step before total ventilation departs while breathing rate stays flat) |
| VT2 / LT2 Identification | Visible past ~40 min as breathing rate and ventilation accelerate together toward maximum effort | Pinpointed at 235–240 W (pre-rise step) where respiratory rate breaks upward from its 32 br/min plateau |
| Terminal Effort / Limiter | Peak at ~49 min with HR ~163 bpm and Power ~290 W before abrupt drop | Displays steady stage progression up to 290 W with HR ceiling at 163 bpm |
Key Takeaways
-
Protocol Execution (Tymewear Chart):
-
Excellent for viewing cardiopulmonary lag (how long HR and breathing take to catch up after a step increase).
-
Highlights real-world testing artifacts, such as the power dropouts around minutes 10 and 31.
-
-
Threshold Precision (Visualizer Chart):
-
By averaging data strictly against power stages and plotting confidence bands, it strips away noise.
-
Proves that Respiratory Rate remained remarkably locked at 31–32 br/min from 165 W all the way to 235 W, making 190 W for VT1 and 235–240 W for VT2 the most reliable pre-inflection training targets.
-
It doesn’t really matter at all what heart rate and power values the test shows.
All you need is the VE values. They’re what reflect your true intensity. Heart rate and power are highly variable.
I’d go further and say I’m increasingly convinced that decoupling has nothing to do with real load at all — only with your level of dehydration during the ride. And moreover, in cold weather with adequate hydration, heart rate drops during a long race.
Ventilation (VE — intensity) is close to lactate. But lactate doesn’t signal accumulated fatigue in any way, unlike breathing rate and tidal volume. Power is an exceptionally precise marker — but it’s external, and your output power depends on your state.
So all you need to know from the test is the threshold VE values, and TW’s automatic detection is far from perfect, but very close to reality.
Thx. Tomorrow a 2hr endurance ride planned so good to start with live metrics check. Best practice is to use the Garmin IQ field with VE 30s MA active I guess? Or are there other options available? I will do it indoors..
The Neurophysiology of Intensity: Why Tymewear’s VE & Rf Mirror RPE (and Why Power & HR Still Matter)
Focusing on Ventilation (VE) and Respiratory Frequency (Rf) via the Tymewear sensor gets you as close as possible to real-time metabolic effort. Incorporating the chemical drivers behind breathing makes the link between Tymewear’s ventilatory metrics, central brainstem control, and Perceived Exertion (RPE) undeniable.
The core reason Tymewear’s VE and Rf mirror subjective exercise intensity so closely comes down to a dual-driver feedback loop anchored in the brainstem:
CO2 as the Chemical Inducer:
As muscle contraction increases, bicarbonate buffers rising metabolic acid, generating a surge of CO2.
This elevated arterial CO2 crosses the blood-brain barrier, directly activating central chemoreceptors in the medulla oblongata. CO2 is the primary chemical stimulant driving the brainstem to increase total ventilation (VE).
The Shared Neural Center (Central Command & RPE):
Simultaneously, when the motor cortex sends signals to the muscles, it sends a parallel signal (efference copy) directly to those same brainstem respiratory centers.
Crucially, this central motor pathway is the primary generator of Rating of Perceived Exertion (RPE). The brain’s central processing center for perceived effort, respiratory drive, and CO2 chemoreception are fundamentally tied together in the brainstem. That is why the physical sensation of heavy breathing or hyperventilation (sharp rise in Rf) is virtually identical to your conscious feeling of hard effort.
Why Cardiac Control Operates Differently:
The cardiac control center in the medulla operates through a distinct autonomic feedback network. While influenced by Central Command, it is heavily regulated by peripheral hemodynamic demands—plasma volume, thermal stress, venous return, and circulating catecholamines (adrenaline).
Tymewear + Power & HR: The Complete Baseline Snapshot
While Tymewear’s VE and Rf excel at pinpointing acute metabolic transition points (VT1 as VE departs while Rf stays flat; VT2 as Rf breaks sharply upward), Power and Heart Rate are still essential to make the test a complete, valid snapshot:
Power (The External Reference):~~ Knowing that your Tymewear VT1 occurs at 190 W or VT2 at 240 W gives you an objective benchmark. It translates internal ventilatory thresholds into actionable targets for smart trainers, pacing outdoor efforts,~~ and tracking fitness adaptations over time (e.g., watching power at VT1 increase over a training block).
Heart Rate (The Autonomic Reference):~~ Establishing your~~ HR at the exact power steps where Tymewear detects VT1 and VT2 provides a vital baseline. It allows you to monitor how your cardiovascular system reacts relative to your ventilatory thresholds under different real-world conditions (heat, fatigue, altitude, or illness).
Decoupling & Accumulated Fatigue
Regarding decoupling and dehydration: while fluid loss accelerates cardiac drift, decoupling isn’t only dehydration. As slow-twitch fibers fatigue during a long ride, the brain must recruit additional, less efficient motor units to maintain power output. This increases Central Command—raising both CO2 production, ventilation, and RPE—even if hydration is perfectly maintained. Furthermore, an HR drop during cold-weather events can indicate autonomic fatigue or sympathetic downregulation rather than a lower real load.
Bottom line~~:~~ CO2 is the direct chemical inducer of ventilation, and because the brainstem processes CO2 levels, respiratory drive, and perceived exertion through the same central pathways~~,~~ Tymewear’s VE and Rf are phenomenal markers for real-time intensity. However, pairing Tymewear’s ventilatory data with Power and Heart Rate during a ramp test delivers the ultimate snapshot—combining precise internal metabolic boundaries with practical external training benchmarks.
On the bike computer screen I only have three values: VE, MA 15s, and VE LAP — BR LAP.
MA 15s controls intensity in the moment. VE lap is how I regulate intensity over a segment, and BR LAP shows fatigue drift.
Usually a long ride looks like this. After a warm-up, easy, about 15–20 minutes, I do an interval lasting 5–7 minutes exactly at VE = VT1. I remember the power and BR values on that interval.
Then I can ride easy (but not above VT1) for about 30–60 minutes, after which I repeat exactly the first interval — at exactly the same VE LAP. And I assess how power and BR changed.
If power drops — that means available glycogen is decreasing.
If BR rises more than 10–12% — I end the workout.
Usually over 3–4 hours I do 3–5 of these control intervals. The duration of the whole ride depends on how I feel today and the overall intensity. And this is the best find for controlling long intervals.
If we’re talking indoors — it’s even simpler. My goal is exclusively VE, and I dose power depending on the VE reading. Duration depends on how much my BR rises relative to freshness (the first 20–30 minutes of riding). When BR rises above 10%, I end the workout. For example, my VE is 53, BR at the start of the workout is 26 — as soon as I see it steadily reach 29–30, that means I’ve accumulated stress. On the trainer with precise power, usually 2–2.5 hours is enough for me. But how long it takes to reach that stress depends on the VE intensity.
Yes, that’s all theoretical AI fantasizing 
I rely on my personal observations and assessments. Which for me is far more informative and important. Heart rate is so unstable and often counterproductive that it only gives a general idea of intensity and fatigue, and it depends on so many factors that have little to do with the amount of stress needed for adaptation. Of course I sometimes look at heart rate, and often it helps me — but here’s in what capacity:
If on a quality, developmental workout I do a warm-up (usually it’s intense, at least 30–35 minutes, goal is lactate above 2–2.5 mmol) — so, if during that warm-up my heart rate doesn’t reach my expectations, my CNS is probably suppressed, and my developmental intervals will be shorter and less effective. Simply put, low heart rate during warm-up is a bad sign. And vice versa, if heart rate is at the upper limit or even slightly above — that’s a great signal. But with one condition — you’re not sick and not dehydrated.
For indoor rides I have two screens available. One normal for zwit and another when I want to view some youtube, tv or other stuff.
Is there an option already somewhere available where you can track tymewear metrics on desktop? So like the garmin IQ fields but not on my Garmin headunit but just on my desktop monitor? Would be nice to have something available to track those metrics…
I don’t know.
I have a desktop for YouTube, a MacBook for MyWhoosh, and a Garmin computer for TW.
Let me share an example of how I control long rides. The example is a 4:40 ride. (avr NP Power 165w)

I did the first control pull 30 minutes after the start of the 1st interval.
- VE 55,
- BR 28.8
- TV 199
- Power 209, NP 224
These values are my baseline.
Then control pulls at 1:11h, 1:53h, 3:53h at 4:13h I caught a drop in BR/TV
- VE 53.5 (basically unchanged, -2.7%)
- BR 33 (+14.6%)
- TV 169 (-14.9%)
- Power 207, NP 217 (unchanged, I fueled well)
After that I rode home and finished at 4:40.
And this approach lets me dose duration based on intensity. I feel the load and fatigue, but I have no desire to turn to the wall and just stare at it. ))
PS
And what does heart rate tell you here? I find no relationship between the amount of stress (intensity and duration) and heart rate readings.
Ok. First ride done (indoors). TW gave me a ride with focus on VE between 32-34. Here my values from my treshold test yesterday.
I did 2h30 ride and monitored with the TW app to keep an eye on VE values. Did not focus on power or heart rate. Just tried an hold a certain feeling in the legs. Here the result for every 30min interval:
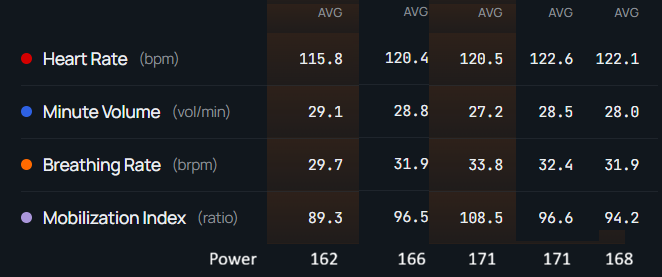
VE stayed stable around 28-29 so that was not super high compared to VT1 of 36VE. But breathing rate increased a little and went stable afterwards as also heart rate that was more or less stable. Power around 168-170w so also stable.
Ventilation seemed lower than yesterday in my test I think? But ok, it’s a start. A short Z2 ride I will focus on some intervals around VT1 to see what values it will present. Did not had a good day I think yesterday in my test so power values were lower than expected in my treshold test. VT1 190w, I think (based on past lactate values) it could be higher. But ok. Trust the process, and overal a good Z2 endurance ride.