Yes, the same story I see.
I also notice that in the first 10–20 minutes, ventilation is higher than usual and then stabilizes. Maybe this is the warm-up effect?
2 Likes
Tymewear have published a webinar. It was useful, and I will rewatch it with pleasure.
5 Likes
Yes same with me. I think it’s because blwhen you start exercising it takes a while for your aerobic system to get going and so at the start you tend to be burning more carbs. I could be wrong though
2 Likes
i’ve noticed the same and have standardized my workouts with a 12-minute warmup that seems to equalize my HR/BR/VE.
2 Likes
I’m the same as well, I don’t look at Ve until a good 10-15 minutes in. Heart rate does something similar but in reverse - as in it is always a lot lower than I’d expect for the power output for the first 10 minutes. So I definitely need a warmup ![]()
2 Likes
I like what they’re working on. The colored layoff comparrison w/zones is a nice QOL. I imagine that is something that could be coded easily in Intervals?
1 Like
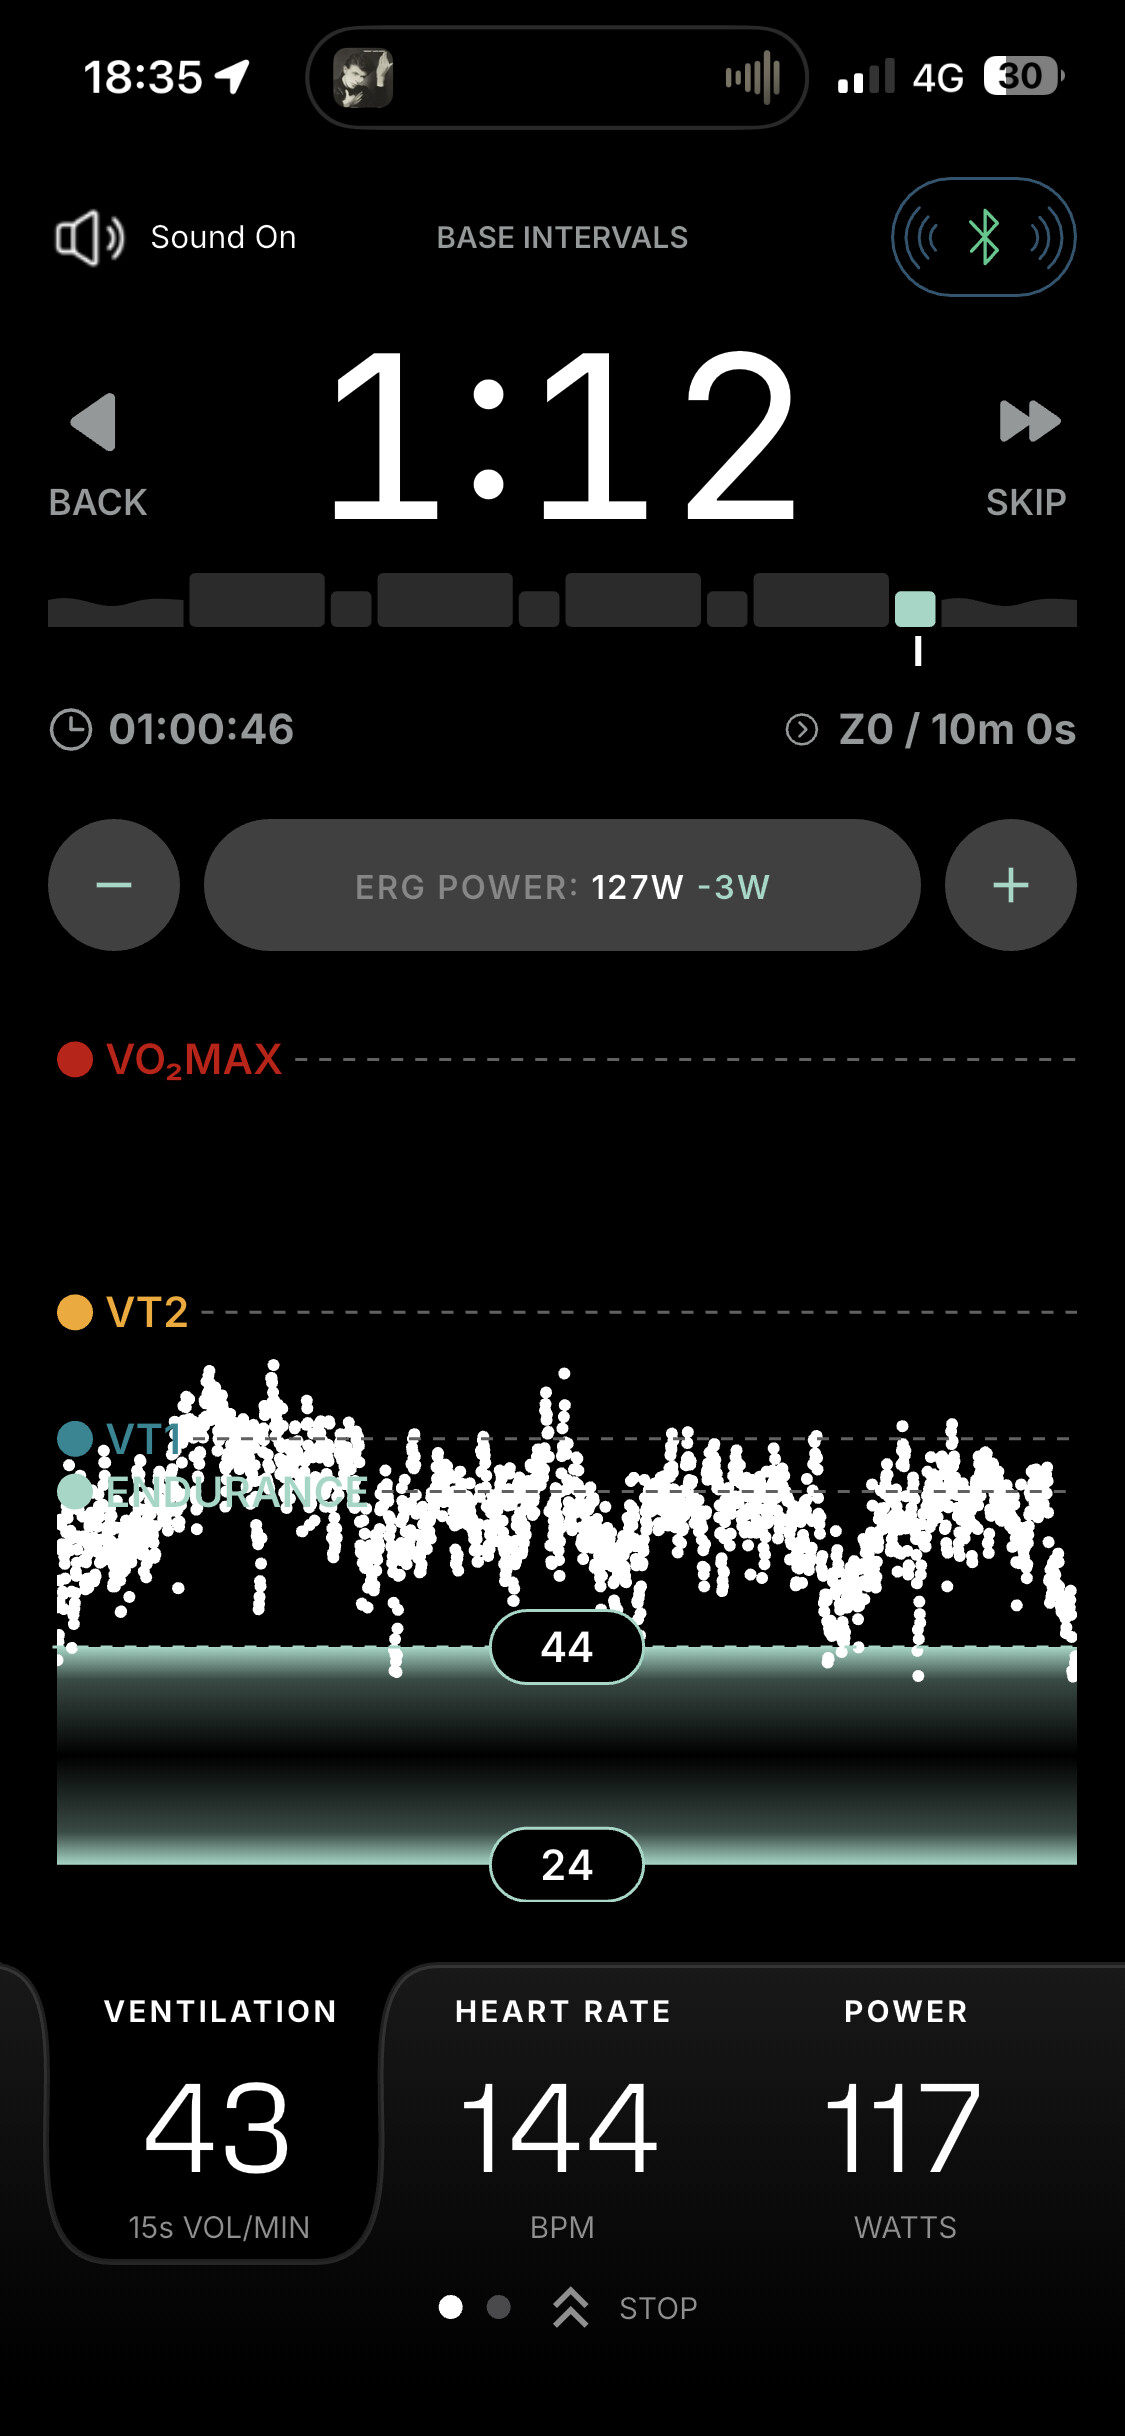
Anyone know what the 24 and 44 indicate in the screenshot I took after an hour on the trainer doing base endurance intervals?
Support at Tyme is super responsive — got this reply:
“For the erg mode - we highlight the actual range for VE intensity. For example, endurance is bottom of zone 2 and VT1 is top of zone 2. We calculate the range (based on your threshold tests) where you should best focus your intensity for the activity and these are marked with the could and actual VE numbers. These are related to the threshold values - but we set the expected range”.
2 Likes
Hi All - I created an app that uses statistical modeling to analyze the Vtialpro’s ventilation data to determine intensity. I designed it specifically for running, but it can be applied to any endurance activity, including cycling. In fact, the models used for the app mostly come from studies on cycling.
Here is a video that shows the features: https://youtu.be/g5ABbv1LJhE?si=dupXhfOW-ap9s_SY
The app is in beta and is free to try at http://vtcheck.com.
2 Likes
@Granola Will there be a Connect IQ app for Garmin Edge cycling computers?
We can look into it if there is interest. Any particular features you would be looking for?
Can anyone tell me where on the Tymewear app you can enter your own threshold levels. I know it used to be there but I can’t find it now?
Previously, there was an option in the mobile app settings (View Profile). They removed it later. I asked about it during a webinar, and they said they would bring it back
2 Likes
Glad this thread became alive again ![]() Thanks @Timur for analysis.
Thanks @Timur for analysis.
@Granola Ive been frustrated with Tymewear as my ventilation from tests were never in line with when I did normal workouts (trying to follow VT1 was such a narrow number it was impossible). I watched your video and it now makes a lot more sense that test data is maybe not the best way to set the actual tresholds, will try it out your tool!
cheers
I had the same issues which prompted me to make this app. Let me know if you have any questions or feedback. I plan to do a more in-depth video soon explaining all the features.
1 Like
The thing to understand is that Tymewear testing determines ventilation thresholds. Those are the anchor values for training — pace for running or power for cycling are just reference points. Obviously, a test with 2- or 3-minute stages can’t detect your actual pace or power over longer distances, whereas ventilation stays surprisingly stable (I’ve posted a few breakdowns of ski races at different distances/durations).
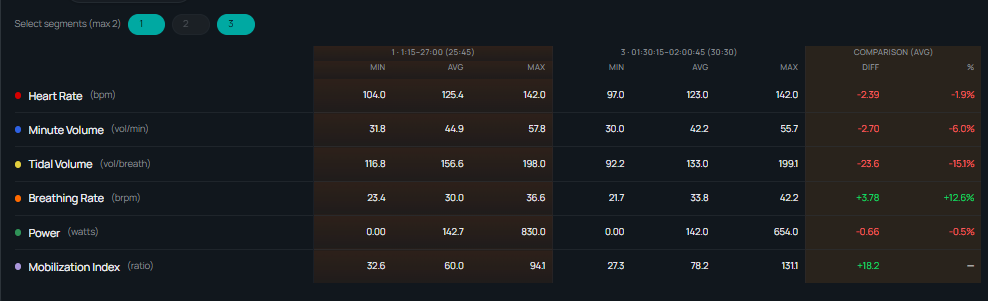
What still isn’t totally clear to me, though, is long workouts. When exactly do I consider myself crossing the “red line” at the same ventilation? My BR goes up, TV logically drops, but power and VE stay unchanged. Does a 5% increase in BR mean something different from a 15% one in terms of overall training stress?
Really like the idea of tracking that dynamic - @Granola looking forward to the detailed video. And to having the option for cycling workouts too.
After I produce the in-depth video, would love to hear feedback on how to improve the app for cycling, such as adding power instead of pace and possibly having testers for Garmin edge. I don’t cycle so know very little about this world.
Regarding crossing the “red line”, in the world of respiratory kinetics, the degree of slope of the phase III component (ie after the ~3m ramp up period) is directly correlated to the sustainability of a given pace because it tells you about both substrate utilization and waste accumulation. It doesn’t really tell you about muscular strain, but waste accumulation seems to be a decent proxy for that in most cases.
However most of the studies I’ve reviewed in this area focus either on VO2 or ventilation, so not sure how this would translate to analyzing breath rate or TV independently. That said, I do know there is other research that shows that increase breath rate is tied to RPE and non-metabolic stressors.
EDIT: If anyone is interested in learning more about respiratory kinetics, I would suggest viewing Mark Burnley’s YT channel as he is one of the leading experts in this area: https://youtu.be/q2-w9-tT95A?si=HOX7dGdulE4AZtpM
5 Likes
Same thing happened to me. Long workouts and VE stable, below VT1 and BR in the low limit of VT2, for example.
Looking at the TW dashboard, all metrics are related to VE. BR is no longer displayed as a zone metric in the zone section. So, this led me to hypothesise that they consider ventilation as the main training driver…
In my case, this match better with RPE, with increase (or drift) in VE instead of BR.
3 Likes
Thanks, @Granola. I’ve been watching Mark Burnley’s YouTube channel — very insightful.
For me, the key question is: what is the main metabolic marker of fatigue during a long, easy session? I’m trying to understand this.
So far, my impression is that VE is more a marker of intensity, while an increase in BR (and a decrease in TV) may reflect fatigue. I might be wrong, but I’m still searching for the “holy grail.”
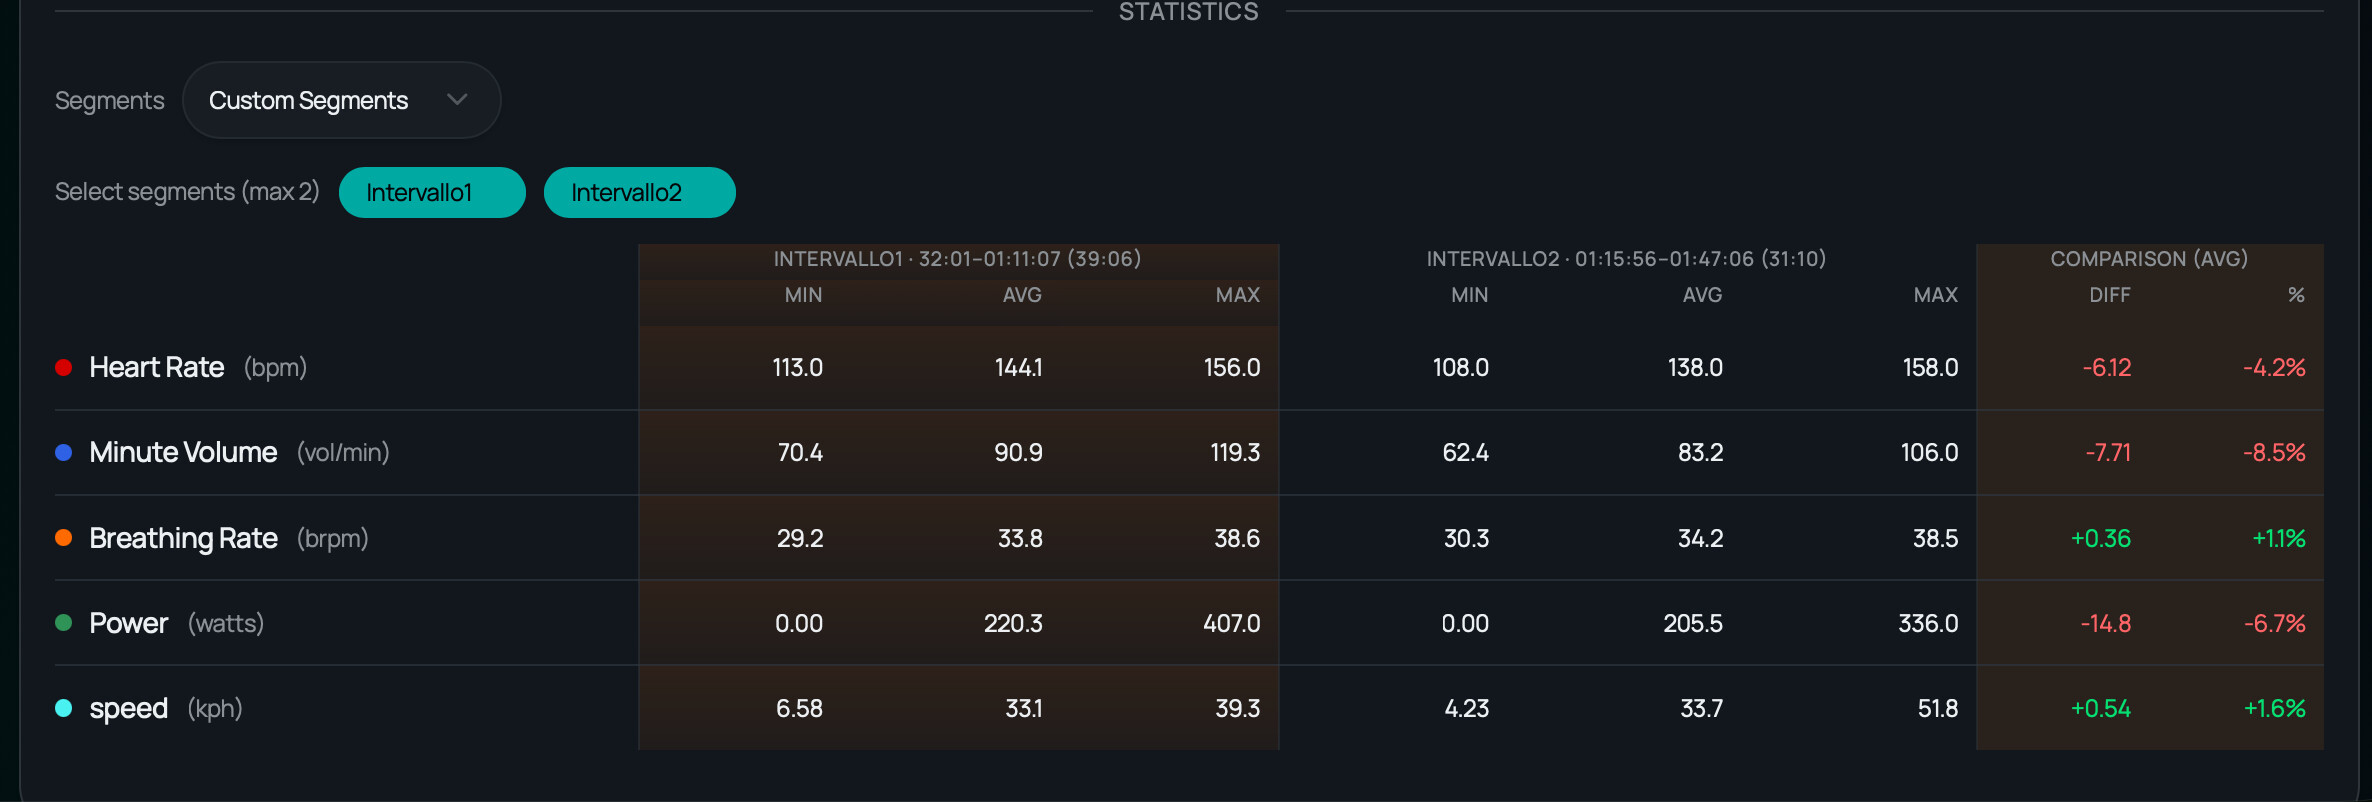
Here’s a simple example: an easy 2-hour outdoor ride on flat city roads. Two hours is not long for me — my usual long rides are 3 hours or more. But if you compare the first part to the last part, VE actually decreased, while BR increased significantly, at similar power
1 Like