It looks like it as earlier in the reel you can see the breathing sensor on back
Overall, on Garmin watches or bike computers you can set VE as a lap average. You can set lap triggers based on time or distance, whichever is more convenient for you. However, this works only for VE; there is no such option for BR. For BR and TV I use a 60-second average.
This is very individual. For example, any alarms annoy me, so it is easier for me to just glance at the watch to understand where I am
2 Likes
@Timur , thanks for the (whole) input, I largely follow and agree. Although I set my thresholds less conservative, I still try to always “err” on the lower-power side of things.
Regarding the quote: if you do do short/intermittent intervals, like the 30/15s I did tonight, VE is not a guide guiding metric. For me, it’s a mixture of power and RPE during the intervals and VE (and BR and HR) in post-analysis… ![]() But on endurance rides and long intervals VE – amended by BR (and HR) – is indeed very useful for me, too.
But on endurance rides and long intervals VE – amended by BR (and HR) – is indeed very useful for me, too.
2 Likes
@ yokuha You are absolutely right - when we talk about structured interval training, the main reference is of course power or pace.
But what about cross-country skiing? )) There are no power meters, and the terrain does not allow precise control of pace. Let me give an example.
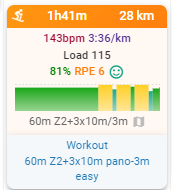
My ski workout:
60 minutes easy (up to VE 90), in zones 1–2, and then 3×10 minutes slightly around or above VT1 (VE ~120). In this kind of session I do not look at heart rate or pace at all. My reference is VE and RPE. Lactate checks confirm that I am at the intensity I want.
For cycling or running I use a small trick. My warm-up is almost always the same. It is a ramp up to about 5:00 per km in running or to about 180w on the bike for roughly 15–20 minutes. After that I take a lactate sample. If my RPE and lactate are lower than expected, I allow myself to increase the intensity slightly during the intervals. And of course, in cycling and running it is much easier to dose the workload precisely.
2 Likes
Would you now consider using VE and RPE to make that decision instead of lactate?
2 Likes
Hi @Cary_Blackburn That’s a good question. Probably yes. I’m using strips way less now. Only for calibration, like 1 or max 2 per session, and not every session. But I’m not ready to ditch them completely yet.
I’ve been using lactate for a bit over three years now, and it’s given me insane progress, plus this understanding of how RPE ties to intensity. Lactate numbers give me a faster answer — whether I’m actually getting gains from training or not. I don’t have to wait 5-6 weeks for the next ramp test. It’s a 100% working tool, and honestly, it’s a must if you’ve got ambitious endurance goals.
That said, I should note that ventilation data, especially around VT2 thresholds, tracks really closely with lactate numbers. And for sports where you can’t use power/pace (I’m talking XC skiing), ventilation is a total game-changer.
Also, digging into VE data from workouts and especially races helps me figure out where my weak spot is, what’s actually limiting me. (Specifically VO2 max and — unexpectedly — durability).
2 Likes
If you’re interested in measuring your respiration frequency this might be interesting to you:
- If you’re using Tymewear + the Connect IQ app AI Endurance now uses these direct measurements from the fit file for threshold and future durability analysis
- If you have Polar H10 or Suunto HRM, the HRV-derived respiration frequency is actually very good You can safe a lot of money

- AI Endurance now gives $1 in credit for each ride or run where you wear both Tymewear and Polar H10/Suunto HRM with artifact corruption < 5% to further improve/finetune our HRV-based algorithm
3 Likes
I have the same experience with BR from AlphaHRV. If artefacts are low/none, the breathing rate is really accurate, though a bit trailing when intensity (and thus BR), goes up quick. I compared this to 2 other sources, one of them being a MET-cart.
2 Likes
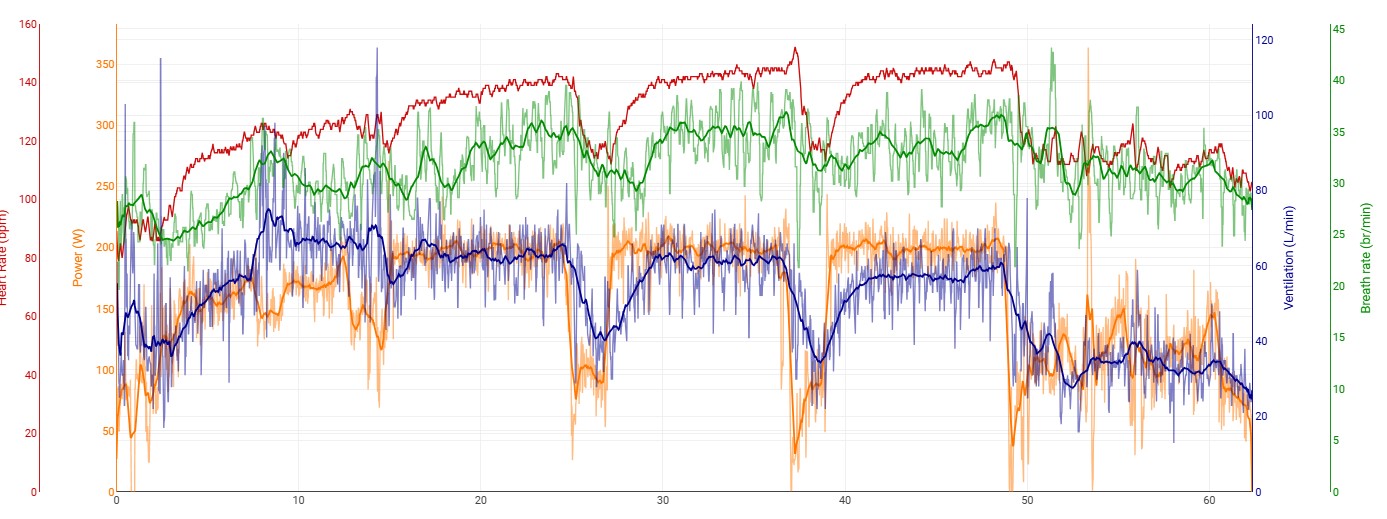
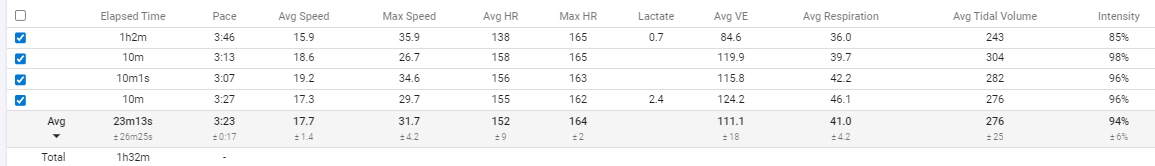
It may be useful and interesting to analyze the results of a cross-country ski race from a ventilation perspective and draw conclusions about limiting factors and improvement opportunities. This is the final race of the season: a 10 km freestyle ski race with 141 meters of elevation gain.
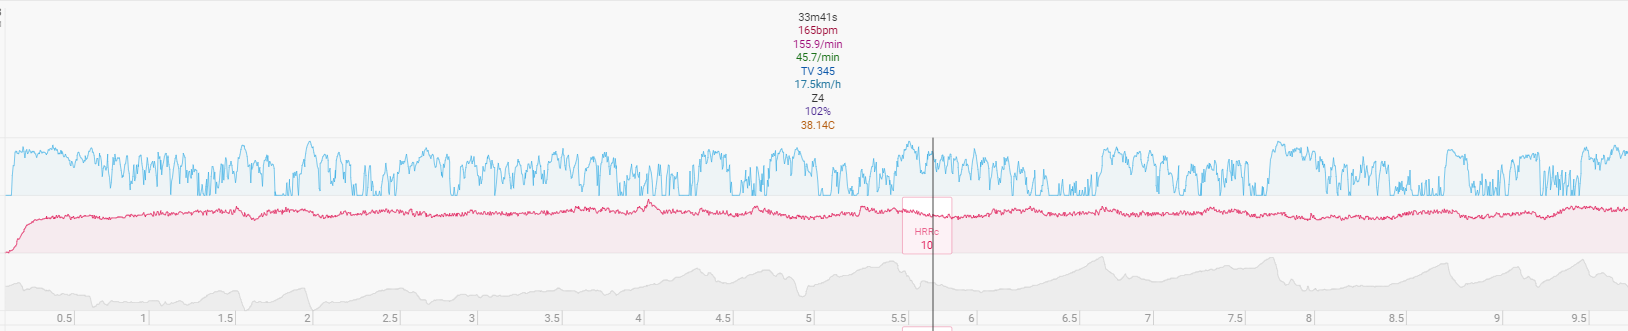
My finish time is 33:33.
My place in the category is 28 out of 80, +5:05 behind 1st place (28:28)

Short summary
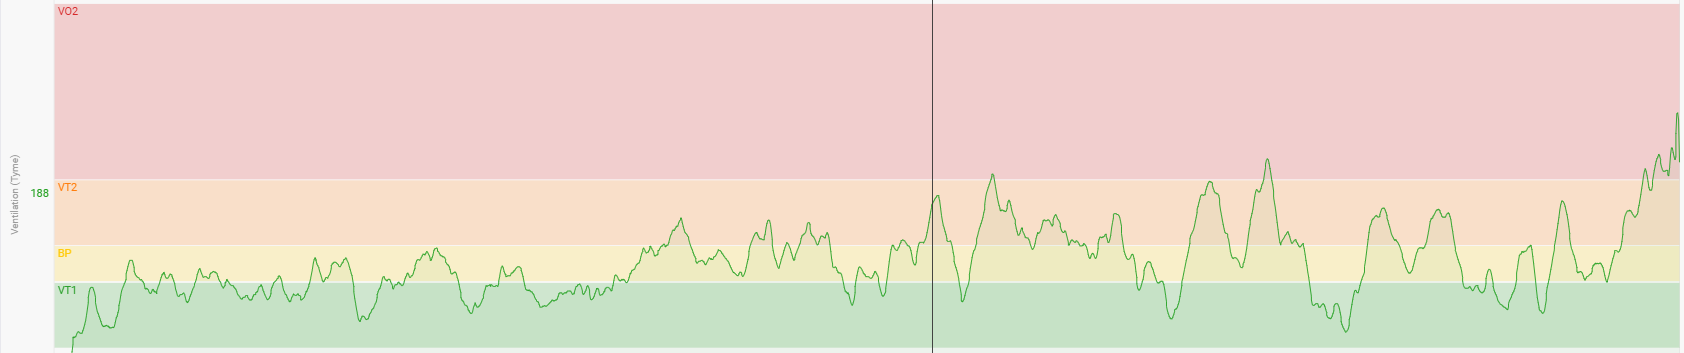
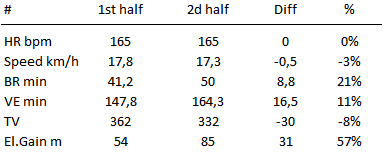
Based on ventilation data, the main limiter of the race is the increased cost of maintaining speed in the second half. This is shown by higher VE and BR, worse breathing pattern, and lower mechanical efficiency on the working terrain.
This points mainly to insufficient durability, especially on rolling terrain and moderate climbs, not to a major pacing error or a pure VO2max limitation.
Key training directions: threshold under accumulated fatigue, uphill durability, race-specific blocks of 20–35 minutes, and control of ventilation stability in key sessions.
Two more observations for me here:
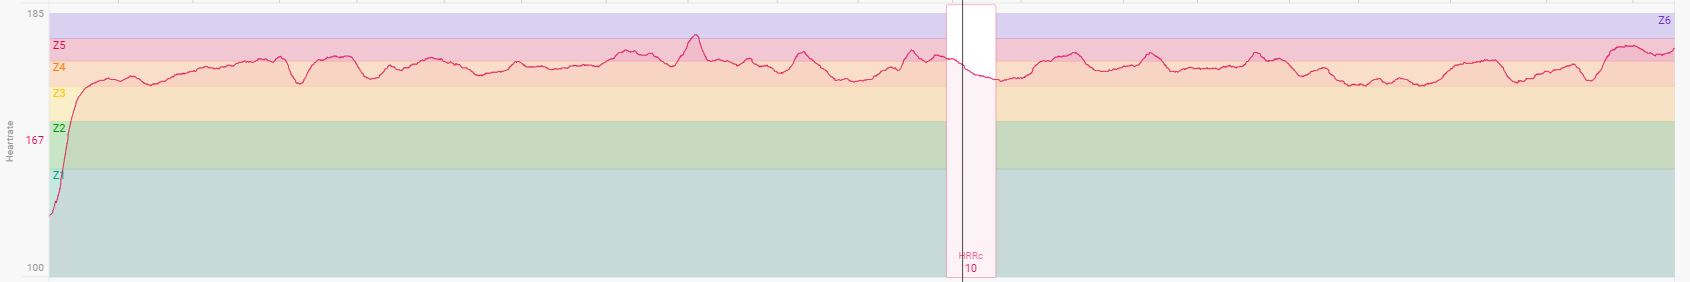
- In skiing there is no power meter; there is only heart rate and speed (which depends on terrain). As can be seen, heart rate reached a stable level of 165 (which is slightly above my threshold level of 161–163). And while heart rate is almost stable, ventilation shows large variation—dropping on descents (recovery) and rising sharply on climbs.
- It is important to have high power at threshold levels (LT1/LT2) and VO2, but it is no less important—and likely more important—to have durability: the ability to maintain a given power for a long time.
2 Likes
I built a Suunto Tymewear app if anyone uses Suunto. I’ve nearly fully detached from the Tymewear app for recording activities now.
1 Like
Great news. Is it possible to load it in the app, or is it installed separately?
Not yet, but I’ll try and publish it once I’ve done some bug fixing.
2 Likes
Hello everyone,
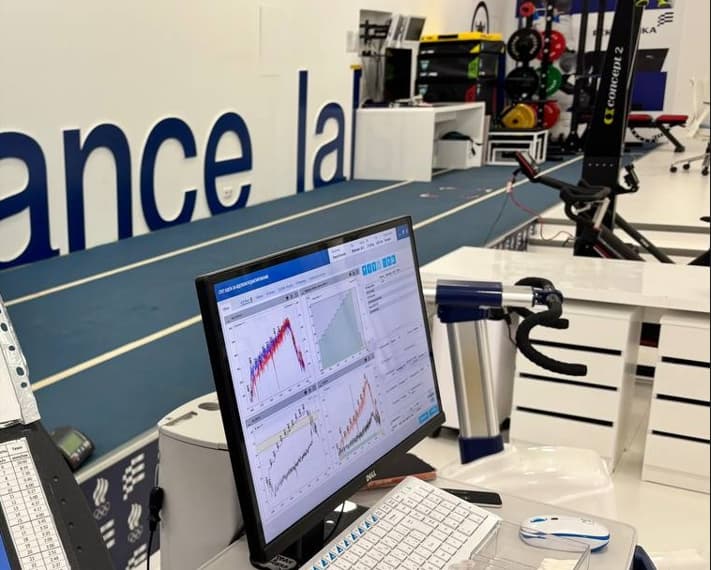
Yesterday I completed a test with a metabolic cart and lactate measurements. It was done in an Olympic committee lab, on a calibrated Cosmos Quasar treadmill, using a Cosmed Quark gas analyzer, Polar H10 heart rate monitor, and EKF Biosen C-Line lactate analyzer.
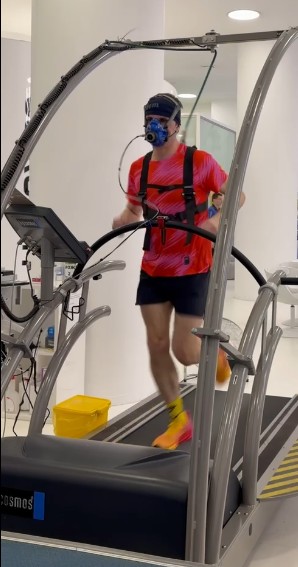
At the same time, I recorded ventilation data with the Tymewear sensor in the mobile app. Conditions were synchronized. Stages were 2 minutes each, +1 km/h per stage, 1% incline, until exhaustion.
Goal 1: determine my VO2max and thresholds based on lactate and gas analysis.
Goal 2: compare these results with Tymewear data and see how close they are to lab measurements.
Sharing the results. Feedback is welcome.
Note on lactate: lab values do not match my portable device. After warm-up, my device showed 0.8 mmol, while the lab showed 1.3 mmol. But the key point here is the shape of the lactate curve. Going forward, I will use my own lactate values at threshold intensities.
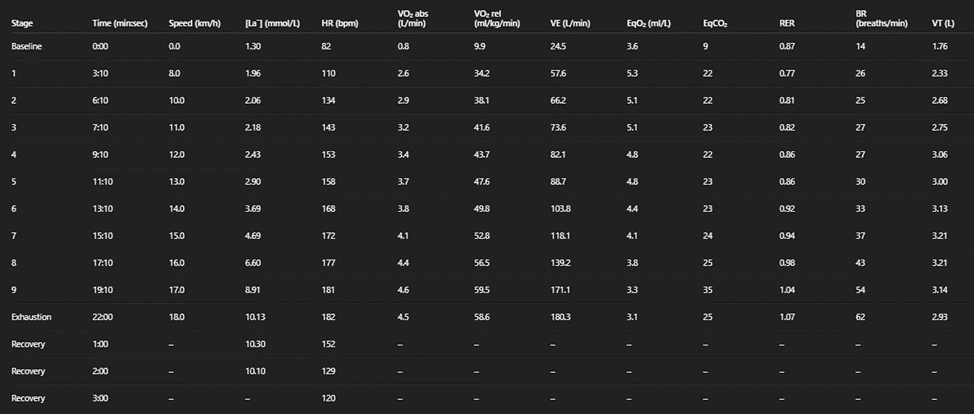
Test started at 8 km/h. I reached 18 km/h, with the last stage held for 55 seconds.
Results:
My absolute VO2max = 4.6 L/min or 59.5 ml/kg/min. This was a positive surprise. I expected around 53-55, and my Garmin shows 51.
Lab results are as follows:
Here is the conclusion from the laboratory test:
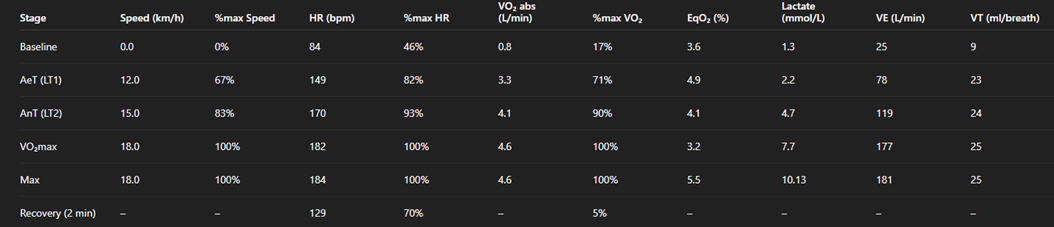
And here is the summary data for each stage of the test.
Unfortunately, I do not have access to the raw gas analyzer data, but overall this is sufficient from report.
The test was done in the evening. By the next morning, I received the Tymewear results. It was clearly processed automatically, without any manual adjustments.
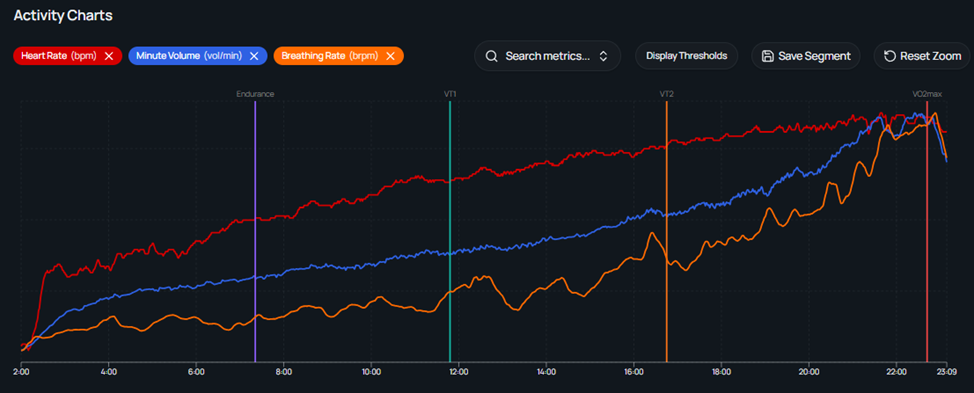
It is clear that we cannot directly compare ventilation values from the metabolic cart and Tymewear, as they are calculated differently. However, we can reliably compare breathing rate and the resulting estimates of thresholds/BR and VO2max.
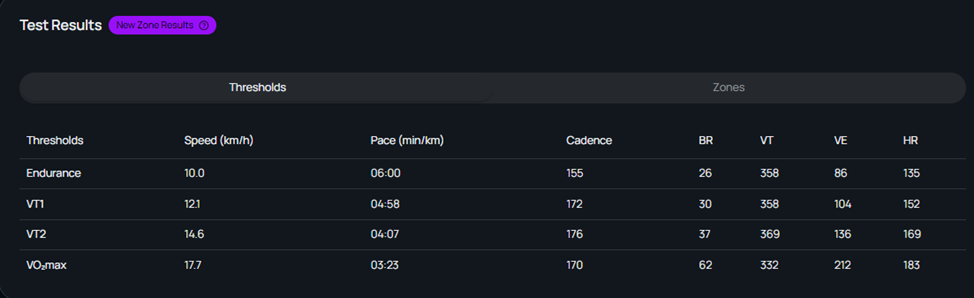
Now threshold pace comparison (Lab vs Tymewear):
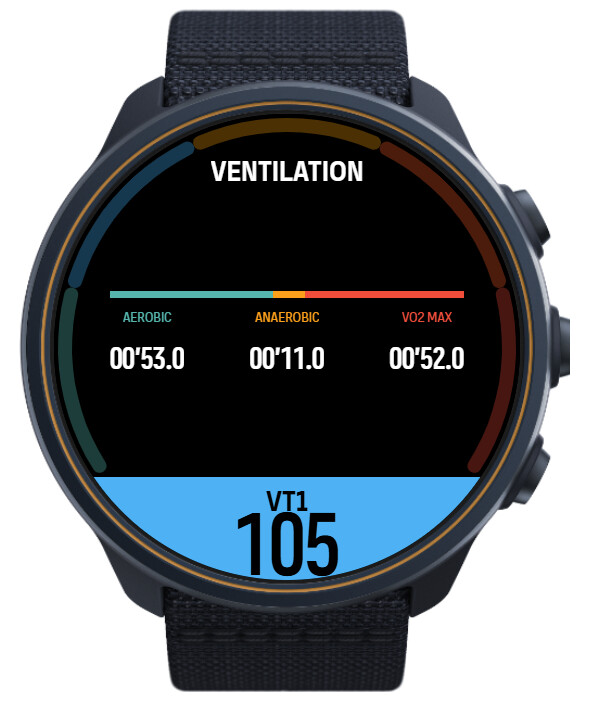
- LT1 / VT1: 12.0 km/h vs 12.1 km/h
- LT2 / VT2: 15.0 km/h vs 14.6 km/h
- VO2: 18.0 km/h vs 17.7 km/h
The lab threshold values almost perfectly match the Tymewear data. The differences are mainly due to the averaging methods used by the lab and Tymewear.
Breathing rate comparison (Lab vs Tymewear):
- 12 km/h: 27 / 12.1 km/h: 30 (+2)
- 15 km/h: 14.6 km/h: 37 / 37
- 18 km/h: 62 / 62
Again, almost perfect accuracy. Difference come probably due to the lab’s and Tyme averaging effect.
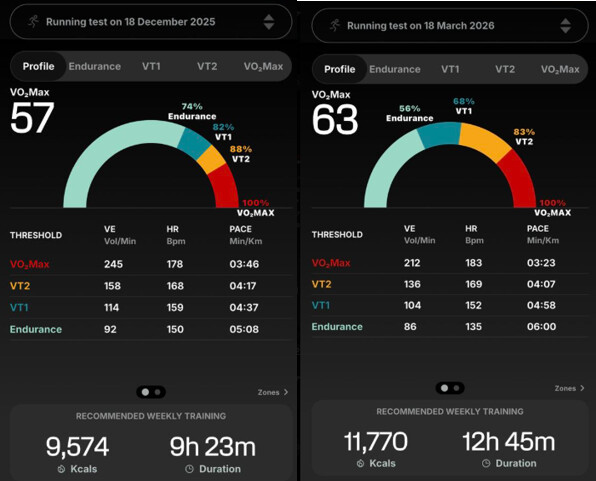
Now about VO2max estimation.
Tymewear result is 63 ml/kg, while the lab shows 59.5. My assumption is that Tyme used the full 18 km/h stage, while I stopped after 55 seconds of that stage and oxygen consumption had already plateaued.
However, I also checked your VO2 values at thresholds:
Lab vs Tymewear:
- At 12 km/h: 43.7 ml/kg vs 44 ml/kg (at 12.1 km/h)
- At 15 km/h: 52.8 ml/kg vs 52 ml/kg (at 14.6 km/h)
Here I see almost perfect accuracy as well.
Lab recommendations:
- Maintain VO2max level.
- Priority: improve running economy and durability.
Tymewear recommendations:
- Maintain VO2max (24 min 18 sec per week).
- Develop VT1 range from 4:58 to 4:30 pace by doing 4h3min per week in Zone 2 / VT1.
- Maintain endurance base: 8h17min per week.
- Total weekly training time: 12h45min.
My previous running test was done outdoors, as best as possible, in December 2025. After that, I did very little running—mostly cross-country skiing and some maintenance sessions on the bike trainer.
The results of both tests in the mobile app are shown below.
Disclaimer: I am not sponsored by any sports brands and have no affiliation with Tymewear or the lab. The testing cost me about 200 euros. This included bioimpedance, ECG, heart ultrasound, and the test itself.
And yes, in the next couple of days I plan to do a bike test, but without VO₂max, based on the lactate curve.
21 Likes
Thank you for sharing this.
1 Like
Just seen this in the Activity section on tymewear.
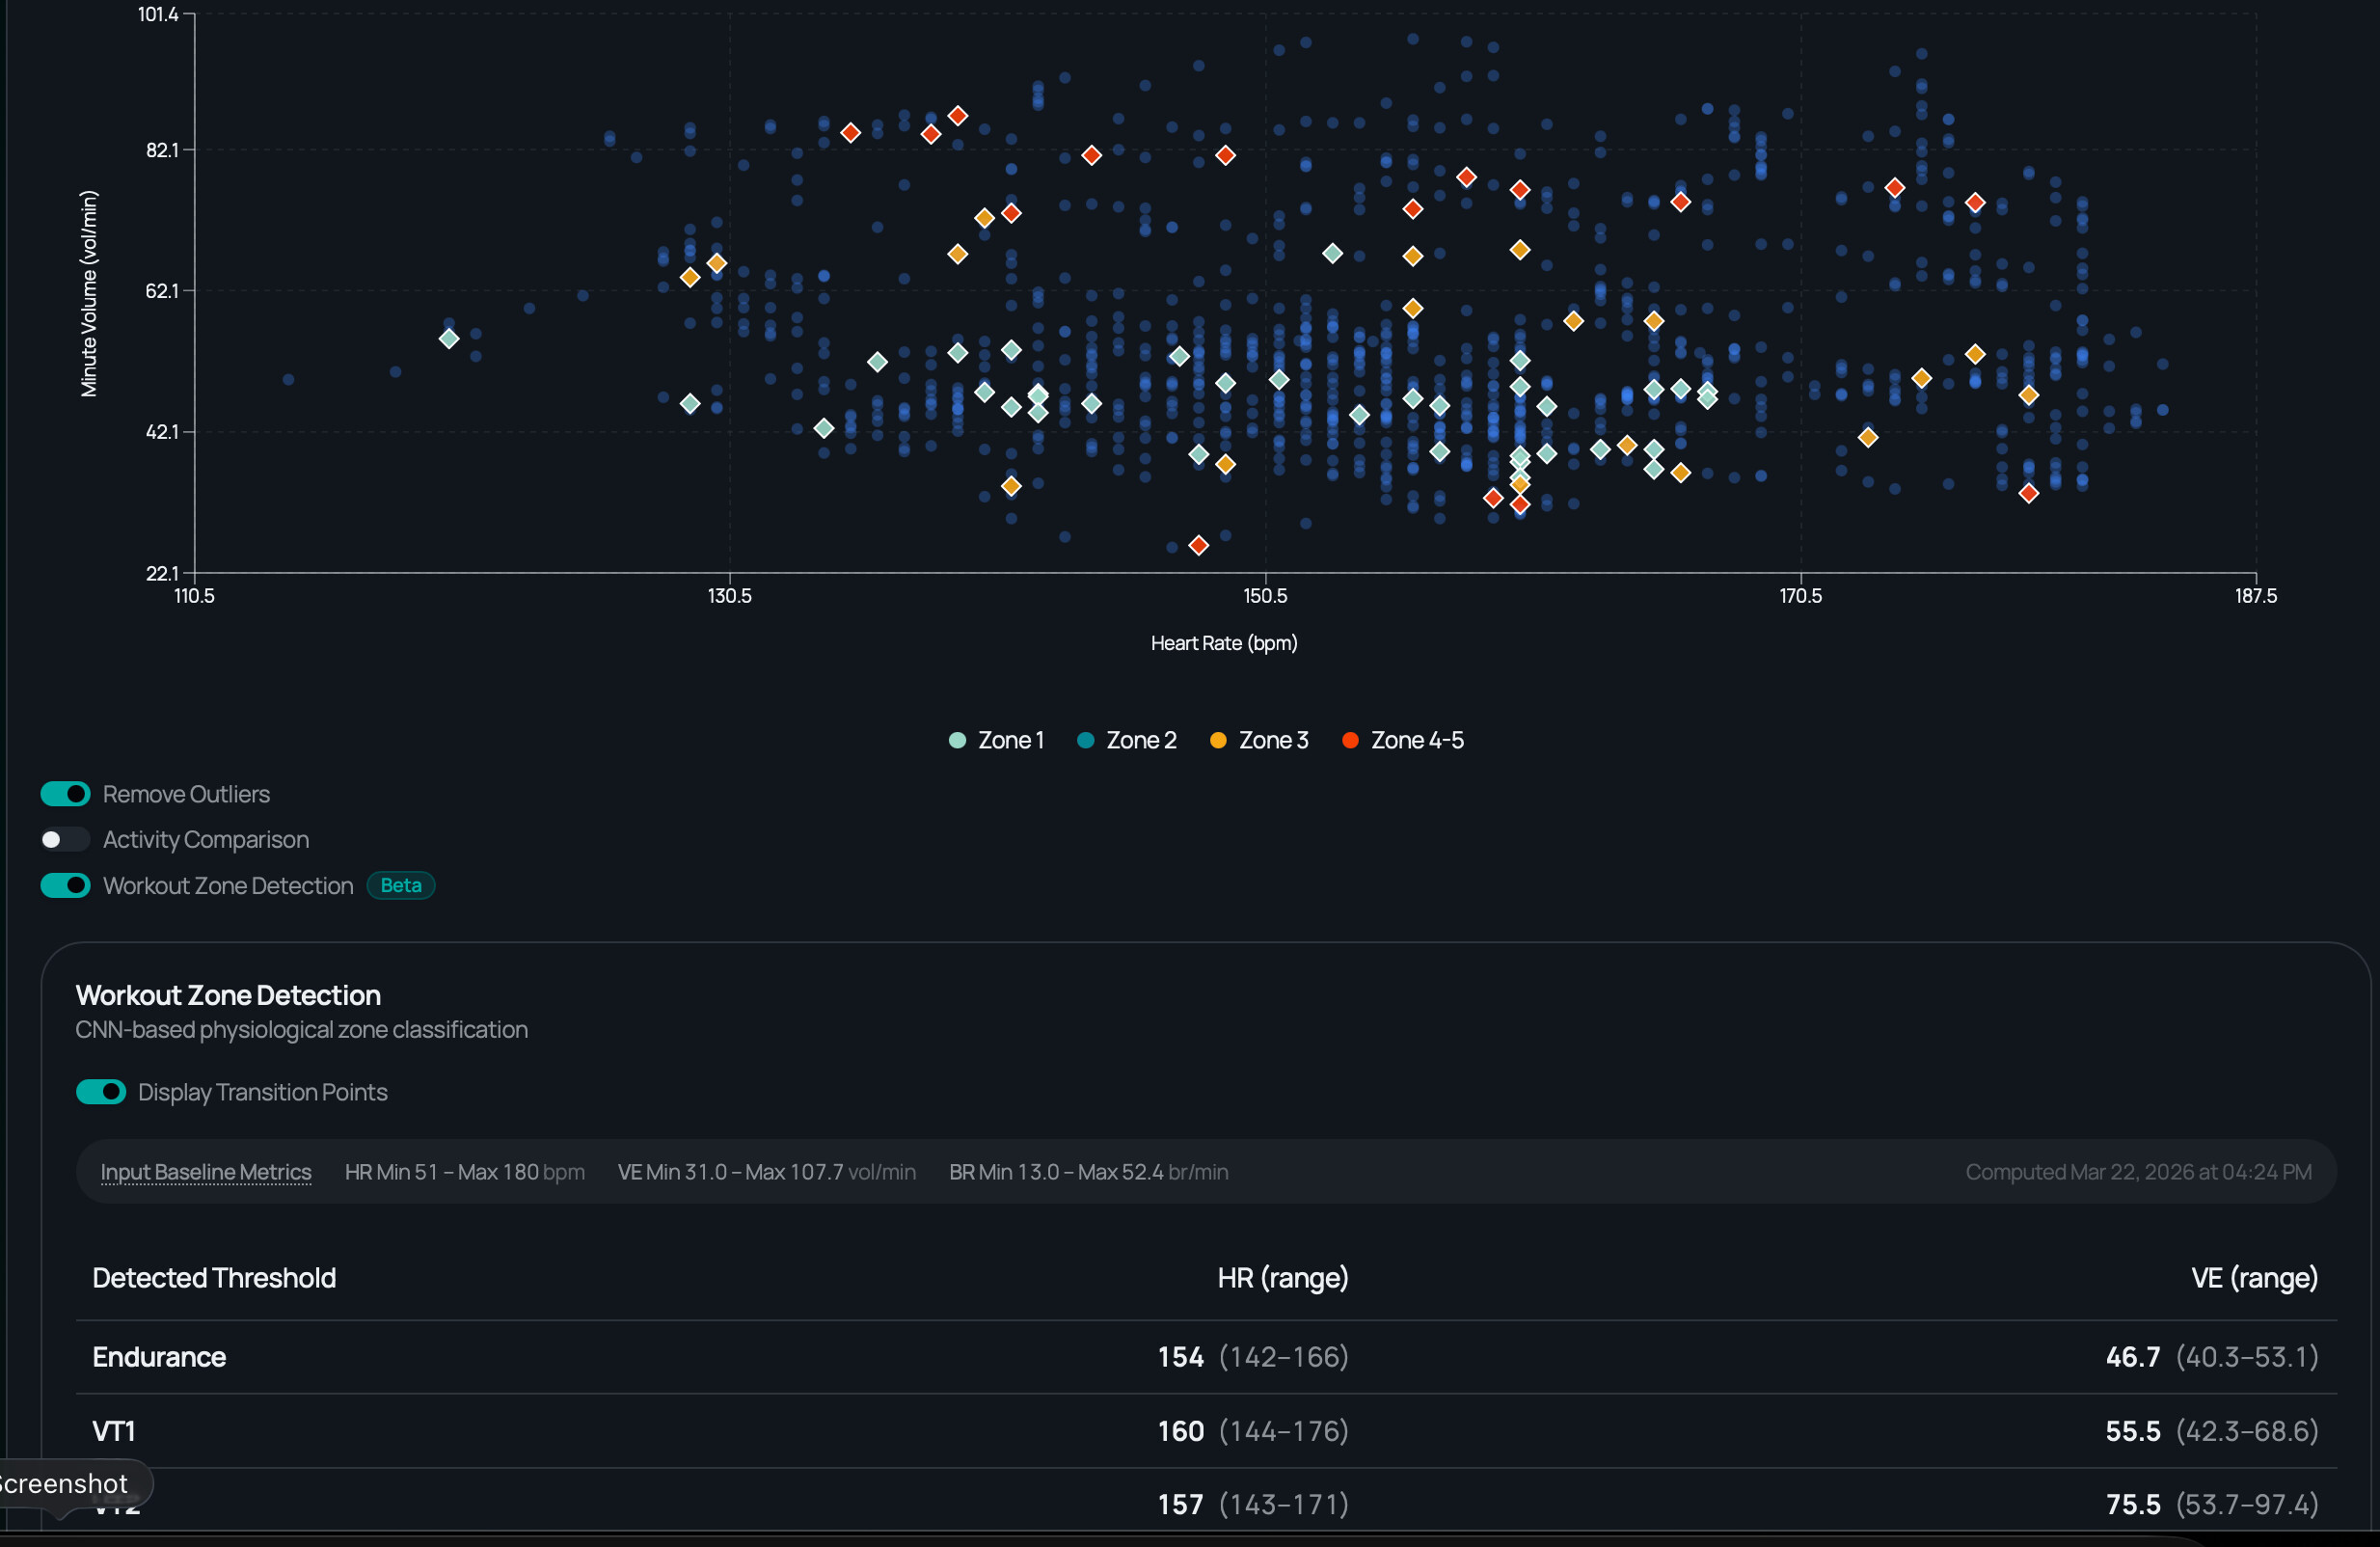
A beta function I hadn’t noticed before. Is this something to do with the feature someone mentioned regarding identifying zones outside of testing?
1 Like
If I understood the support team correctly, this will be further developed into real-time threshold detection. That means directly during the workout.
I would compare it to Garmin’s “performance condition,” where after the warm-up, at the start of a session, Garmin shows a value like +5 or -5, etc.
But here it will be based on ventilation and, I assume, will be more accurate.
You can also compare a workout with the test results, for example.
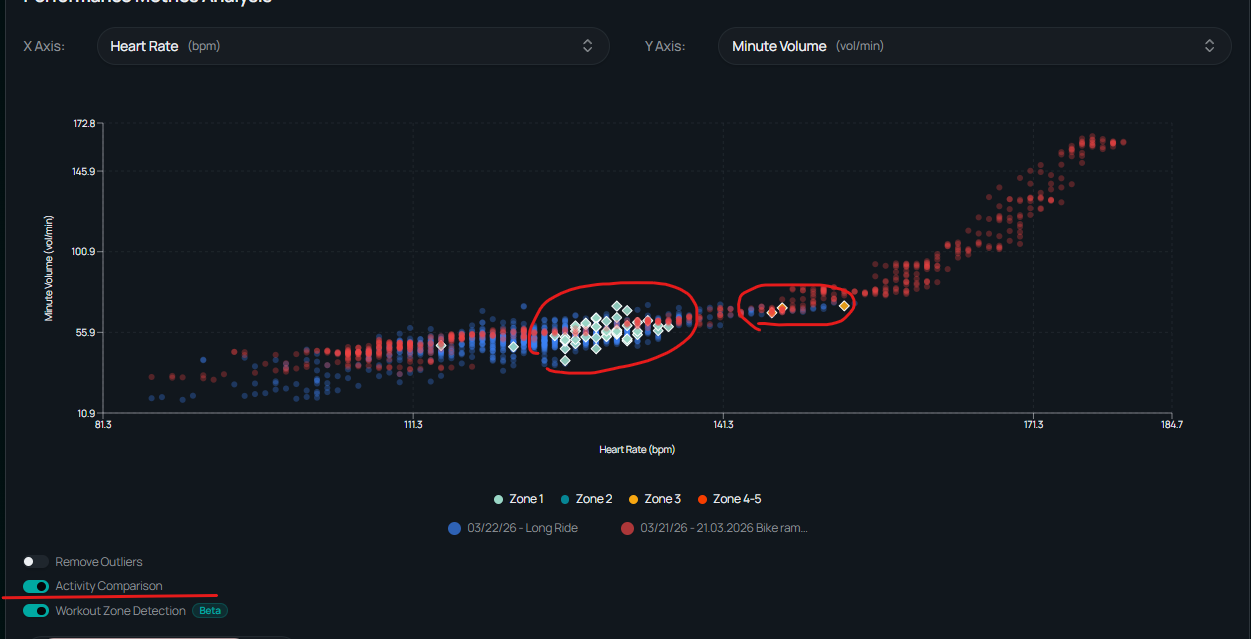
Or compare it with another similar session and see what has changed.
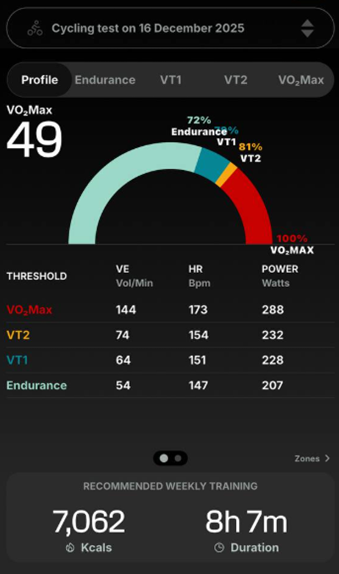
Test results on the bike trainer
Equipment: Thinkrider X7-5 Pro smart trainer, Assioma Duo power meter pedals, Garmin Edge 1050 bike computer. Eaglenos lactate meter. Trainer control via the Tymewear app.
Step test started at 120 watts, with 20-watt increases every 3 minutes. The test was completed up to 300 watts, with the final stage fully completed for 3 minutes.
Data table:
Lactate thresholds were calculated as follows:
- LT1: Bsln + 0.5 mmol, 3rd degree polynomial
- LT2: ModDmax, 3rd degree polynomial
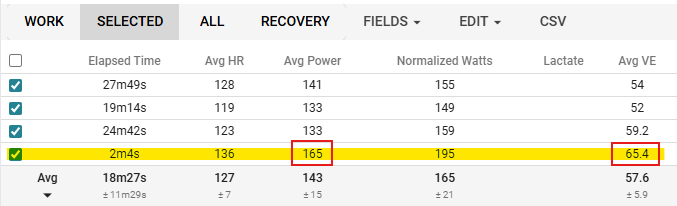
Important note. There is a difference in average power between the trainer and the Assioma pedal data. At the same time, Tymewear calculations are based on the fixed power values used in the protocol. I will provide the calculations separately for the trainer and for the Assioma pedals.
| Power | HR MAX | Lactate | Assioma Duo | RPE |
|---|---|---|---|---|
| 120 | 110 | 1,20 | 124 | 1 |
| 140 | 116 | 1,00 | 140 | 2 |
| 160 | 119 | 1,10 | 158 | 2 |
| 180 | 128 | 1,30 | 177 | 4 |
| 200 | 141 | 1,70 | 195 | 5 |
| 220 | 150 | 1,90 | 214 | 6 |
| 240 | 160 | 3,00 | 231 | 6 |
| 260 | 163 | 4,20 | 249 | 8 |
| 280 | 174 | 5,50 | 270 | 9 |
| 300 | 180 | 9,60 | 289 | 10 |
| ERG | Power | La | HR | ||
|---|---|---|---|---|---|
| Bsln+ | Bsln + 0.5 | 3rd degree polynomial (user-defined) | 206 | 1,6 | 143 |
| Dmax | ModDmax | 3rd degree polynomial (default) | 265 | 4,6 | 167 |
| Assioma Power | Power | La | HR | ||
|---|---|---|---|---|---|
| Bsln+ | Bsln + 0.5 | 3rd degree polynomial (user-defined) | 196 | 1,6 | 141 |
| Dmax | ModDmax | 3rd degree polynomial (default) | 256 | 4,8 | 168 |
For an objective assessment of progress, I am providing data from the previous test, evaluated in the same way: +10 watts at LT1 and almost +20 watts at LT2.
| 16.12.2025 | |||||
|---|---|---|---|---|---|
| Bsln+ | Bsln + 0.5 | 3rd degree polynomial (user-defined) | 186 | 1,9 | 141 |
| Dmax | ModDmax | 3rd degree polynomial (default) | 234 | 4,2 | 159 |
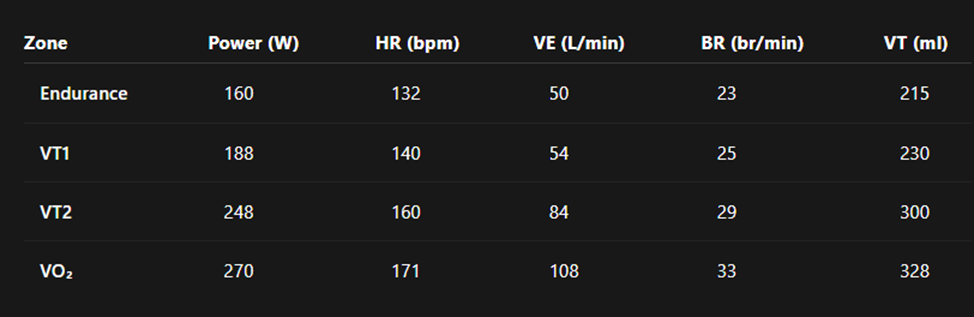
Then I analyzed the ventilation data using AI (Assioma power) and obtained the following assessment:
And the next day, the Tymewear threshold report was ready.
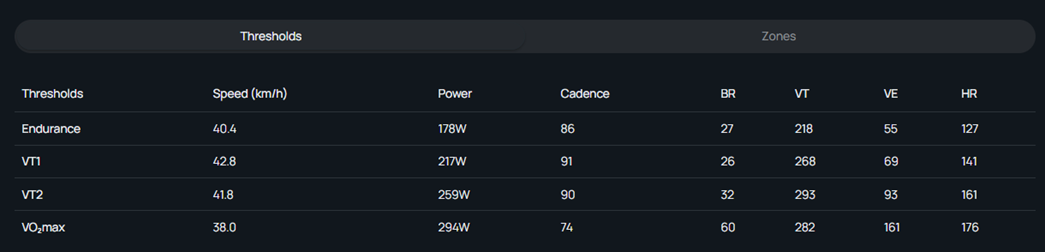
Final comparison:
| # power | ERG (by La_) | Assioma (by La_) | AI (Assioma by VE) | Tymewear by ERG/VE |
|---|---|---|---|---|
| Endurance | - | - | 160 | 178 |
| VT1 | 206 | 196 | 188 | 217 |
| VT2 | 265 | 256 | 248 | 259 |
| VO₂max | - | - | 270 | 294 |
When evaluating the test results and setting my training thresholds, I also rely on RPE and always choose more conservative power threshold values.
| Threshold | Power_W | HR_bpm | Lactate_mmol_L |
|---|---|---|---|
| LT1 | 190 | 140 | 1,6 |
| LT2 | 245 | 160 | 4,5 |
Conclusions:
It is clear that I increased my power over the winter ski season. The previous test ended at 280 watts. This is also supported by RPE.
It is important to understand that threshold values are not fixed and can change quite quickly. The results are also influenced by the calculation method and data quality (the trainer was clearly not providing accurate power).
Since getting the Tymewear sensor in November, I have based all my training (skiing, running, cycling) primarily on ventilation data, while power, heart rate, and pace were only supporting indicators.
If we look at ventilation values and RPE, they correlate very well, and for me ventilation remains the key marker of load.
Here are two Tymewear tests I did for comparison. December 16 compared to March 21
- Weeks 14.
- Total Active 81.
- Duration 104h0m (on Bike 33h50m)

6 Likes
Ciao Timur,
First: thanks for your very useful data comparison across different scenarios!
I’m converging on the same data across my models based on lactate.
Don’t you think that 3m step length is a bit too short for the bike test? Over my experience, I’ve noticed that longer duration (5m), especially for trained athletes, gives better curves. It’s also well reported that longer intervals give time for lactate to stabilise.
Maybe, you’ll find different thresholds (generally lower)
1 Like
Hi Nicola_Cardaci,
You’re absolutely right. For cycling, it makes more sense to use 5-minute stages. And yeah, threshold values will probably be a bit lower. But for the first tests (running and cycling), I just followed Tymewear’s protocol recommendations. If I understand it right, determining ventilation (similar to a metabolic cart) needs — and works fine with — shorter stage durations. I used to do 5-minute stages before. Here, though, I went with 3 minutes just to keep protocols consistent.
Anyway, I always evaluate any test based on RPE first and try to be on the conservative side.
Take a look at my numbers:
RPE 4–5 sits between 180 and 200w. ~190w That lines up nicely with the top of zone 2.
RPE 6–8 is between 240–260 watts ~ 250w That correlates really well with FTP.
If you’ve got a good feel for your body and intensity, you honestly don’t need any tests at all ![]()
For more precise numbers (like dialing in pace for a half marathon), I went with an MLSS protocol. And if you really need to nail FTP on the bike — well, racing or just going all out for 60 minutes is your best bet ![]()
And yeah, just to add — for me, ventilation numbers are more of a priority during training. In actual workouts, I usually hit those ventilation values at a lower power.
Like, my VE at VT1 (around 69) shows up during training at roughly 170–190w, whereas tests give me 188–217w.
2 Likes
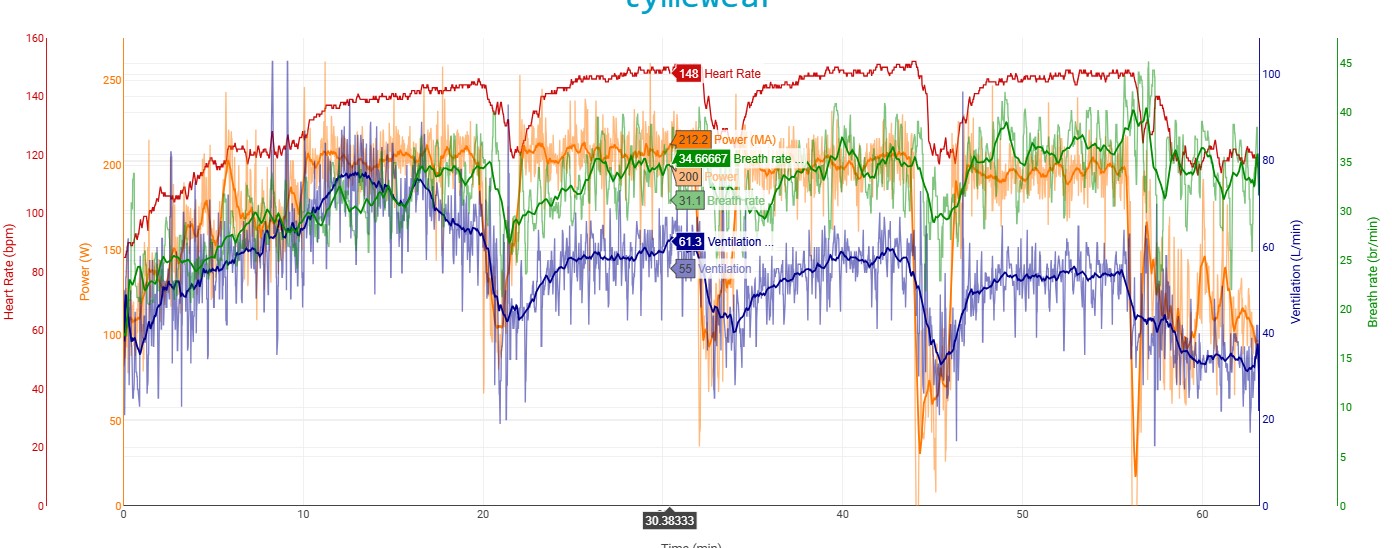
Here’s a question for other Tymewear owners. I’ve notice lately while warming up that my VE in the first 10 mins tends to go up quickly, and then seems to reset. I wasn’t sure if this was something my body has been doing, or just a normal response. Here’s 2 different rides of 3x10min efforts at about VT1. It’s easy to see VE climb in the 1st 10 min then settle into a pretty normal response. Has anyone else seen similar?