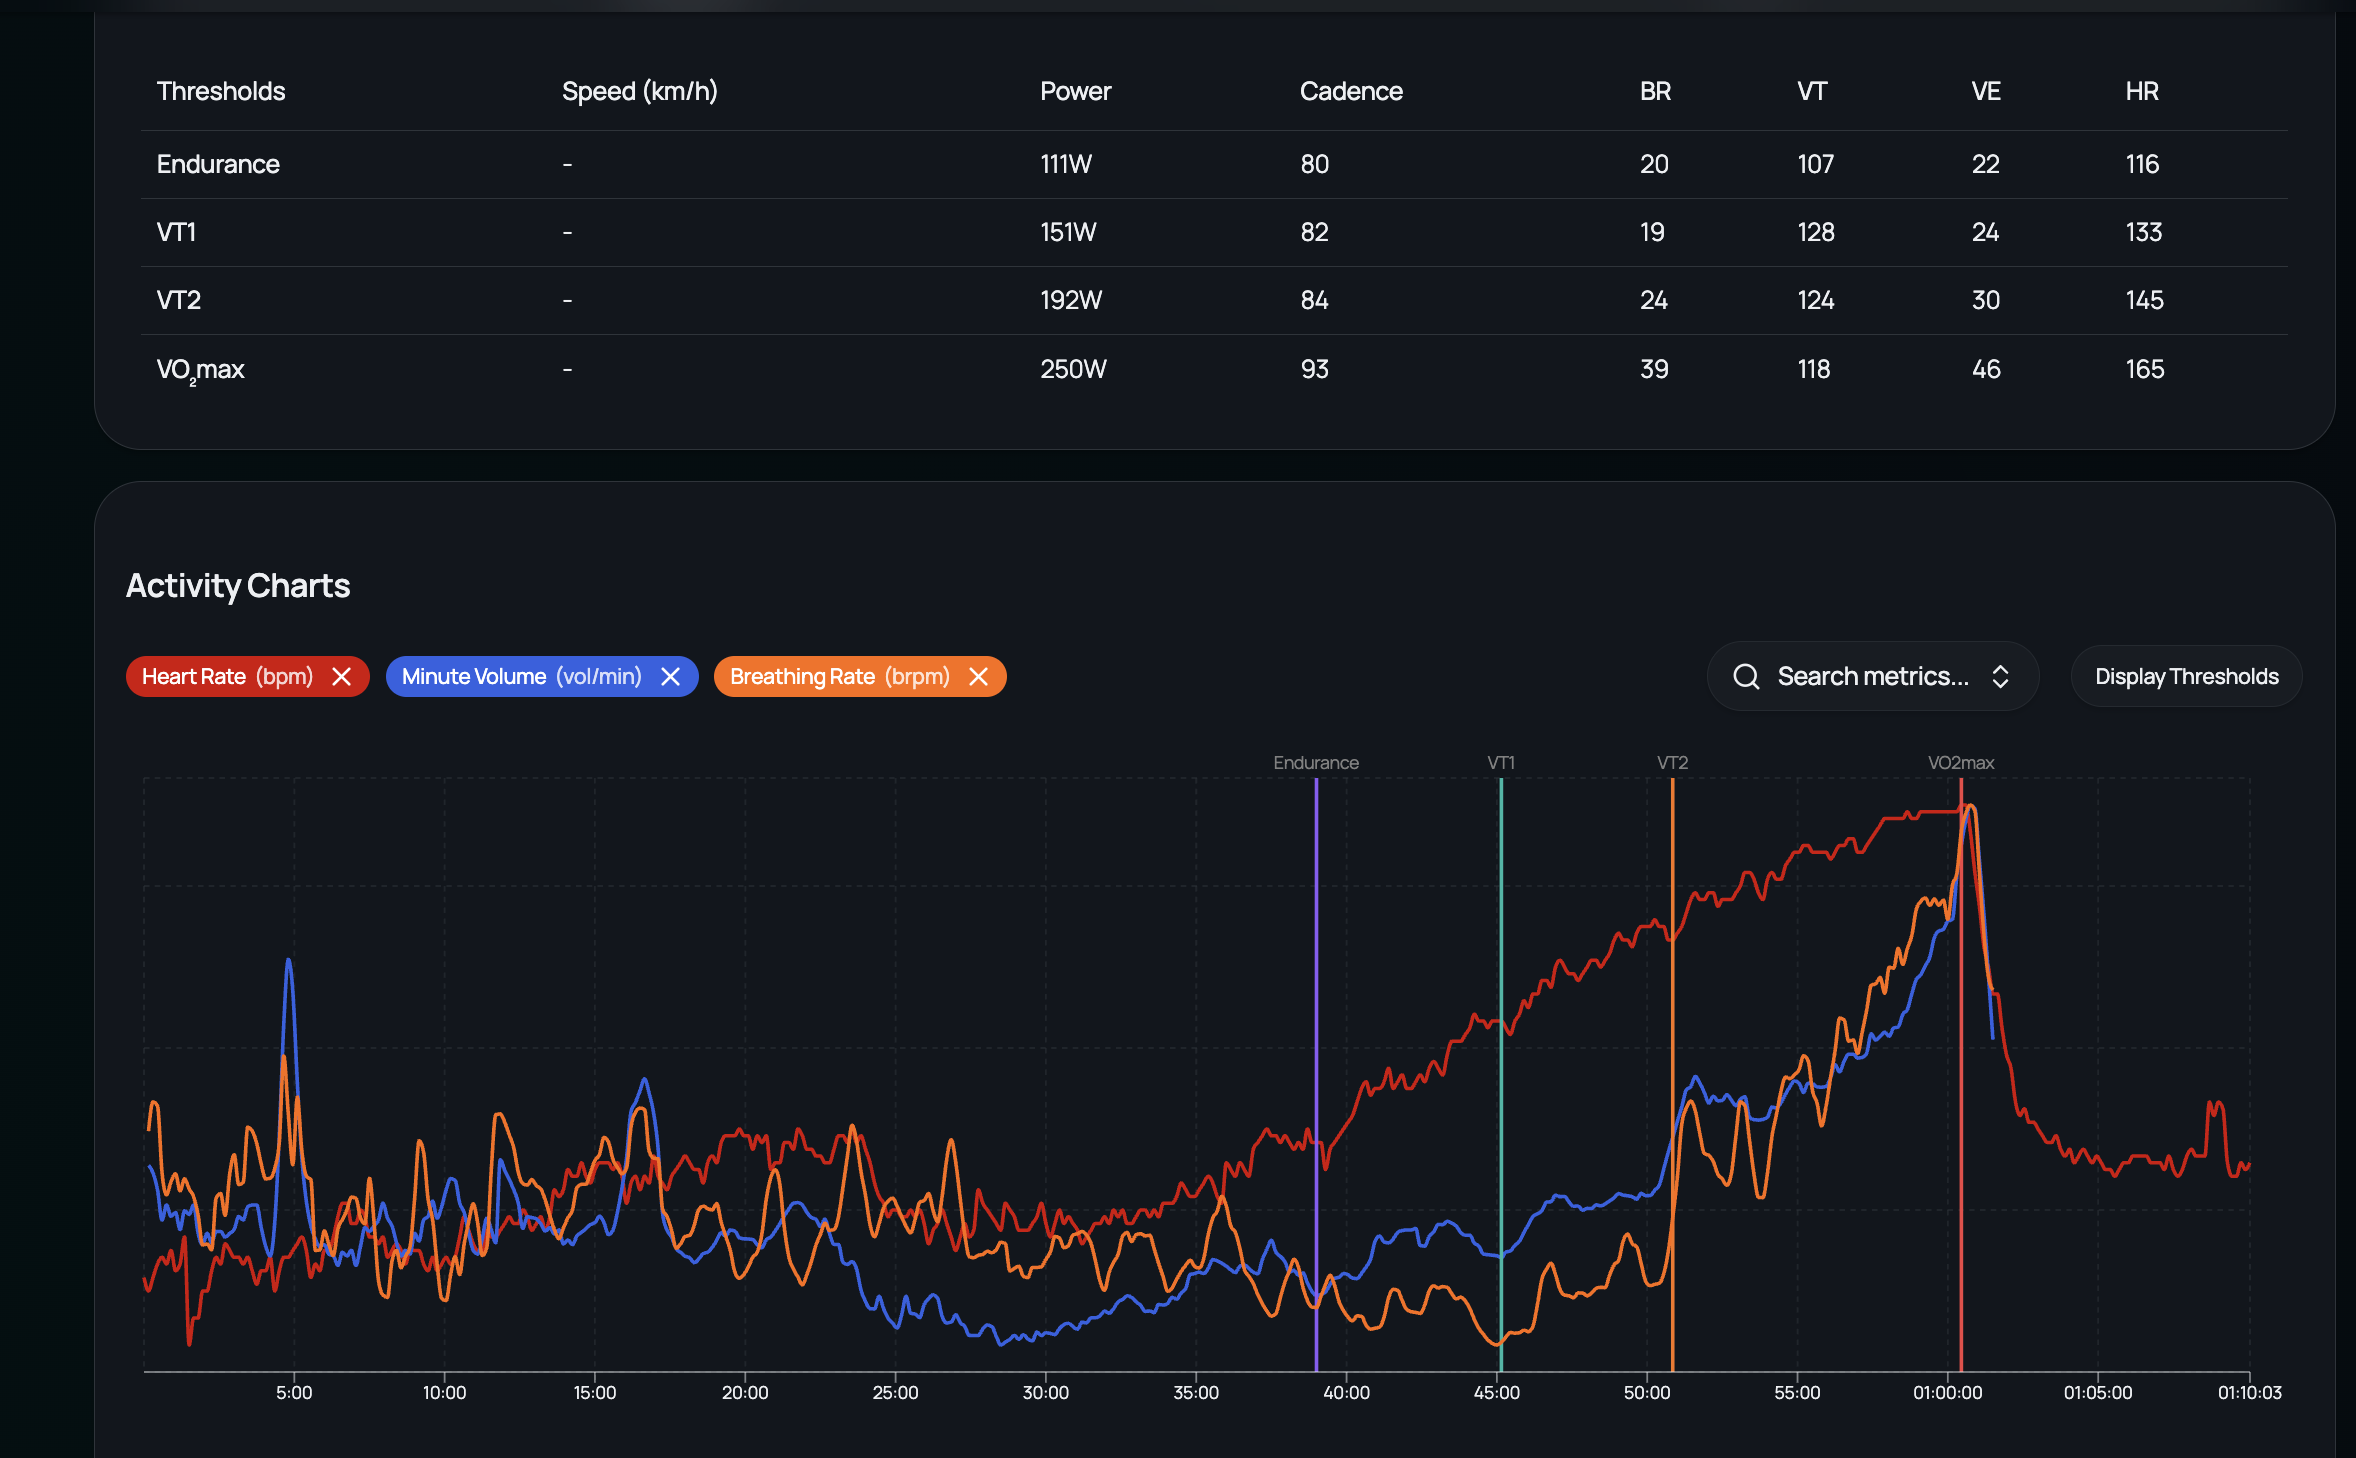
Here you can clearly see the correlation between intensity (power) and ventilation (VE), while BR did not change (even though power decreased slightly).
Yes!
Use BR as reference metric could be a good marker of fatigue/intensity. Power and VE are regulated as consequence.
What do you think?
1 Like
There is definitely something here.
It’s also individual. We need more data - more sessions of different durations and intensities, but in comparable conditions. Then it will be possible to correlate RPE with ventilation data, taking drift into account.
It also likely makes sense to separate “outdoor” and “indoor trainer” data, as there is clearly a difference in breathing rate.
What I can say for sure is that heart rate does not reflect all the processes happening in the body.
1 Like
I’m not sure if there is any specific research on the best marker for “fatigue” under VT1, but your hypothesis may be correct, because at least in theory, VE should remain mostly flat for 2 hrs under VT1, but breath rate can still increase due to various non-metabolic factors such as muscle damage, CNS fatigue, dehydration, thermodynamics etc. It could also be caused by glycogen depletion even though fat should be the predominant fuel source.
2 Likes
I’m the same. My range of VE is so narrow below VT1 that it is useless for monitoring in real time or analysing afterwards. So I use a combination of power, heart rate and RPE. I use the ventilation data for threshold and V02 max intervals to make sure I achieve and stay at the desired intensity. I plan to use the Breathing Rate inform me of my actual fatigue on longer rides.
For me, VT1 (VE 53-64) is the top of Zone 2. It’s not an easy ride at all. I do it through intervals — long ones, like 4×15 or 3×20. For control, I use average VE — this option is available in the Garmin app, and it helps me hit the target intensity quite accurately (while VT1 power is listed as 204W, the real value is lower).
Then this is a place we need to research more. All of these are underlying markers of fatigue.
Had this from the Tymewear guys regarding up and coming development.
Let me share some upcoming features. We are developing the ‘auto detection’ which means that technically a threshold test is not required (it takes a number of workouts to establish the ventilatory thresholds) and also adjusts over time - this mean it would also adjust workouts to match your slowly shifting profile.
Even soon - we are working on more analysis data for activities - expect this to grow over time. Part of this is also to clearly show the purpose of each workout and how it contributes to the total goal. You will see the app updating for this, though the Deshboard already provides access to more detailed analysis.
Though it seems we have people on here who are delving deep in to the metrics. I tried to use the vtcheck app, but unfortunately it said it had run out of room when I attempted to connect to Strava.
Error 403: Limit of connected athletes exceeded
4 Likes
I’ve just had my Test results back and am just digesting them.
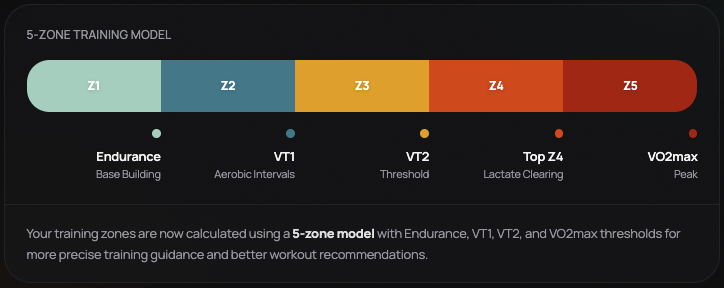
Am I correct in assuming that due to there being 5 zones but only 4 intensity areas to target this is and never will be any targets set for their Zone 3?
@pepe I’m just putting on here for your information showing the Tymewear thresholds and the ones from your analysis on Intervals.
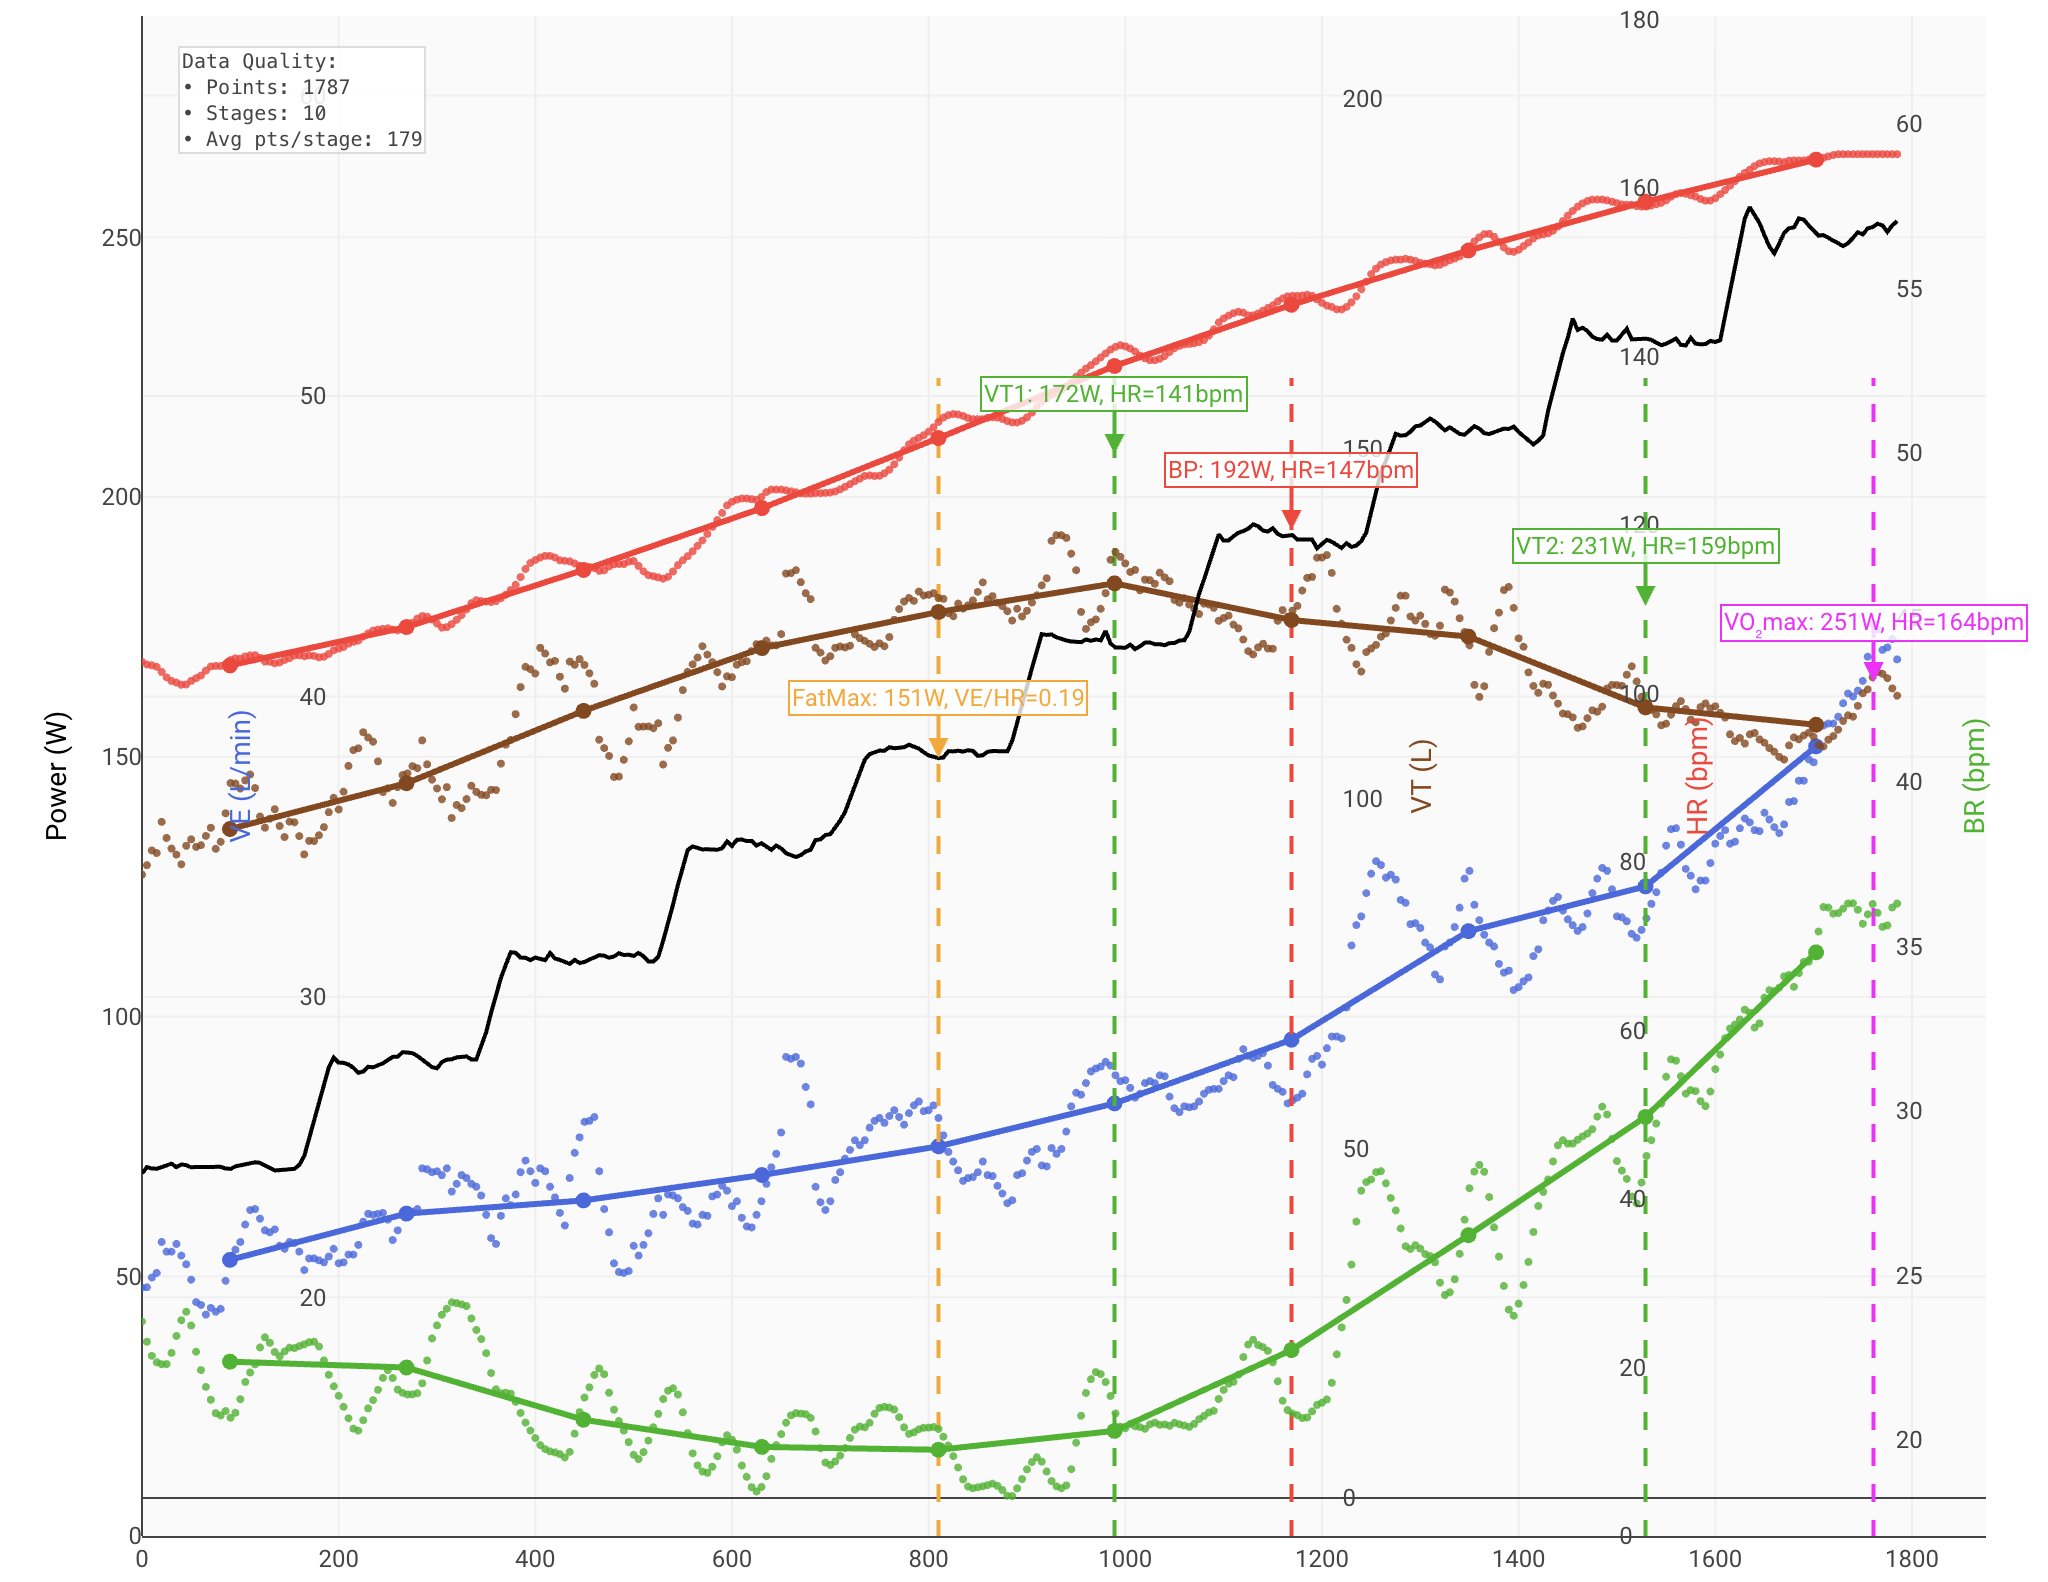
The ones from your analysis seem to to shifted one threshold to the right if you see what I mean. If you want I can try and DM you the fit file.
It seems that this is exactly how it is intended.
Zone 3 is too intense for developing the aerobic base, but at the same time not intense enough to meaningfully shift the anaerobic threshold.
Targeted workouts for aerobic development are done at the top of Zone 2.
I don’t use Tyme’s training plans. When I plan my sessions, I target ventilation values, using pace/power around VT1. As a result, the work naturally falls partly into Zone 2 and partly into Zone 3, with the average close to VE at VT1.

1 Like
Hi Cary_Blackburn,
The vt detection needs tuning, but the graph with the regressions is great.
I would like very much your Test fit file.
Can you message me your email address so I can send the file to you, I don’t seem to be able to do it on the forum
Do you mean Zone 4 since it’s combined with Zone 5?
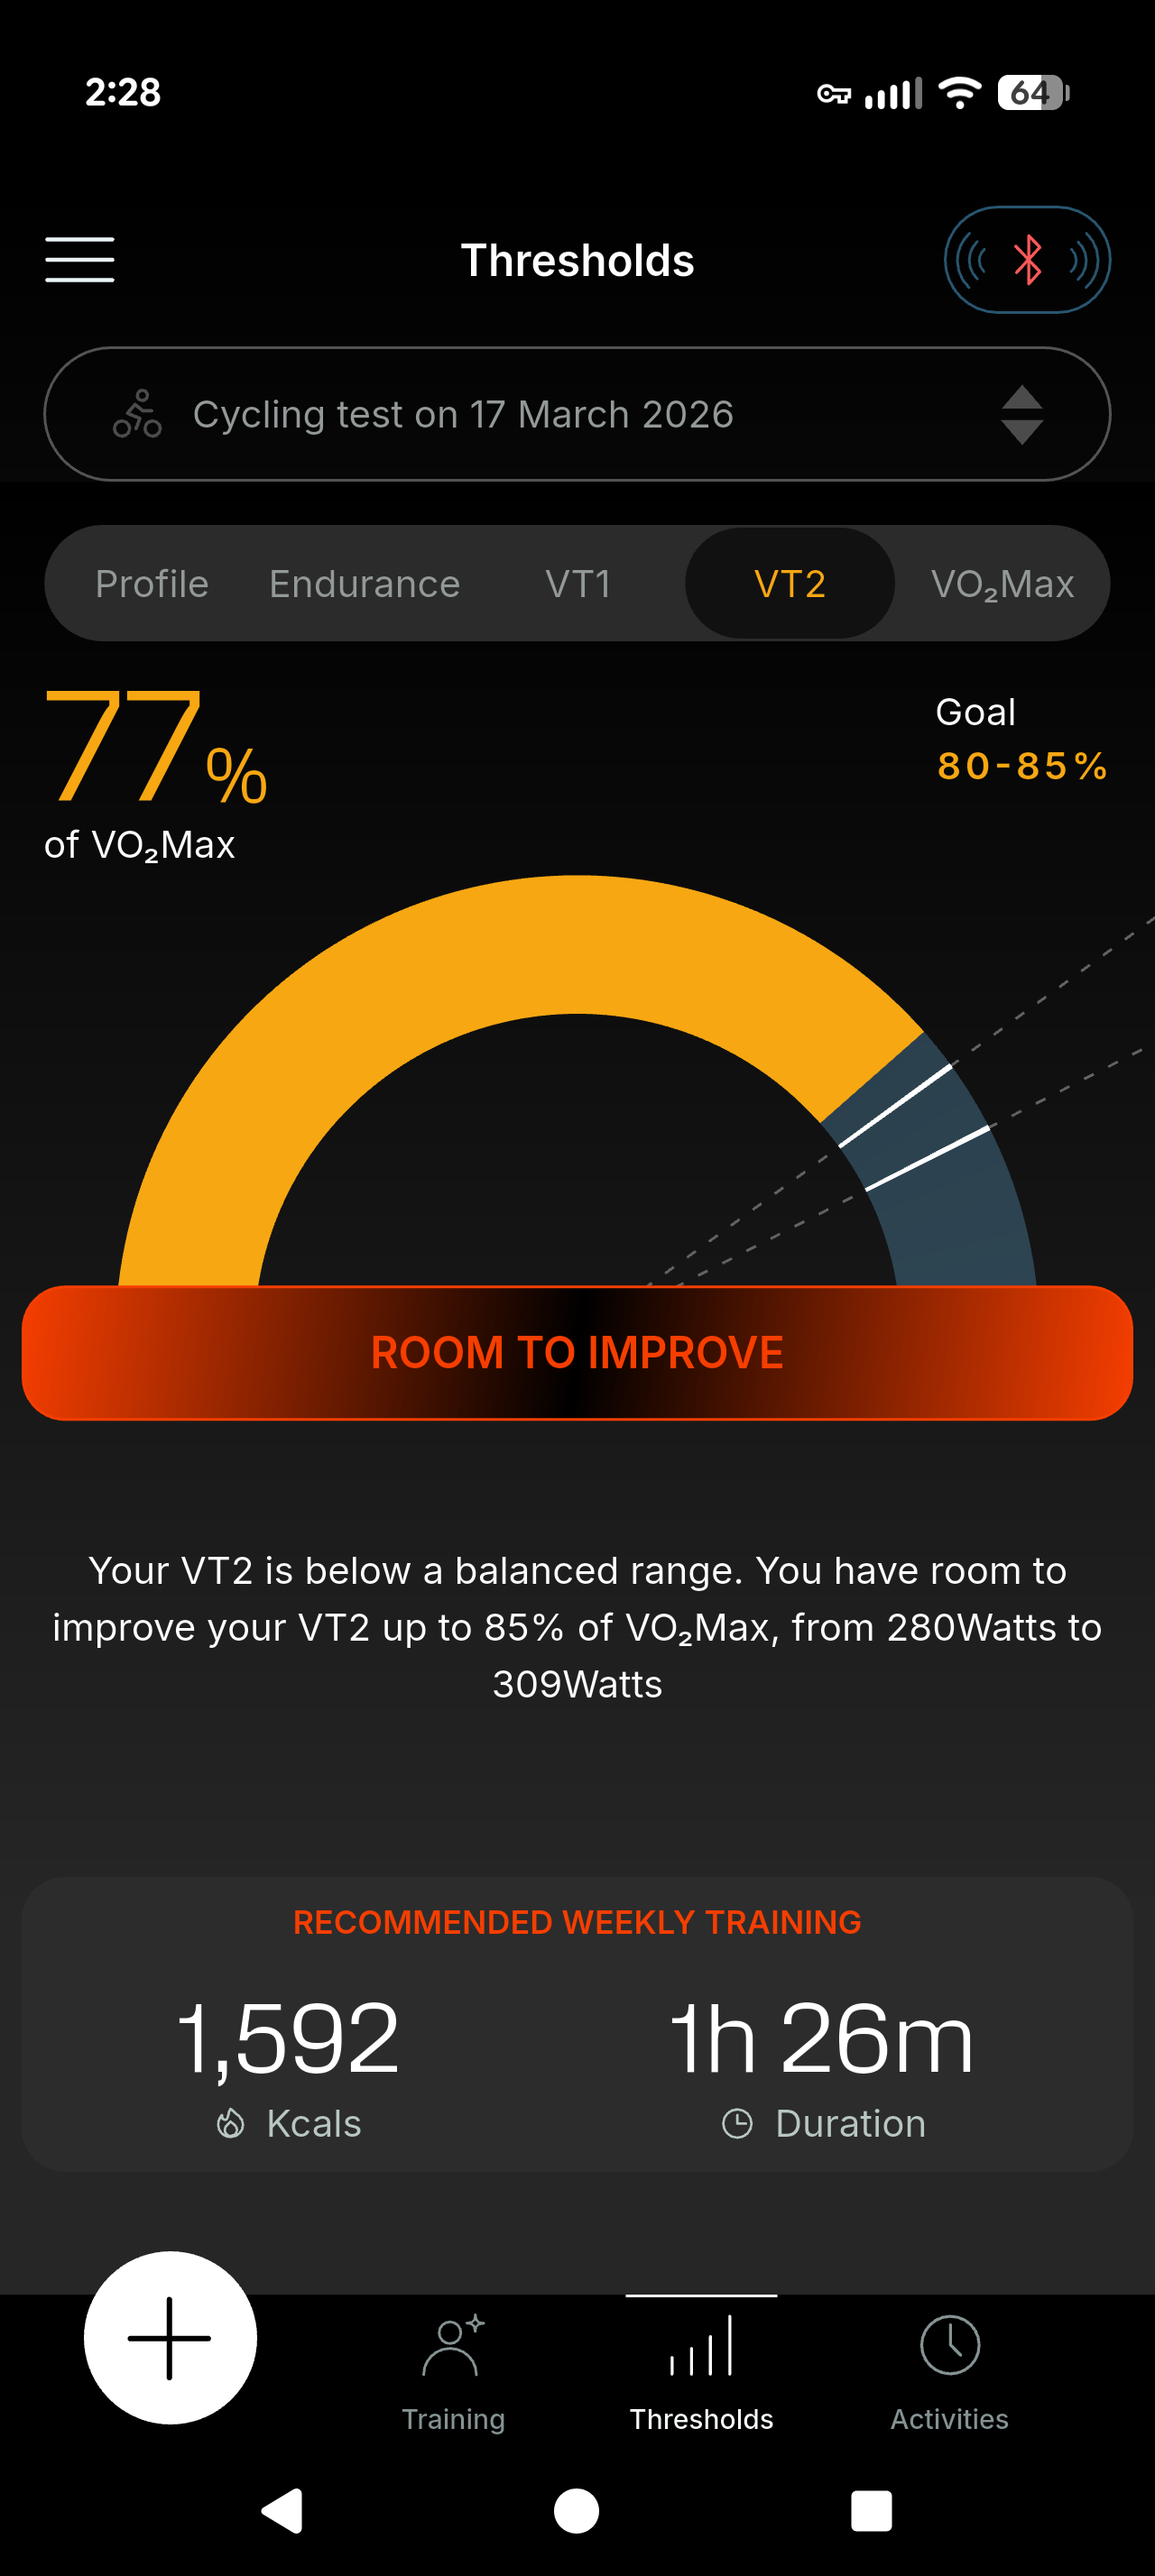
TW recommends I spend 1h 26m weekly in Z3:
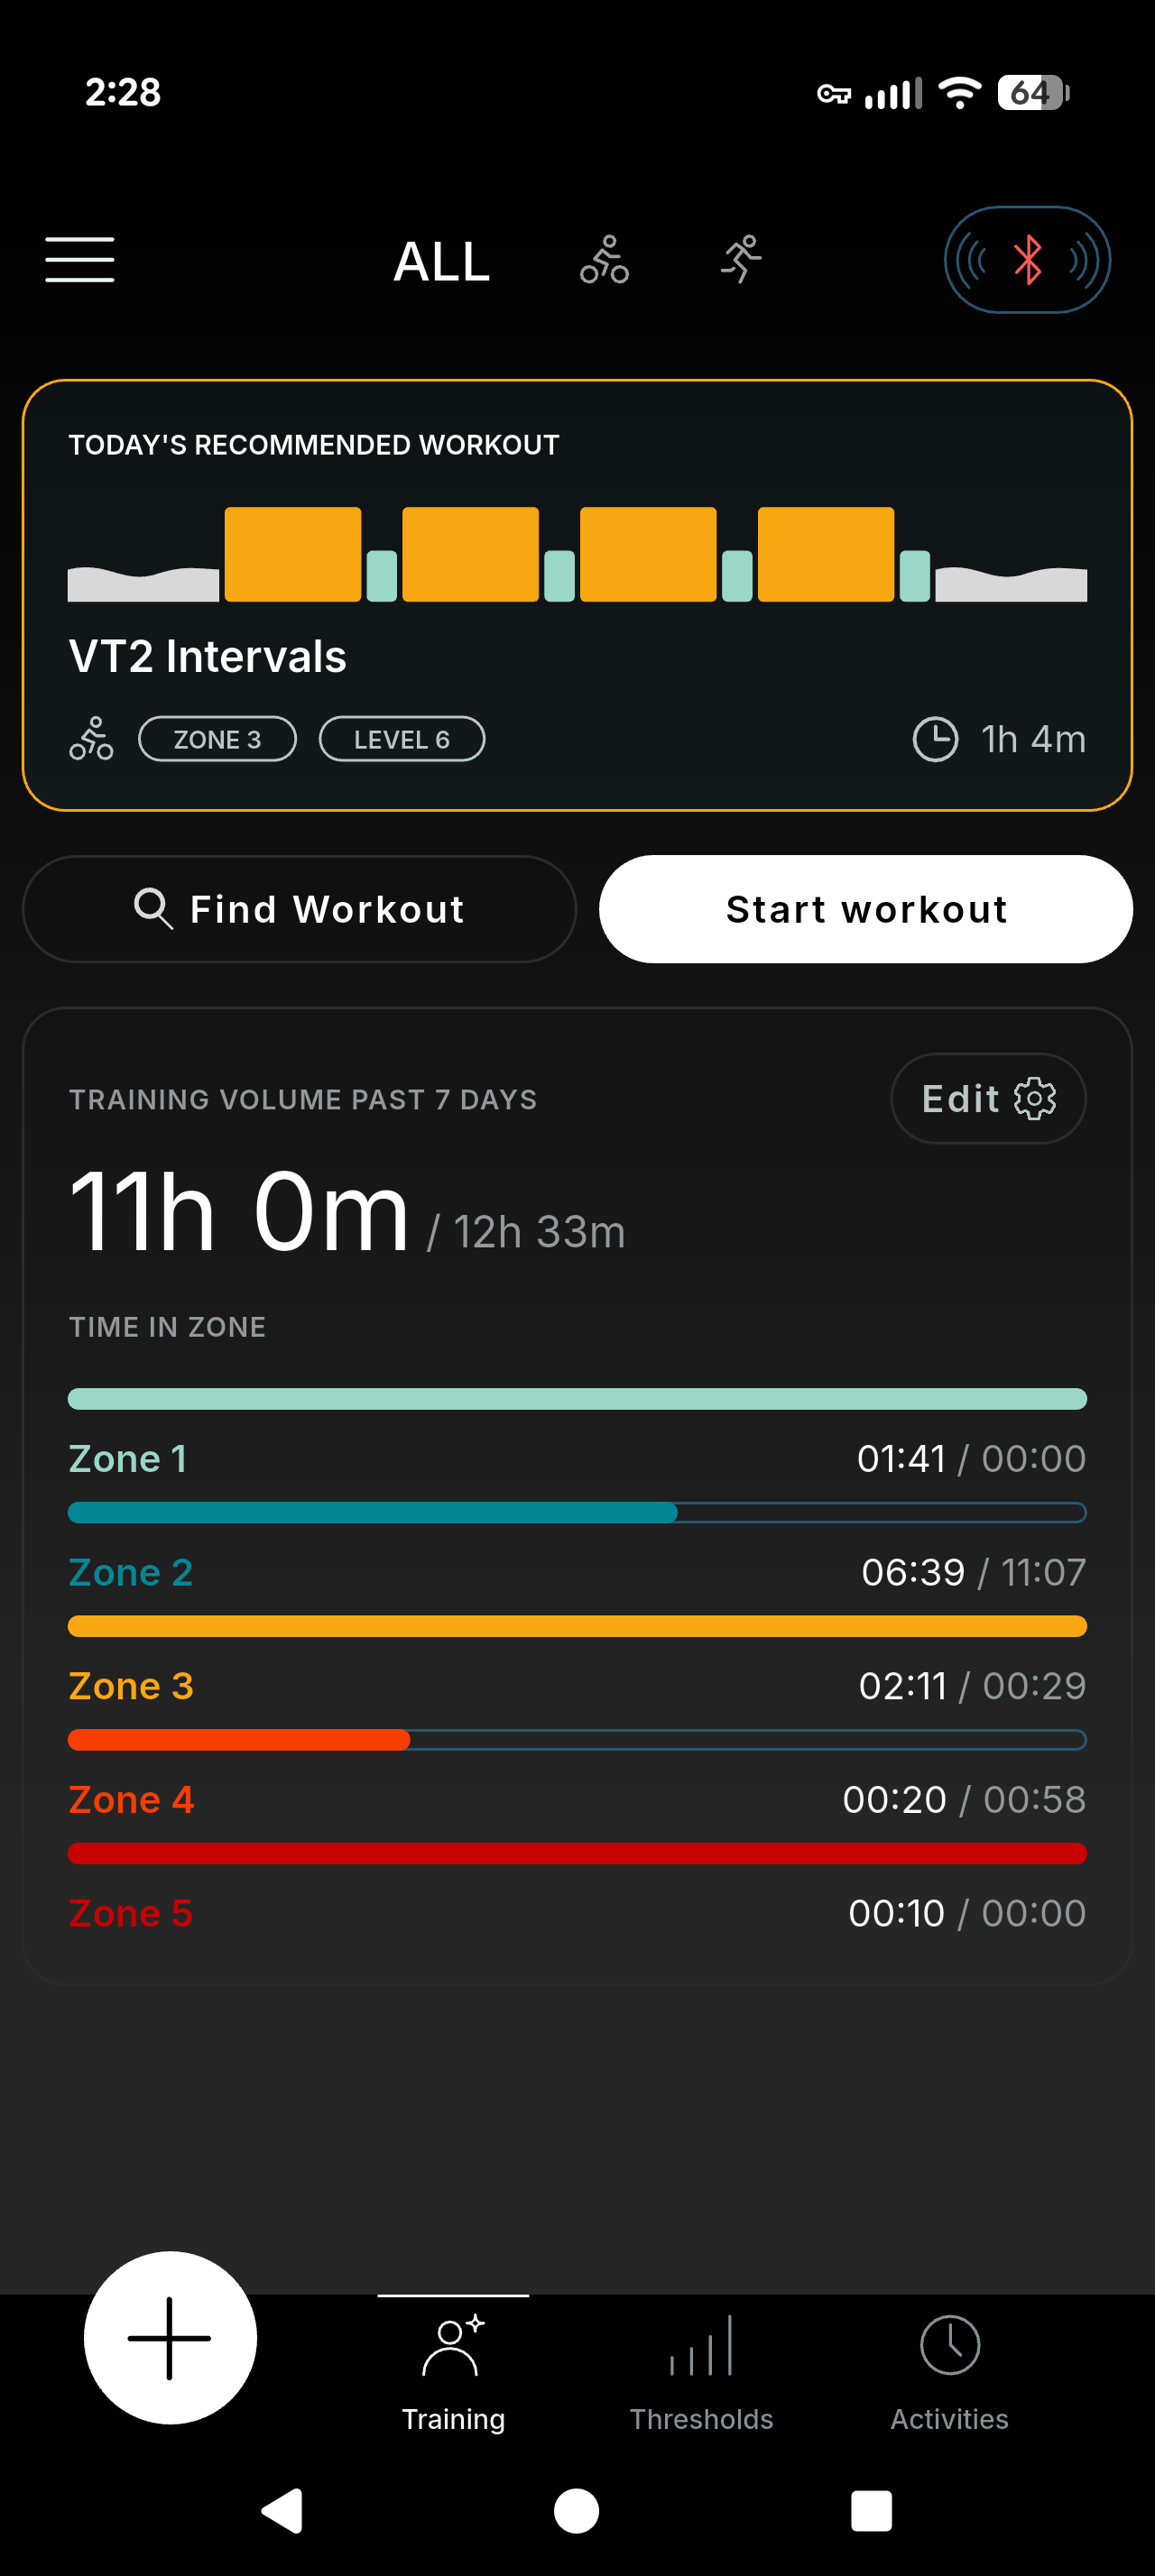
I almost always exceed the recommended Z3 time weekly yet it still suggested a VT2 intervals workout:
1 Like
I may be wrong in how I comment on Zone 3 training. I just don’t have that goal right now (maybe not yet).
I continue to explore the analytics features in the Tyme app and want to share an interesting observation.
Monday was a rest day and I felt perfect.
On Tuesday, I did a hard VO2max cycling workout. HRV, heart rate, and sleep quality dropped, as expected.
On Wednesday morning, I did an easy run, strictly in Zone 1 (1 hour), and in the evening I did a strength session.
On Thursday, I had a tempo cycling workout planned, but I woke up feeling unwell. HRV and resting heart rate were worse, I slept only 6.5 hours (normally 8, and the quality was poor), and I had nasal congestion. So I replaced the tempo session with an easy 1-hour ride.
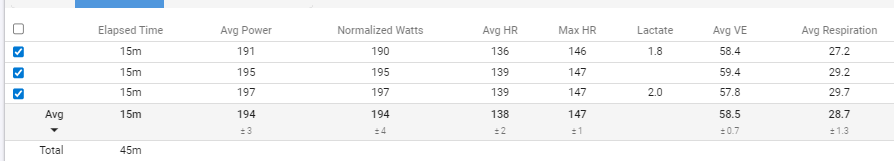
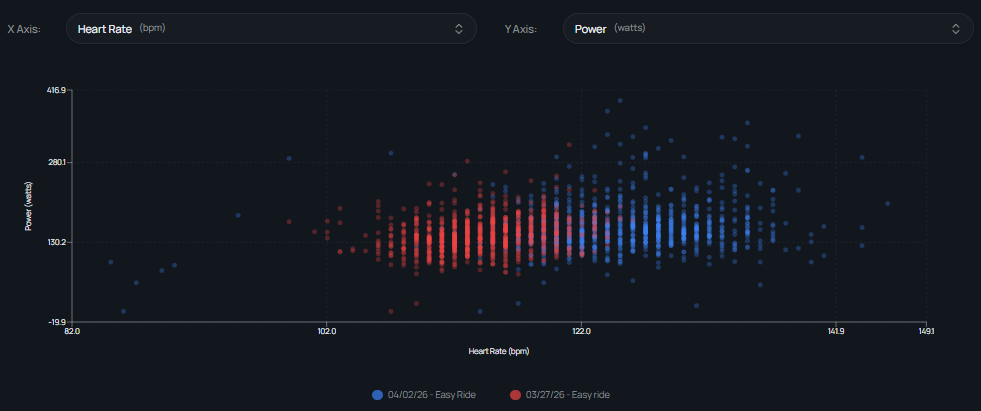
After that, I compared the ventilation data with a similar easy session I did last week.
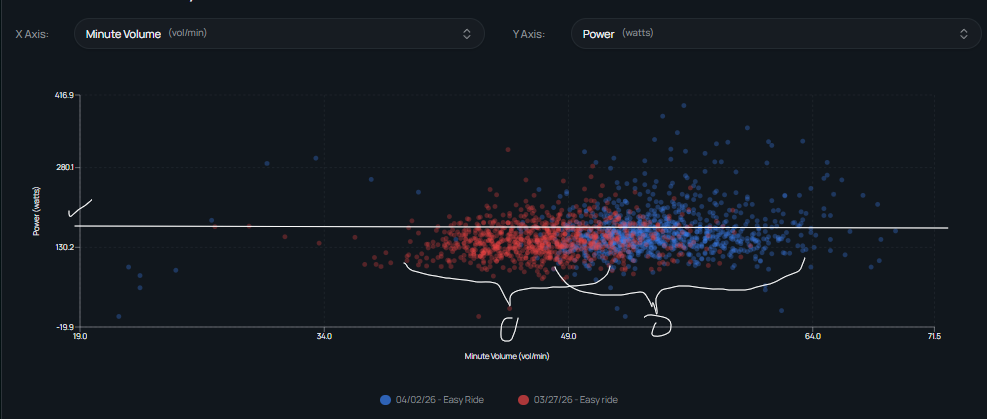
At a comparable power of about 160 watts, my ventilation
last week was around 40–53VE,
today it was around 47–62VE.
You can clearly see it visually. ~ +7-8VE
So it seems that feeling unwell increases ventilation.
Breathing rate shows more variability in both sessions. It is slightly shifted lower today, but not significantly.
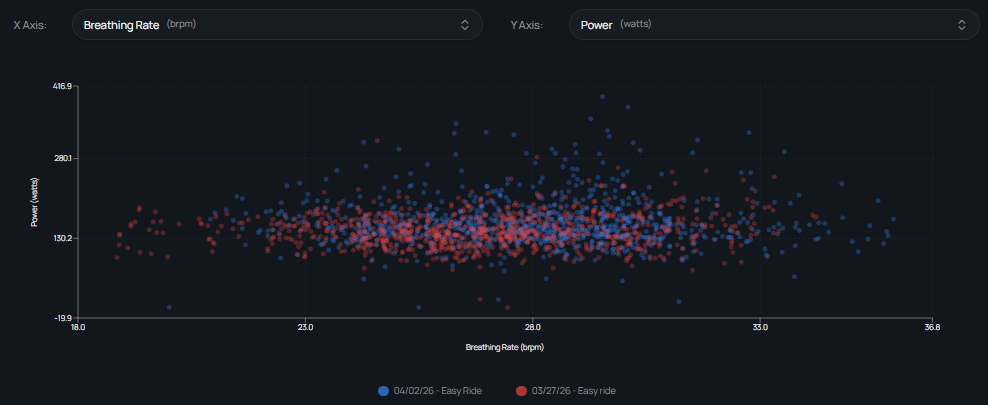
Heart rate also shows some shift. Even though both sessions were easy, heart rate stayed clearly within Zones 1–2.
Do you have any hypotheses or recommendations?
1 Like
Zone 3 does contribute to the aerobic base as it’s still part of the aerobic energy system. As always, it depends. While it does have more fatigue than Zone 2, and not as much as Zone 4/5, it can be useful as a training tool depending on the dose.
For someone who has limited time and can’t do that one long endurance activity in a week, a shorter workout at slightly higher intensity (Z3) is better than trying to do it in Z2 and expecting results.
Edit: referring to cycling, not other sports.
2 Likes
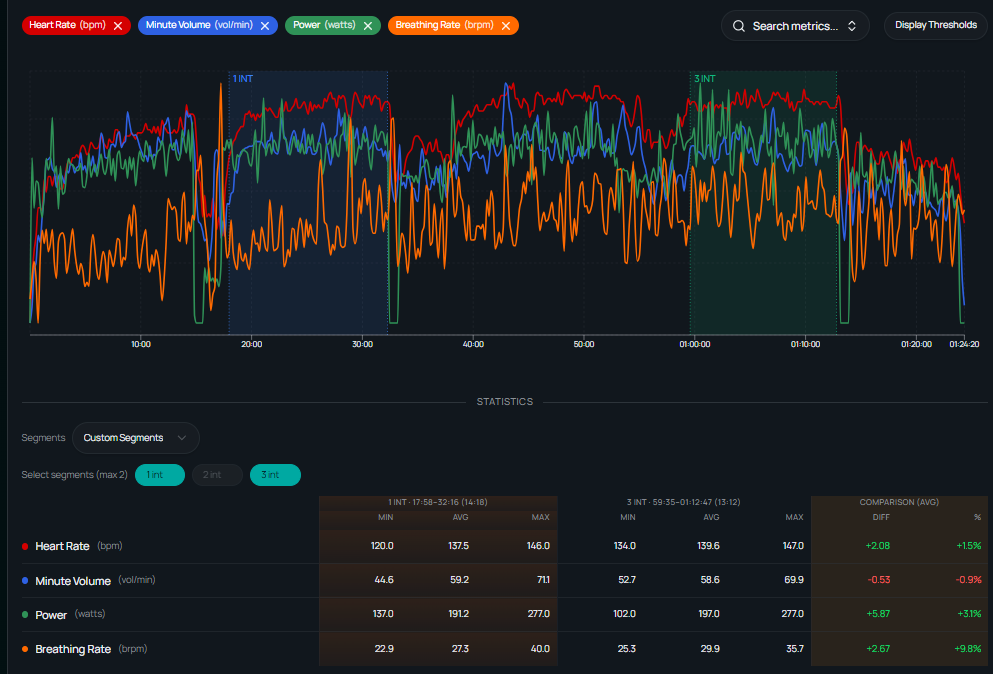
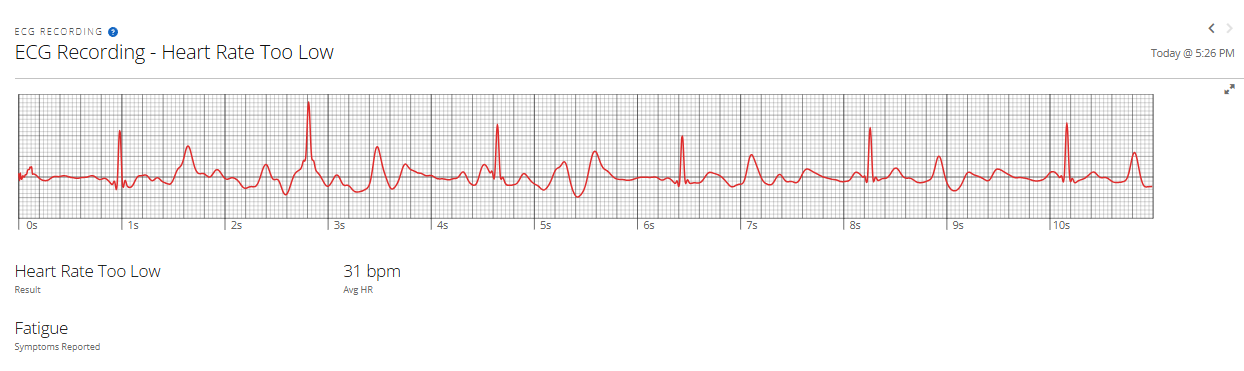
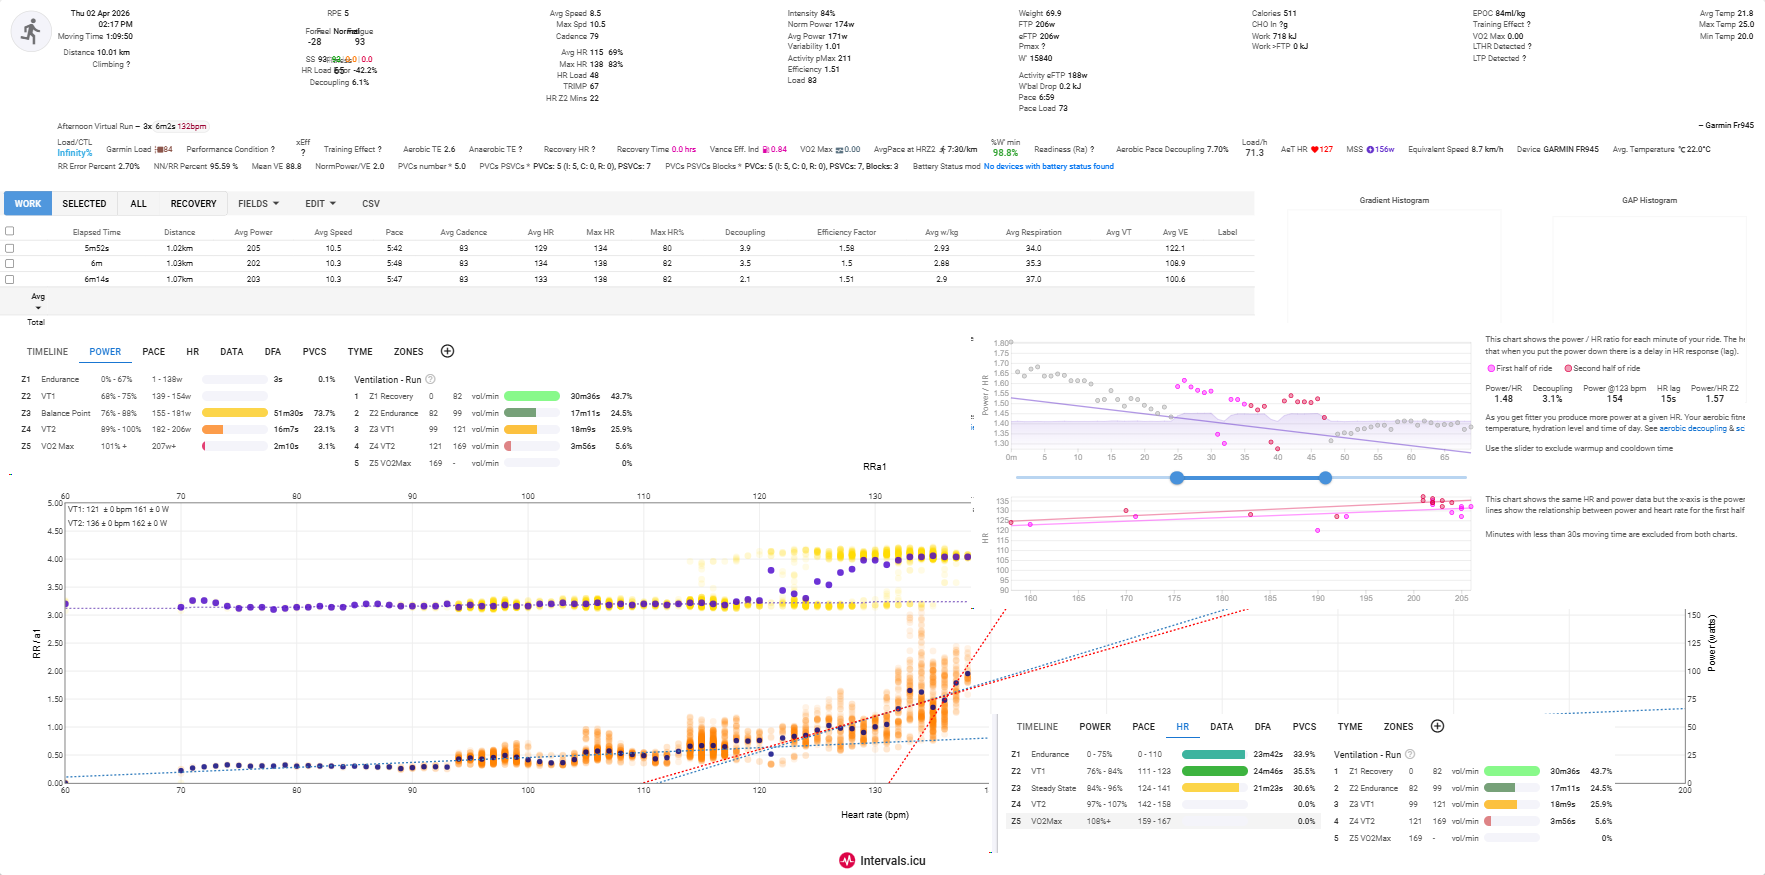
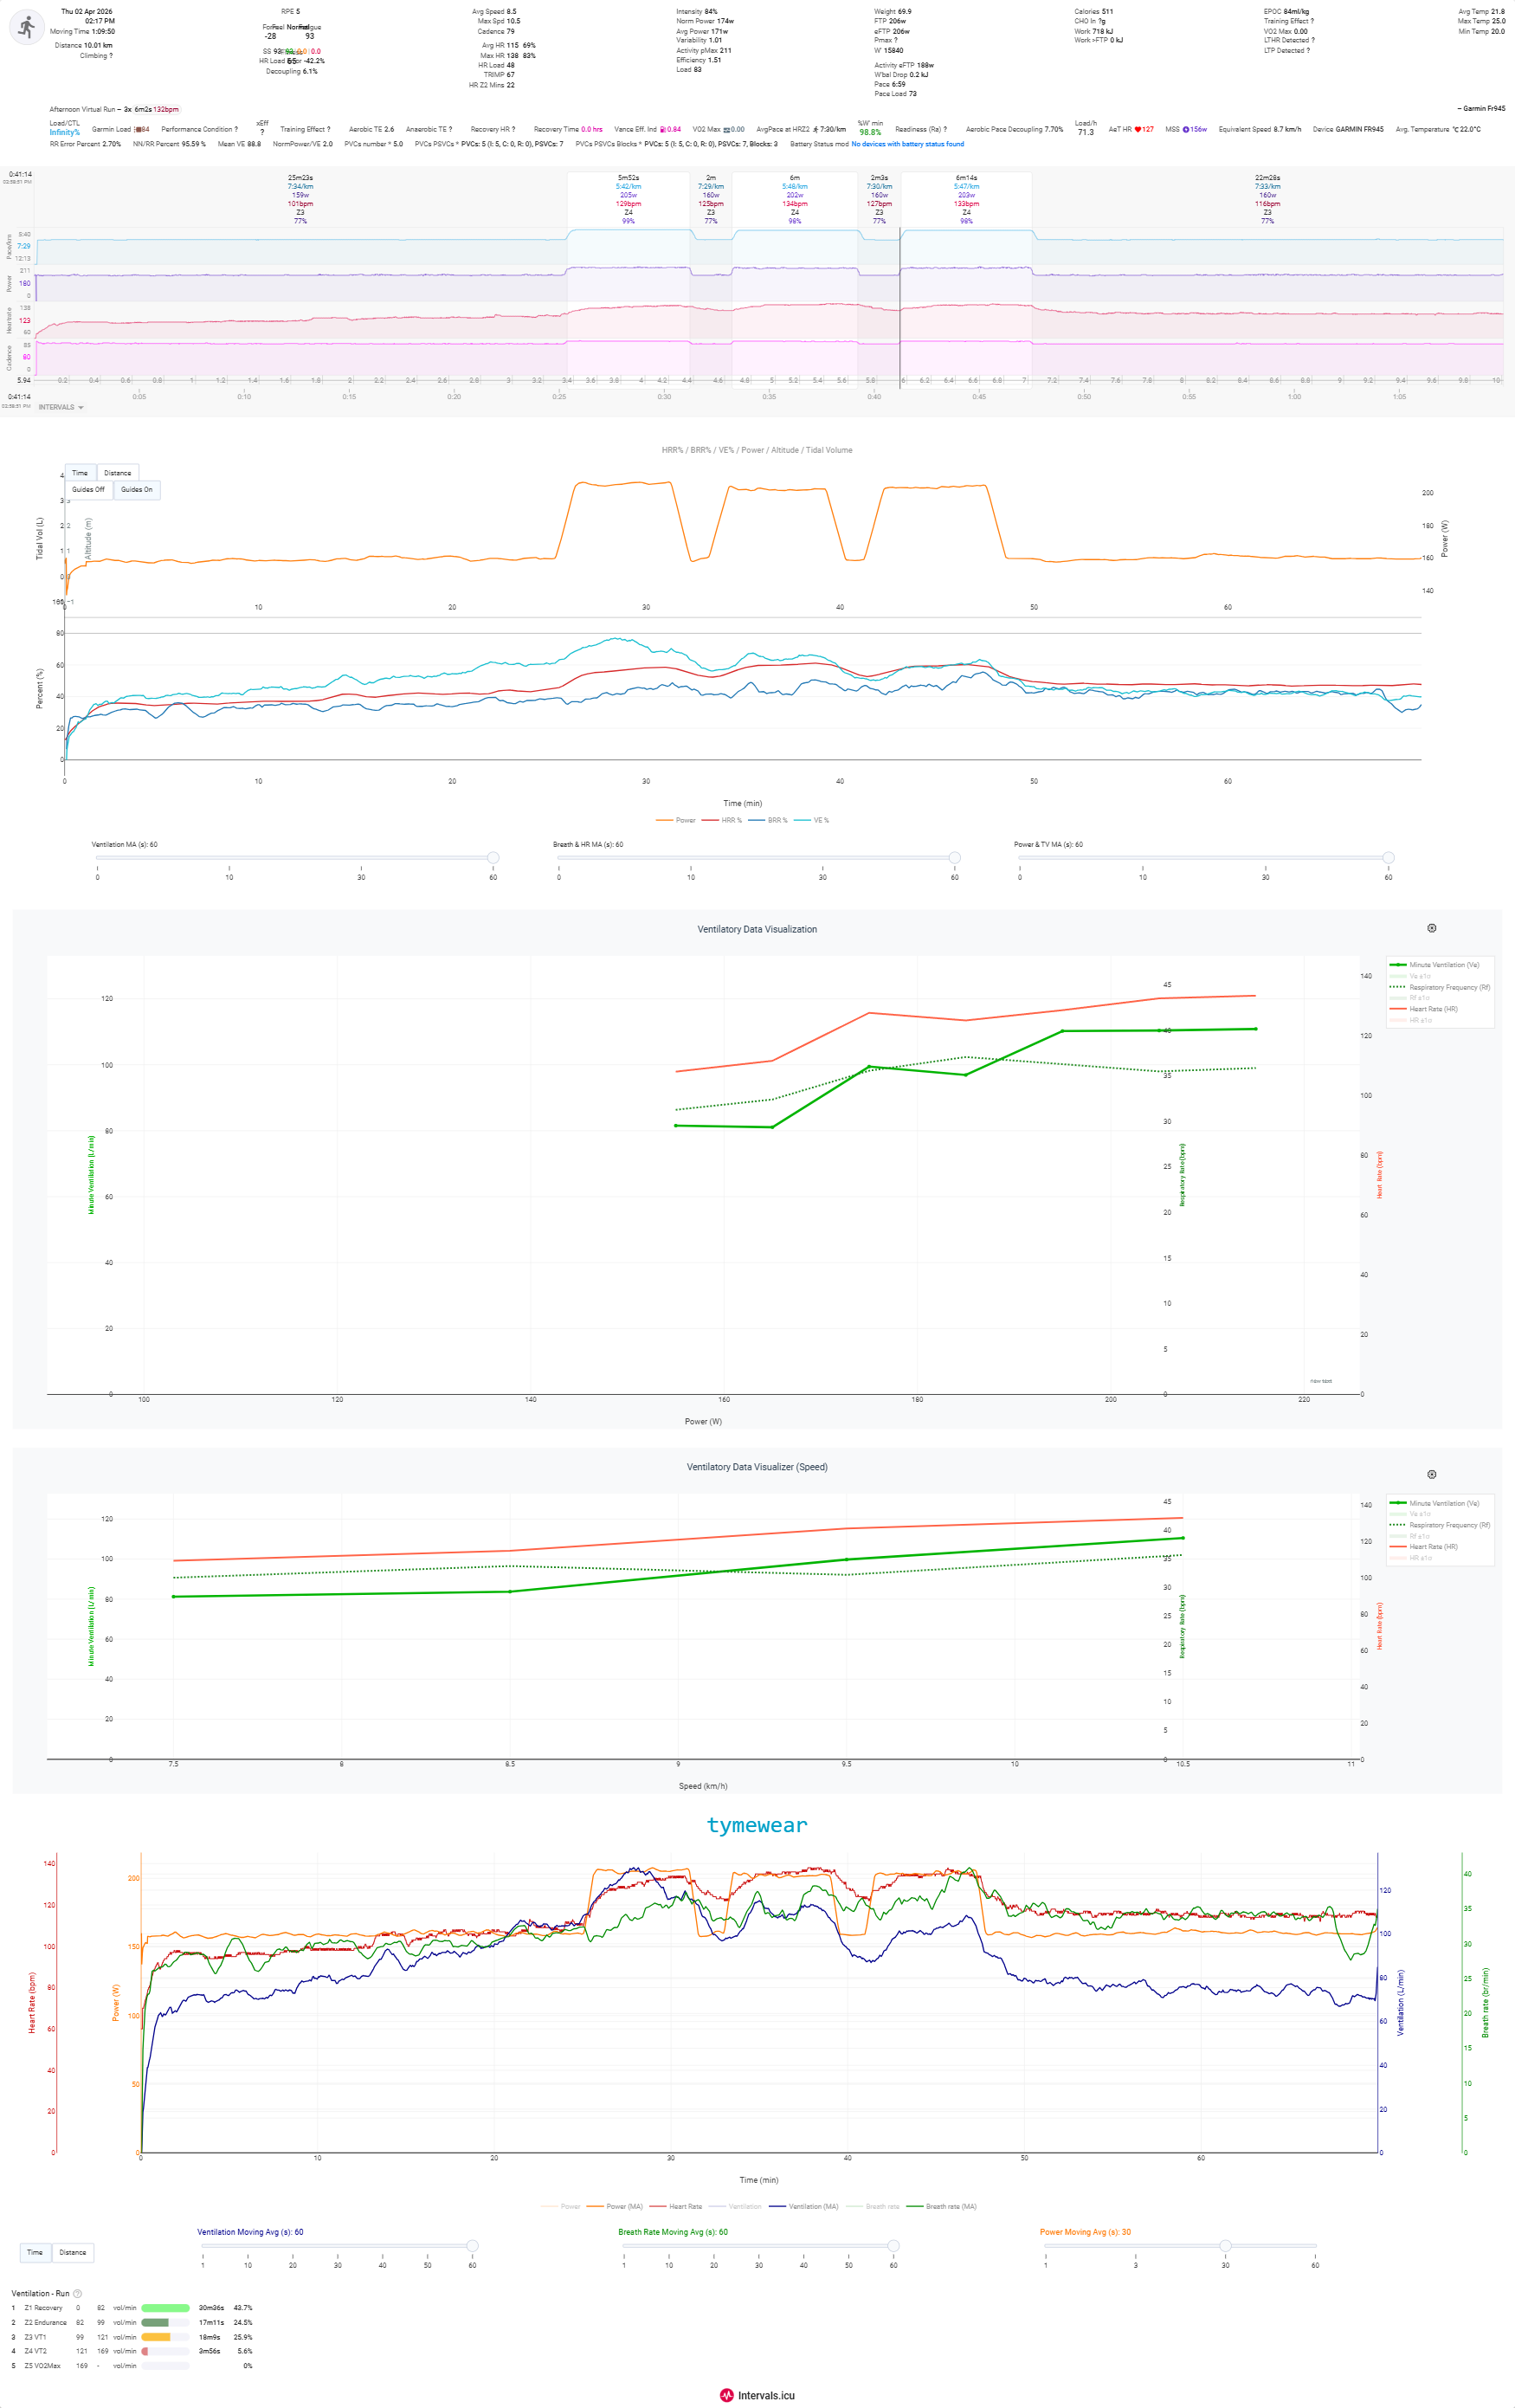
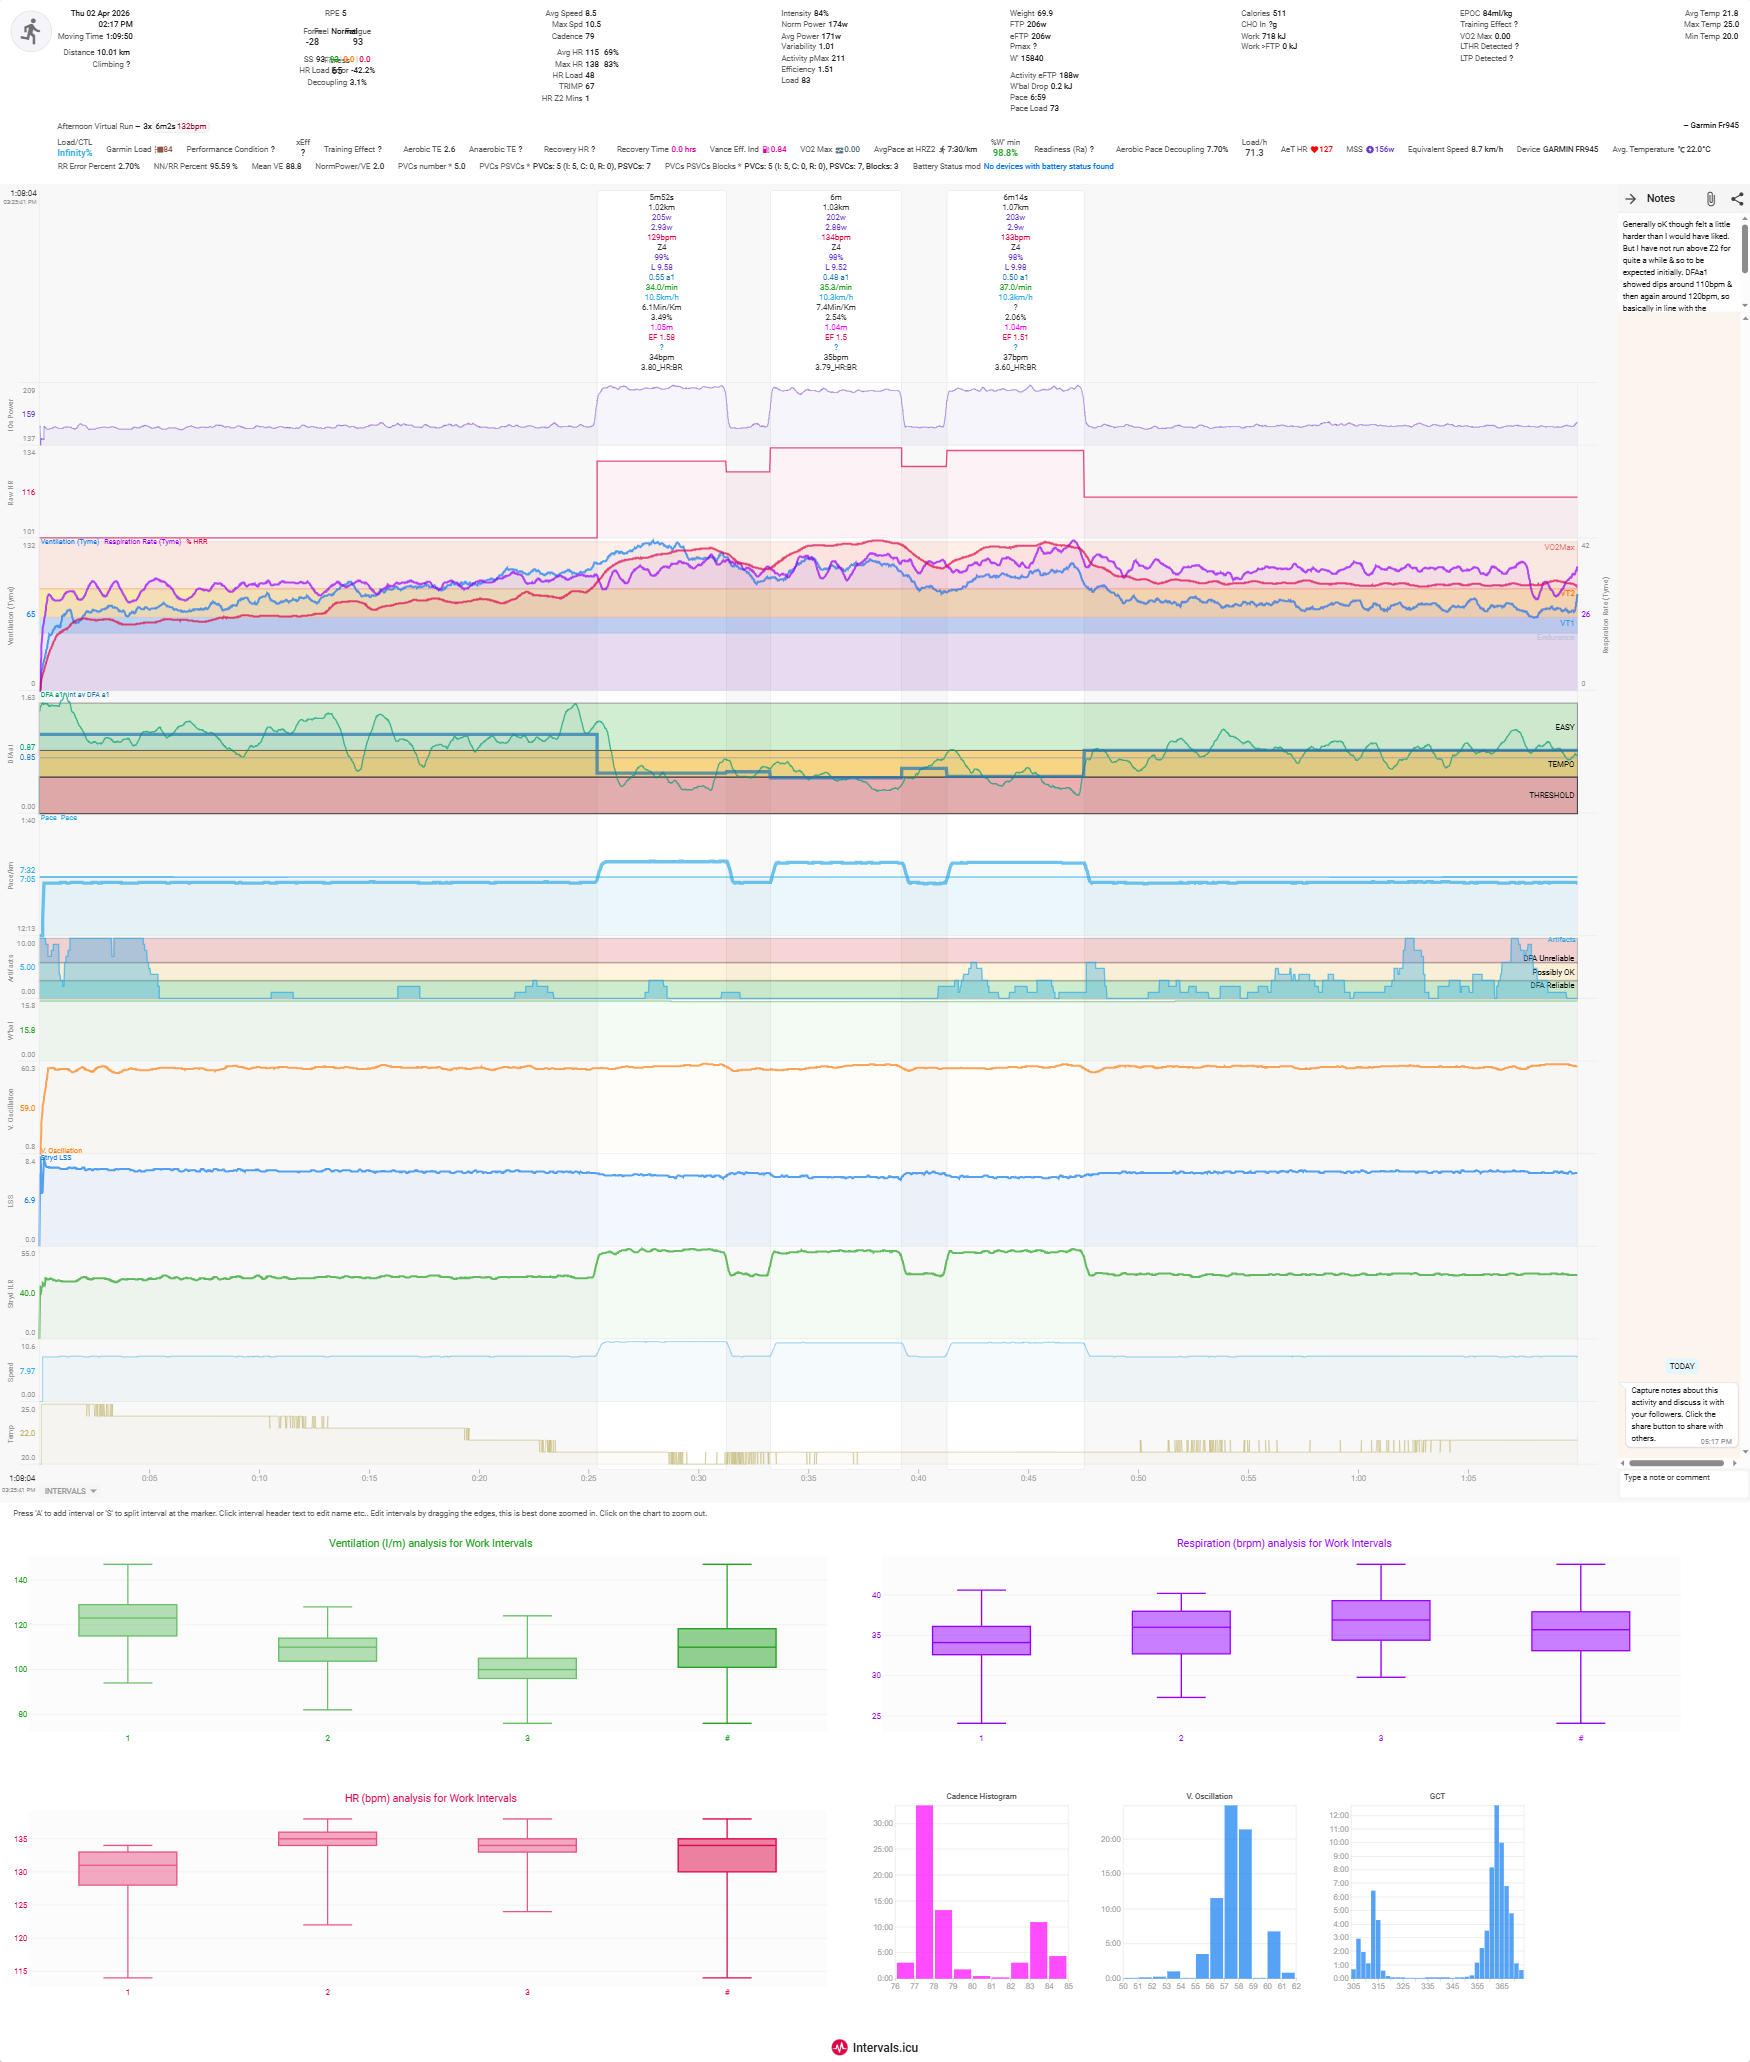
I did a tempo intervals run today with both RRa1 & Tymewear which might be of interest to people here. Looking at the Tymewear thresholds there is a correlation to my mind between the dips in the RRa1 & my Tyme thresholds which is good. Also with regard to whether Ventilation or BR is better for measuring fatigue, my data here suggests that BR is perhaps the better (for me anyway) as that continues to rise through the three intervals whereas the ventilation dips despite some fatigue setting in (3.1% decoupling over the three intervals (albeit a short time admittedly). Annoying PVCs after run but asymptomatic as usual & probably did not affect the run due to higher HR.
.
2 Likes
Hey everyone, I’ve been using the Tymewear VitalPro strap for 2 and a half weeks now and so far I like it. The threshold test (cycling) was pretty much aligned with the recent 20-minute all-in test I did, and the recommendations as well.
The only drawback though is that the VE reading seems too low when using my Garmin Edge 1040 (primarily outdoors, though I did one session with it indoors), compared to when I use the Tymewear iOS app to record the session, where the VE is in the expected range.
Has anyone else faced the same issue?
This is quite possible, since you did the test indoors on a trainer. Outdoors, the values can be different, but not significantly. The main difference usually comes from breathing rate. In my case, I don’t see any issue here. Based on RPE and ventilation data, they align quite well
I’ll add one more thought. It’s possible that the Tyme app smooths or approximates ventilation values (for example, filtering out artifacts like 2 out of 5 points), while Garmin records raw data. This idea comes from comparing time in intensity zones from the raw FIT file in Intervals versus what I see on the Tyme dashboard.
1 Like
How are you wearing vitalpro? Under or over bibs?