SmO2 and THb support on ride timeline chart

As produced by muscle oxygen sensors (e.g. Moxy Monitor). This only works with manually uploaded .fit files and .fit files from Garmin Connect. Strava does not return this data.

Click “Charts” to add the new traces:

If anyone has a .fit file with using 2 of these sensors please mail it to me so I can get that working.

1 Like

It would be nice to have the data, and we are a bunch who thought the measurement by now had been implemented in our handwatch.
With the current price level, I’ll be waiting a little longer, hoping Na and H2O levels to be included …

1 Like

You can now add a second pair of SmO2 and THb charts for a 2nd sensor. Also average SmO2 and THb are now available as interval fields (click “Fields”). You might need to re-analyze the activity (make a dummy edit to an interval).

2 Likes

Would it be possible to add an average SMO2 for intervals, and perhaps a slope value for the time series? I.e. I’d like to understand how my SMO2 is trending and where the average is for the interval. May be cool to see this for THb too…

Would actually be nice to be able to switch on a linear regression for a lot of the charts…

How do you use SMo2 info for training? Know any good articles?

1 Like

Both of those are already there for intervals. Click “Fields”:

Screen Shot 2021-02-13 at 13.55.52

Just getting started with the Moxy sensor, and being guided by a coach. It’s a lot of data, but I’m not sure what to do with it. I am still looking to understand what it fundamentally means when SMO2 trends change. Having an elementary understanding of the metabolic processes in cardio exercise, it seems intuitive that understanding O2 levels in the muscle could be helpful in training. Other than going through a bunch of the videos that Andri Feldmann has put up on his NIRSport Science YouTube channel, I haven’t seen much on the subject of training with a Moxy. Even on that channel, there is very little “how” to use the data that is shared—mostly what questions are answered.

I do research and performance assessments with Moxy and other NIRS devices, and even I find it difficult to explain how to use NIRS for training prescription. Although I would love to get stuck in on a discussion about how we might use NIRS practically in training. I think right now it’s more appropriately used to monitor changes over time, eg. SmO2 response to a standardized workout, warm-up, or assessment protocol.

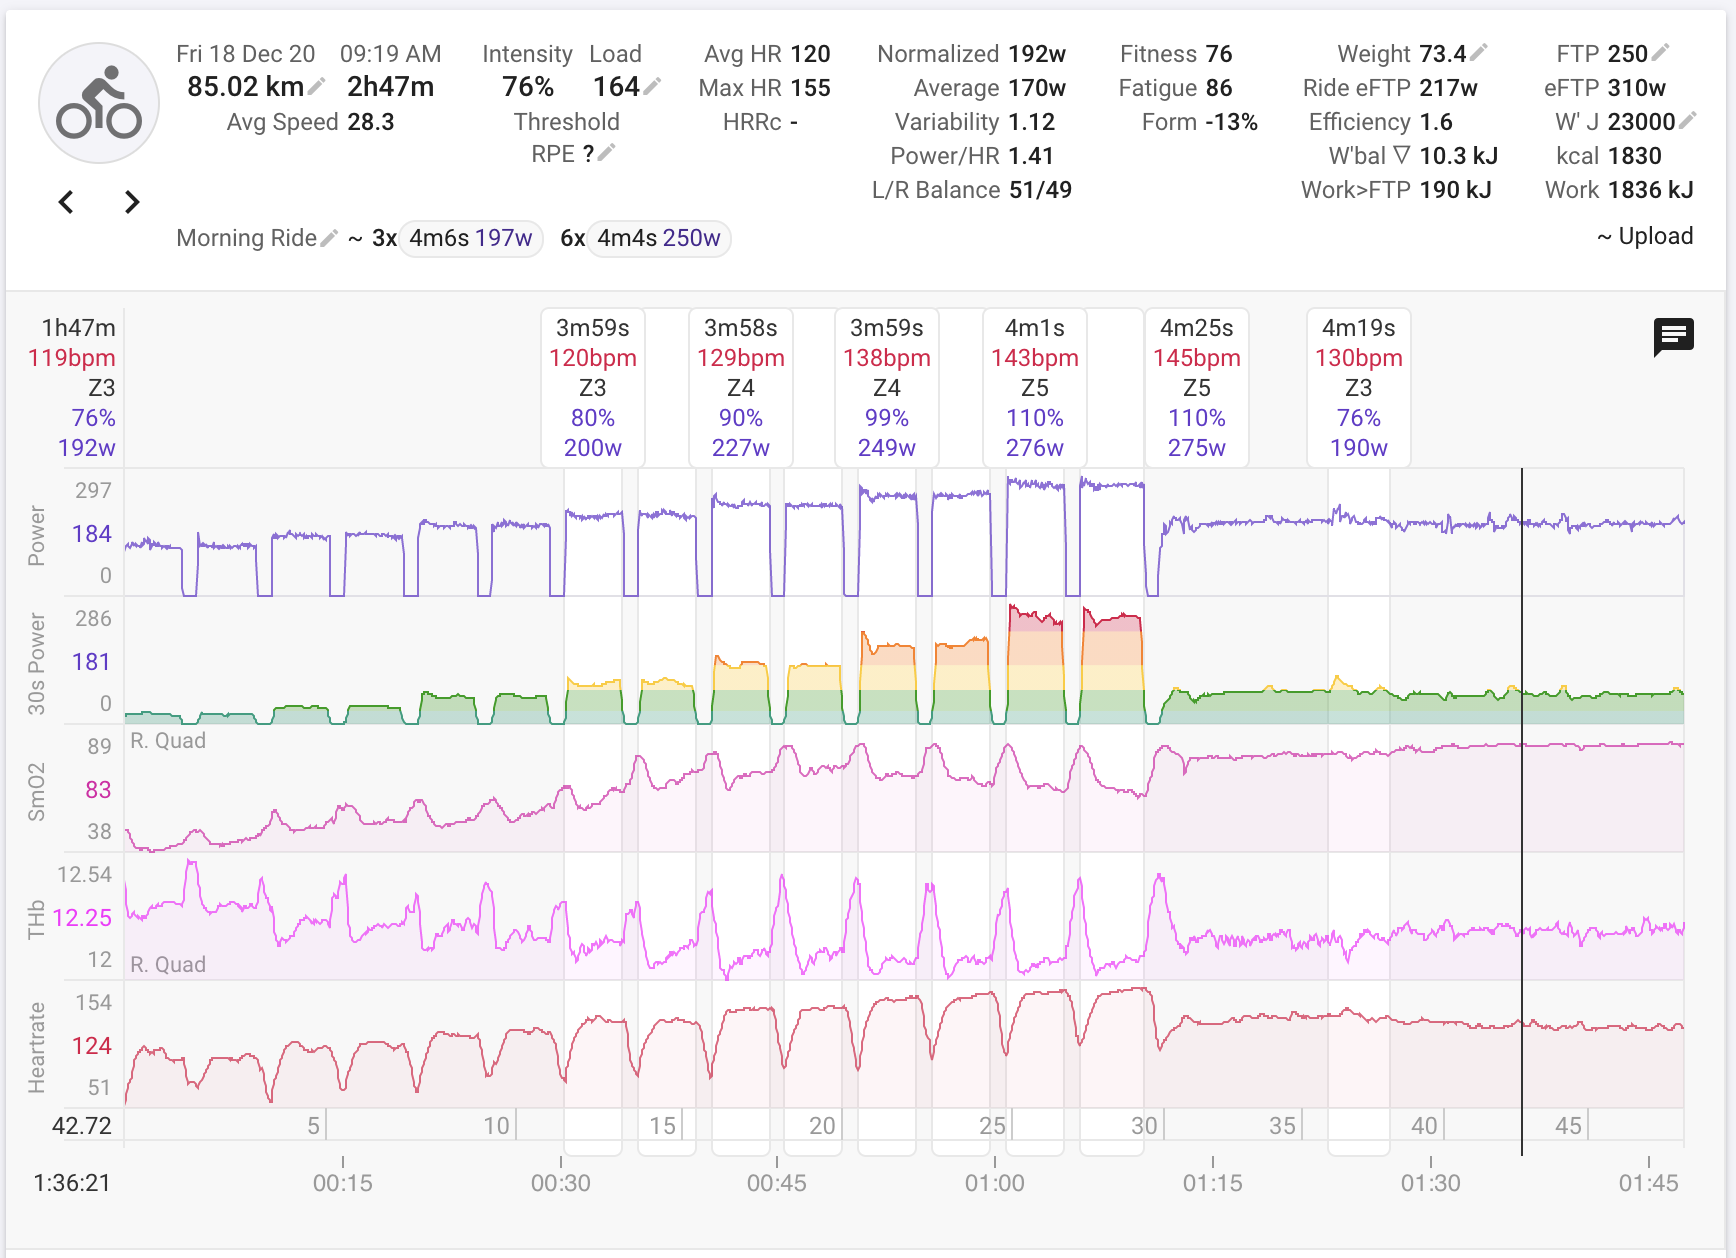
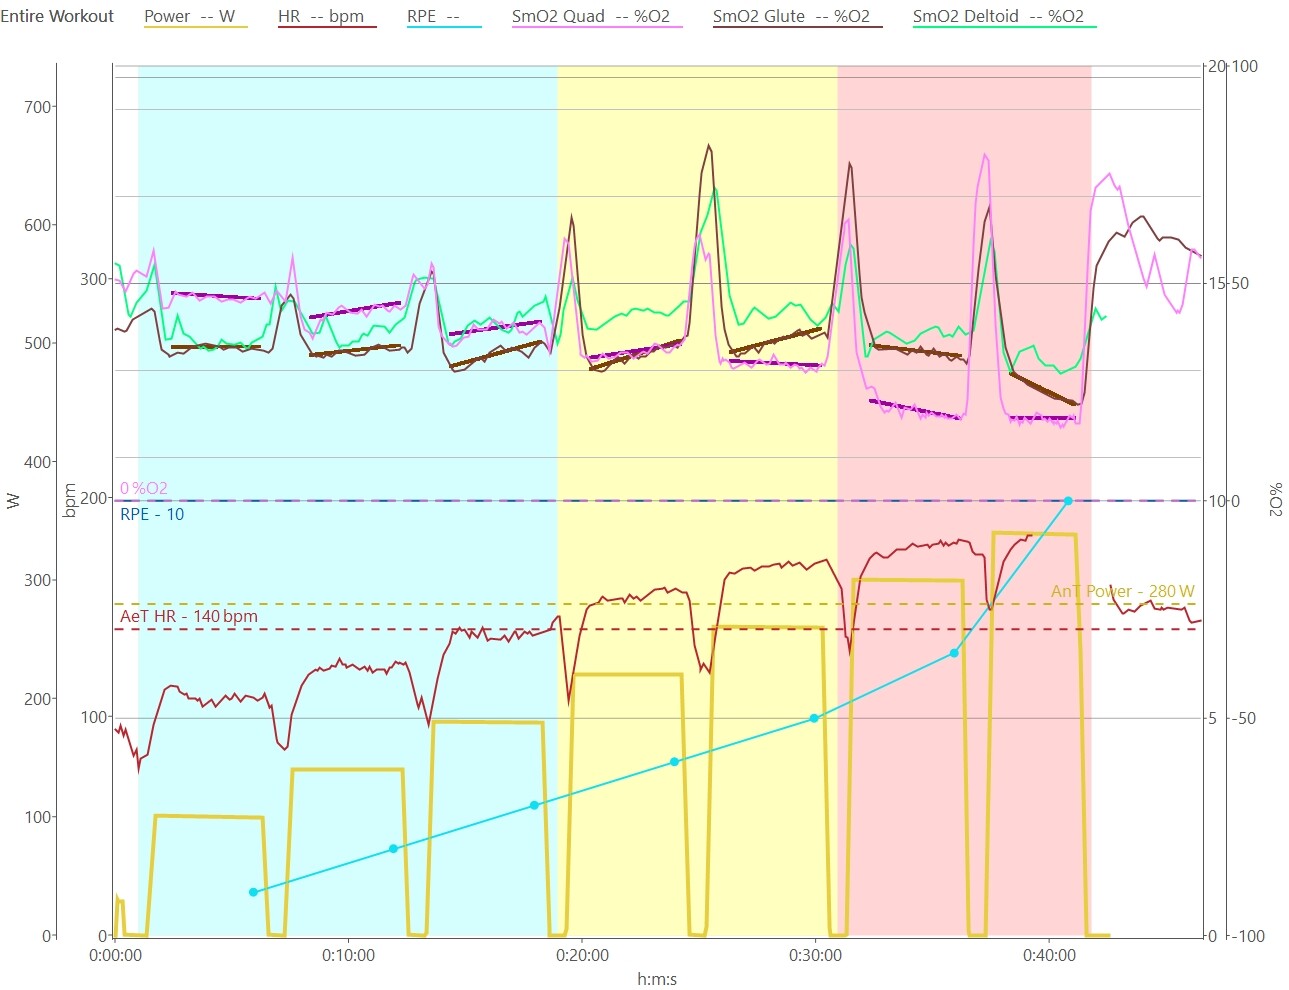
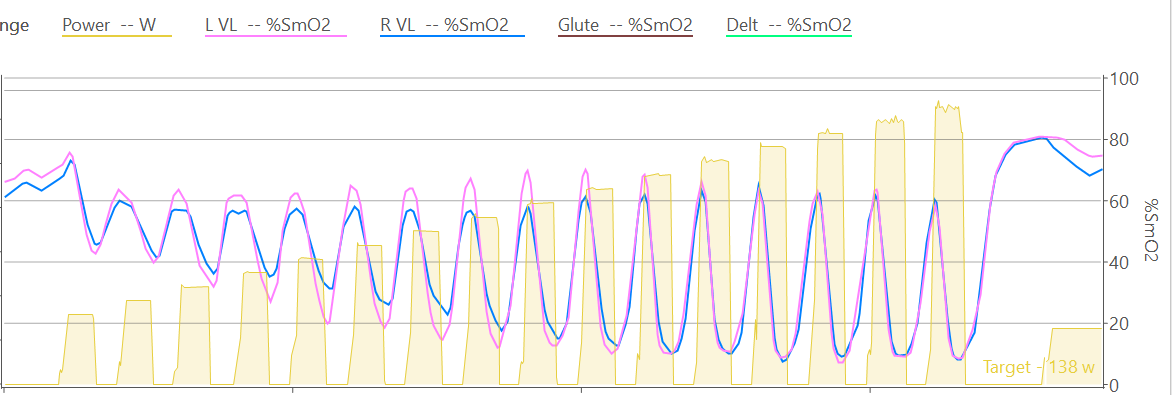
Moxy’s 5-1-5 assessment protocol is good. We use a modified 5-1 step-test and a slightly different way of analyzing & interpreting basically the same thing as the 5-1-5, for one of our performance assessments. But even then it’s more about using NIRS to inform power-target training prescription. Example display:

Phil Batterson has written about some good applicable ideas on his Blog over at the Moxy website:

Andri’s videos are also a great resource for the background of interpreting NIRS signals. But I agree, it’s difficult to implement in practice, in part because:

a) NIRS signals are a bit like HR, in that they represent the net relative change of a few different underlying processes and ‘fluxes’ going on behind the scenes, that are for our purposes un-measurable. eg. blood flow, hematocrit, O2 diffusion & perfusion, muscle O2 uptake (mVO2).

b) NIRS signals are very sensitive to individual factors, incl. sensor location, contact pressure, cadence, body position, adipose tissue, skin pigmentation, muscle typology, hydration, temperature, and others. So even interpreting your own signals is difficult when test-retest variability can hide a potentially meaningful change.

I’ve written some articles describing NIRS signals and speculating on mechanisms/underlying causes, but I haven’t written anything from an applied training perspective that I’m confident enough to publish. Maybe I’m overcomplicating things and we could take value from simply saying “IF SmO2 going up, THEN increase power, ELSEIF SmO2 going down, THEN decrease power”. But IMO there’s never less nuance :man_shrugging:

2 Likes

Cool research @SpareCycles

Is there decay in SmO2 recovery rates on repeated exertions or is that actually fairly constant? Are there threshold powers at which SmO2 recovery rates change?

Also, is that SmO2 line a rolling average or the real time data? Can you see every pedal stroke in the raw data even at lower intensities? I’d love to see the power data on those graphs to see how SmO2 lags (or doesn’t) lag effort.

In the chart I posted SmO2 is smoothed to 15-sec rolling avg.

Not with Moxy. It has a 0.5 Hz sampling rate (records every 2 sec) so it can’t capture intra-pedal stroke changes. Other sensors have sample rates of 50 Hz or higher and you can see that.

That’s actually something I’m exploring, how SmO2 reperfusion (SmO2/sec slope during recovery) behaves after exercise at different intensities, over different work/rest durations. Unfortunately I can’t get too into detail yet, but first thing to note is that SmO2 reoxygenation (the general magnitude of SmO2 recovery) can be a good marker of being warmed-up. It will increase to some extent from high intensity exercise due to increasing vasodilation. If it’s still increasing half way through your workout you probably want to warm-up for longer next time and possibly throw some higher intensity priming intervals in there.

Broad scope, reoxygenation during interval exercise depends on the intensity & duration of the work bout and the recovery bout (ie. the delta between) and a few other individual factors that determine your overall SmO2 profile. Obviously, harder/longer work bouts will require easier/longer recovery bouts for full reoxygenation. So it kinda depends on your interval programming and how much reoxygenation decay you want.

Another teaser of an assessment protocol we use to evaluate reperfusion rates:

1 Like

I’ve started training daily with a moxy monitor and the SMO2/tHb metrics in the charts and on intervals are very helpful for data review. Could we also get a min/max SMO2/tHb for the entire activity? These are visible on the charts within the activity, but it would be great to be able to sort activities by these metrics across time. The best place to see these would be on the Activities page as additional columns. These would be helpful for understanding overall calibration during an activity, as well as across training sessions.

You can easily create custom fields like this using a little Javascript. Click “Custom” under the activity timeline chart. I added min and max SmO2 fields. This is what the script looks like for max:

{
let smo2 = streams.get("smo2").data
let max = 0
for (let i = 0; i < smo2.length; i++) {
  let t = smo2[i]
  if (t > max) max = t
}
max > 0 ? max : null
}

You should be able to see those on your 24th March ride. You need to do Actions → Analyse to compute them for older activities. They can also be added as columns on the activity list view. When you are happy with them fill in a description and set visibility to “Public” so other people can use them.

You can create similar custom interval fields.

That worked a treat, thank you very much. Luckily I’m a web developer too, now off to create a bunch of other custom fields! I really appreciate your responsiveness.

1 Like

Is there also a way to create a custom plot in the chart area? I would be interested in plotting over time Thb*SmO2 as the two interact and the product may be more useful to see than both individual metrics. I can see that you can create custom charts, but the plots are limited to variables that cannot be customized.

1 Like

Not yet. I am planning to work on that in the next week (custom activity traces).

1 Like

Thanks for all of the prior responses. I’m noticing that smo2 data is no longer importing from Garmin connect starting on Sunday, not sure if others are experiencing the same thing. It shows in Garmin connect, but no longer in intervals.

I have fixed this. I refactored that code and there are a lot of test cases but something had to be missed. Tx for the report.

1 Like

You are awesome, thanks for fixing it so quickly! I’m in software too and totally understand. Intervals is so awesome!

1 Like

I no nothing about codes, so if you would be so kind to post the code for min value aswell?

Since this thread has come back towards the top, I guess I’d add that what would really be nice is trend data like you see in @SpareCycles post above. The way I do this in WKO is with the following formula.

workoutrange(begintime+duration/9,endtime,slrm(sathb))*100

What this does (I believe) is give me the slope for the last 90% of the activity or interval selected, since there’s almost always a drop initially.

1 Like