You can’t I don’t think as it’s a chart on a “standalone tab” which is why I had to copy that chart and paste it into another tab and resize it
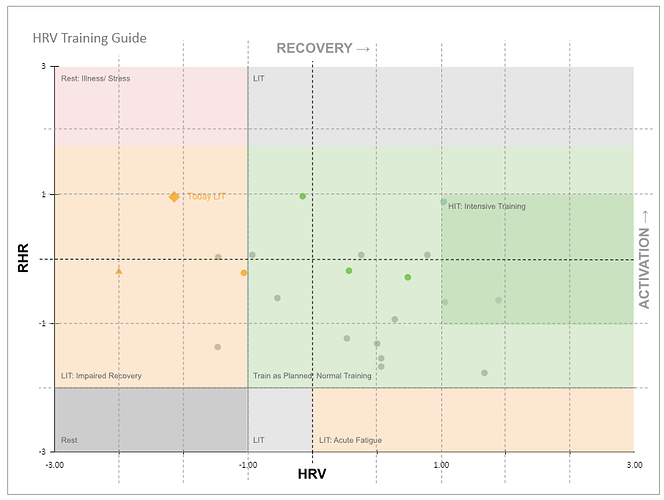
Do you mean like this?
I just edited the chart and deleted the line  don’t think I broke anything - I can update the shared file if this is better/ correct
Ah, tought you were also editing the file/chart.
The subdivisions on the horizontal axis are confusing to me. Vertically, you have 1 division per SD, horizontally it’s 3 divisions for 2SD… It leads to faulty interpretations and visually, the file seems wrong because it should be a square.
And I noticed yesterday that the file you uploaded is missing the formulae on the HRVcalc sheet. I copied them in on my local copy from the file shared by @Aindriu.
So I think it would be best if you upload the file with your changes and someone who is familiar with the calculation part, corrects that afterwards. If multiple people modify from different sources, it will be a mess to generalize everything.
One more remark/question: I can start the import macro from my desktop browser but how do I get to the macro when opening the file with Google sheets on my mobile? Can’t find the macro menu on mobile…
I had not noticed this…of course you are correct. Yep getting beyond my capability here - just wanted to add some graphics to help with it appearing like your original version. I can edit them to take out the graphical subdivisions but the original chart produced by @Aindriu will need to be updated to reflect the correct divisions if possible. Happy for my graphics to be included in the update and also happy to take my version down to not cause any confusion.
My opinion differs slightly from @Gerald.
The question you should be asking yourself is:
What will hurt my longer term progress more or less?
Taking it really easy on a day with that result, like a LIT session around 65%, and being nicely recovered the day after. Or doing the bursts anyway and risking a longer period of impaired recovery?
It off course also depends on where you are in your training phases. If you get close to a taper before an important event, it might be beneficial to do them anyway and take it as a ‘functional overreaching’ period.
But if you are in base/build, I would prefer taking it easy.
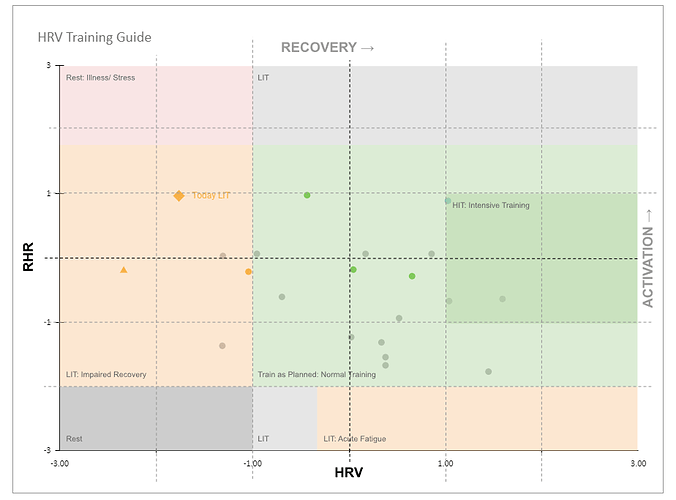
@MedTechCD is this any better?
I did some edits in the chart itself and seems to work…
If so I can re-upload and take down the old shared version and make sure the formula for the HRVcalc is there…
That looks much more familiar! Just the Acute fatigue zone bottom right isn’t entirely correct. Should start at the 0 horizontal.
And before I forget again: the workaround you used to get the background on the chart was a very clever move! 
Difference of opinion is good for debate.
I like the Common Morning Warning Indicators (Table 11.1 in Joe Friel’s Training Bible). I won’t post the table here, as I can’t find it on the interwebs and don’t have permission from him to share.
The image below is not from his book, but from the interwebs, and is missing two indicators:
- HRV score (low)
- TSB (below -30)
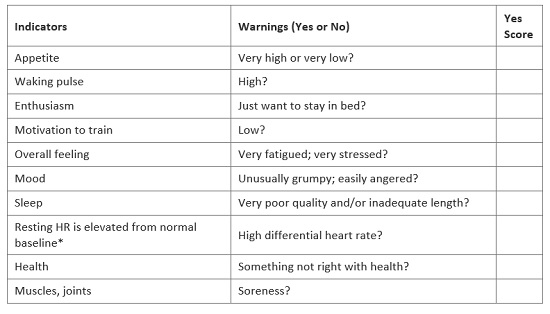
If you score 7 or more, then it’s a good indicator that you should rest rather than ride.
Score:
- 1 point for each YES in lines 1-5, as well as TSB (TrainingPeaks.com) below -30
- 2 points for lines 6-10, as well as a low HRV score
So I was discussing this topic with a mate today. I asked the question if we could “define an LIT session with a number”
First thing he said was once you go into anything close to a Threshold HR then you cannot call that session a LIT session. Even one 10s sprint on the middle of 30 minutes recovery ride means it can no longer be called LIT.
He settled on this - Any session up to 90 minutes long where your HR doesn’t exceed LT1 could be an LIT session…
But I got to thinking after our conversation that this isn’t necessarily true either. It depends on how fit you are or at what point in the season it is. 90 minutes at upper Z2 (in 5 zone model) could be a hard enough ride if you were just back training or recovering from a short illness etc etc.
So I ended up with my own definition that would suit most, if not all, cases. Any Z1 to low Z2 session (5 zone model) that doesn’t exceed 60 minutes could probably be defined as LIT.
This is a great table/questionnaire and something I will definitely use in future.
Although - waking HR and resting pulse? Are these not pretty much one and the same?
And is it a yes and a point for high appetite or low appetite or either? Only zero for ‘normal’ appetite?
Jan Olbrecht PhD, in his book “The Science of Winning”, was very clear that once an athlete enters the yellow or red there are several stress responses that are turned on; at that point, the entire session must be classified as hard, not aerobic, base building.
Recommended podcast,
-
The appetite is either very high or very low, so it’s the extremes that score a yes, compared to normal.
-
I see the Resting HR is incomplete on the table/website I posted, but it does refer to a high differential. That high differential is between Resting HR and Standing HR.
Regular scores below 7 would indicate training is not hard enough, and likewise, regular scores over 7 could be a sign of overtraining.
I’ve morphed from being an early bird (lark) to a late night owl, so I’ll always score Yes for the Enthusiasm question. However, as I train mostly in the afternoon, I have plenty enthusiasm leading into the session, compared to the morning.
edit:
1 tip: score this first before you see your HRV settings, so your subjective scores aren’t influenced by the HRV summary. Once you get the HRV score, you can add 2 if it’s low.
Makes infinite sense to mark subjective scores before knowing your HRV. Good tip
.
Likewise, I always like to scan my system subjectively—RPE, breathing, estimated HR, overall sense, etc.—before looking at any objective data on any device. I’m usually spot on, and in the case that I’m not I then start asking questions about why the subjective and objective aren’t aligned. I do this self-enquiry throughout the day and during workout sessions.
They are actually not missing in this modified version. This is an improved (adapted) version. You should not score both actions and outcomes because that will penalize the score twice for the same reason…
A low HRV and TSB are the outcomes of too much and too hard or illness, but the other parameters are already taking that into account. So if you leave those two in, you mix up subjective and measured and you end up doubling the negative.
Makes sense?
My idea on a low intensity session is pretty basic but served me well. It’s a session that you can (almost) fully recover from in less then 24hr.
Then you’re ready for the next building session.
I don’t agree on the 10s sprint thing. These short sprints are not very taxing on the aerobic system and induce very little fatigue. On the condition that you do a limited number of them and preferably at the end of an endurance session. Don’t mix them in the middle of your endurance session because you disrupt the goal of that LIT session by firing up your carbo system. It will take up to 20 min before you return to your fat burning system.
OTOH, we have to think about more than just the energy system being used. Sprints are taxing on other systems and tissues.
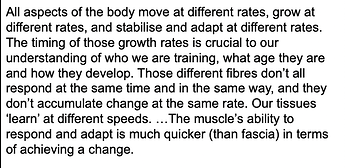
I’m not sure we appreciate this enough in athletics, 16. Things Take Time - The Joanne Avison Podcast | Podcast on Spotify
Just a note on the fat burning system.
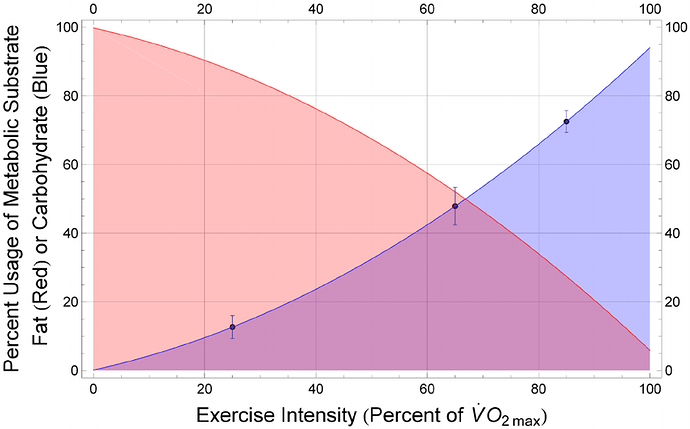
It’s not a stand-alone system (aerobic) that works independently of the other systems (Glycolytic and ATP-CP). We’re using more than one energy system at the same time, but it’s advised to focus more on one than the other, hence not mixing intensities during a workout, unless it’s high intensity and the recovery in between is required to recharge before going again. So even if we’re in a low intensity zone and training the aerobic system, we will still burn some carbs.
The graph below explains how the ratio between the two changes as the intensity increases.
I’ve seen the Friel table 11.1
One of the questions is Lying-Standing HR comparison - High differential Y/N??
What defines a high differential?
You need to get a baseline, for both lying and standing HR. Once you have this, then you can track the days when the differential is higher than normal.
It’s not an absolute value, as your resting HR will never be the same every morning. Likewise the standing HR will also be variable between two values.
How would you track it?
Possibly the average of the two value, for both standing and lying, and then the differential between the two. If you have something that is greater than average, then look for the two values independently.
At the end of the day, more data doesn’t mean you have all the answers, it just means you have the option to look at trends and decide how you “feel”.
