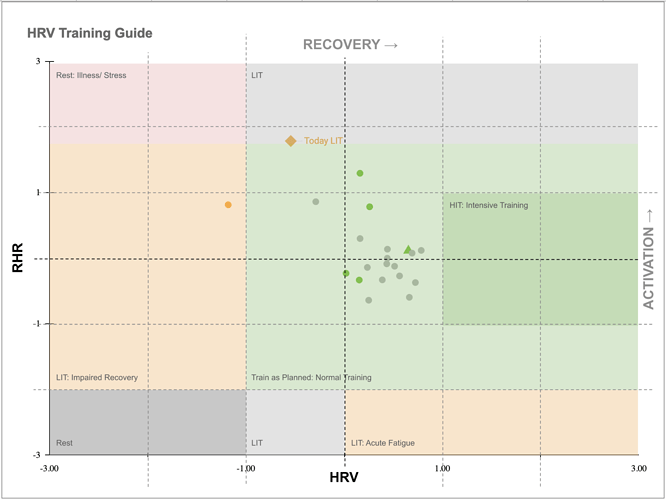
Hi, I’m new to codes… I’d like to use the google sheet I downloaded from excel but when I enter my data (about 35 days: date, RHR and HRV) I don’t have any points showing on the graph. What am I doing wrong? thanks all
Is it the Google sheets file you’re having issue with or the Excel file?
I don’t understand this bit - I’d like to use the google sheet I downloaded from excel
I don’t use the Google sheets version at all but might be able to assist if it’s the excel sheet you’re having issue with
Désolé, j’ai fait une erreur dans ma phrase, j’ai téléchargé le fichier Excel à partir de votre feuille Google (Intervals_API_Tools_Office365_v1.5). J’ai un problème avec les points qui ne s’affichent pas dans mon fichier excel. Merci
Ah. I understand now. You downloaded the Excel from from Google Drive?
What is the issue exactly with the excel sheet? I can try to help. My French is very limited though.
You shouldn’t have to enter data on the excel sheet. It should automatically refresh. I will post screenshots detailing what to do
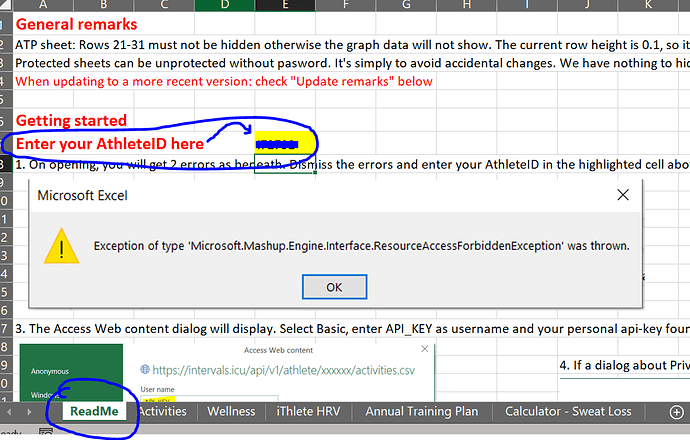
Enter AthleteID in ‘ReadMe’ sheet
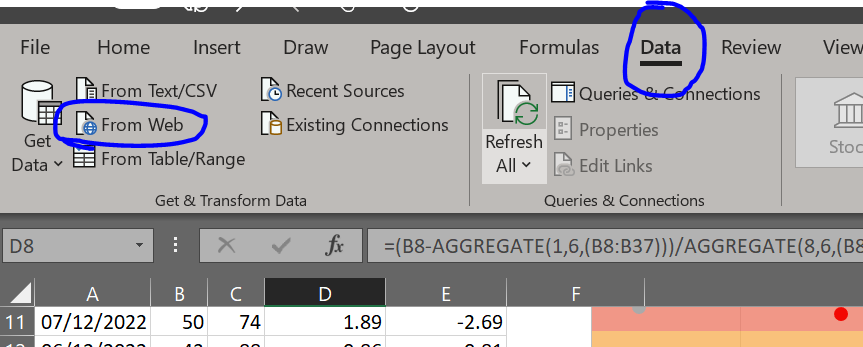
Data > Get Data > From Web
Enter this url - https://intervals.icu/api/v1/athlete/xxxxxx/wellness.csv (xxxxx is your athlete id )
Then go to
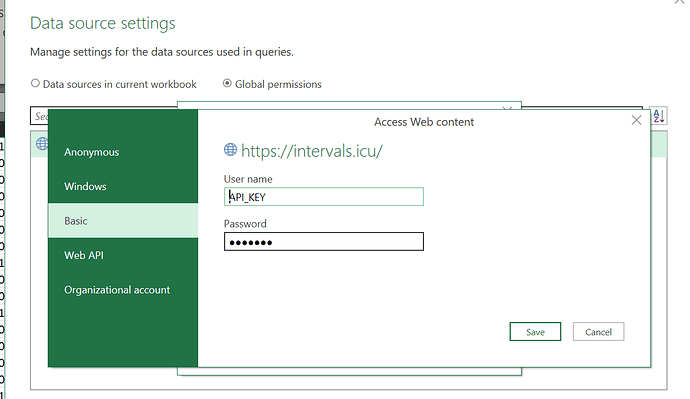
Data > Get Data > Data Source Settings > Global Permissions > Edit Permissions > Edit > Basic
username is API_Key. password is your api number
Set privacy levels to none
That should be it I think. There are a couple of errors that might pop up the first time you login. These are covered in the ReadMe sheet
Thanks lot, i send you a message. Have you see ?
Sorry, i’ve another question. After import my google sheet in intervals, i want the graph but it’s empty… why ? Thanks
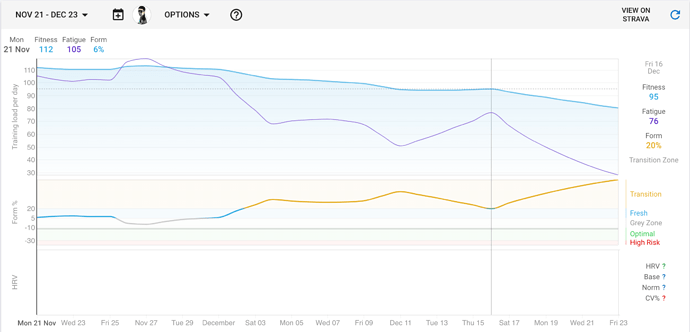
If the data doesn’t show in Intervals first, the Google Sheet isn’t going to work as the sheet pulls the data from intervals. My HRV and RHR is synced to Intervals from Garmin and shows in intervals as below
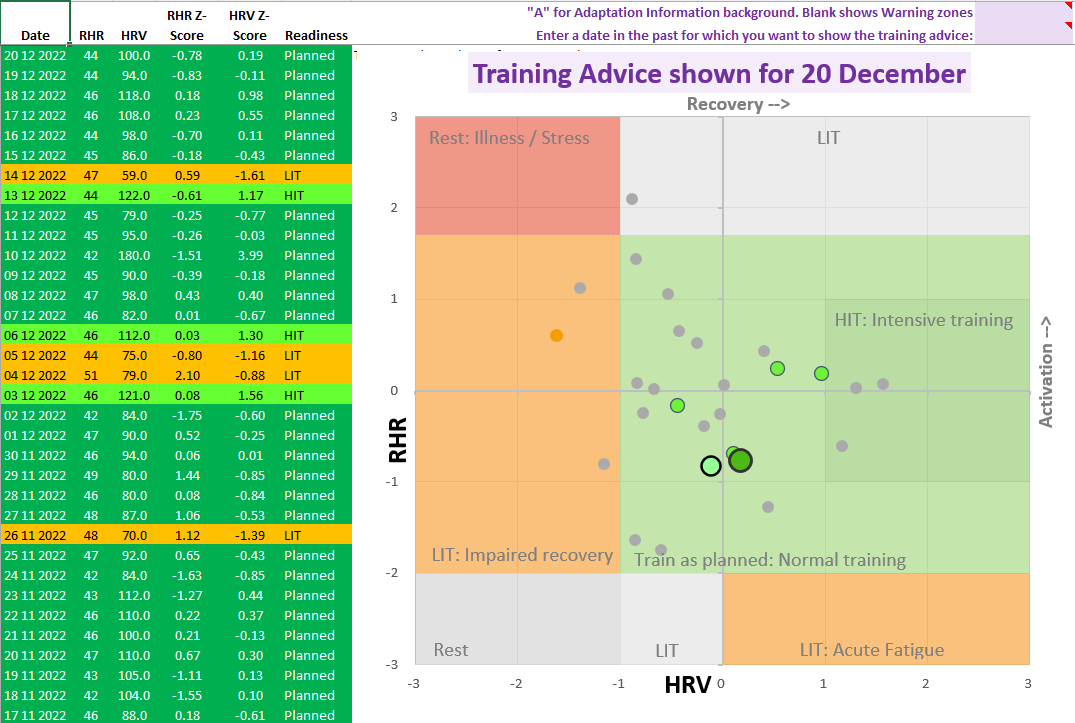
The sheet then pulls in the data after running the macro, runs some calculations then plots it ala
I have to say, I’ve been amazingly impressed with this. The analysis picked out I was going to get a full on cold a day or so before it happened and I could adapt accordingly.
Damien, je peut t’aider en Français si tu préfère. il faut comprendre comment les données se mettent dans les differents utilitaires. Le but est de rentrer les données HRV/RHR dans Intervals au propre endroit, soit les champs HRV et restingHR. De la, le graphique HRV sur la page Fitness de Intervals, te montre les données ‘façon HRV4Training’. Le fichier Excel, en suite, va chercher ces données par un appel API. Il est donc nécessaire de mettre ton AthleteID et API_Key dans le fichier pour avoir accès a tes propre données. Si tout fonctionne correctement, le tabulaire Wellness aura toutes les données Wellness que tu as rentré auparavant. Le graphique iThlete dans le fichier Excel devrait montrer les résultats ‘façon iThlete’.
La version Google sheets, également va chercher les données HRV/RHR dans Intervals par une connexion API et regénere le graphique de façon comparable. Cette version a été développé pour ceux qui n’ont pas accès a une version récente de MS Office et/ou préfèrent une solution fonctionnel sur le smartphone.
Would this cover your demand?
Yes for example, this is a good way to see the recommendation and also the trend from last days. Thanks!
whaqts the Z-score you setup? My old Dashboard is lilke "Good between 0,99 and -0,99 " , “not so good” >1 or <-1 "
The Z-scores are the multiples of Std Deviations your daily reading is away from the 30d average.
Every day, the last 30day average is calculated and the standard deviation for those same 30 days. The difference in your daily value compared to the average is expressed as a multitude of that standard deviation.
what I tried sorry for the misunderstanding . I wanted to ask, if you define how many standard deviations, do you consider, “healthy =1”, median >1<2" or “poor > 2” ; since there are several metrics “wellness X hrv X RHR etc…” Any specifc study on each metric?
The interpretation comes from
https://www.myithlete.com/how-to-use-the-ithlete-pro-training-guide/
and it was developed with the cooperation of Alan Couzens.
This is fantastic work everybody, but just wanted to confirm that this is the “canonical” google sheets version? This link is saying to request access, is there another that’s more up-to-date?
https://docs.google.com/spreadsheets/d/1YEsfkPM6RY0tXHxsWkB7LjyQOj5_2hlzh7FQLkjQhdY/edit?usp=sharing
There is the ImReady4 Mathlab Edition
https://forum.intervals.icu/t/how-to-imready4-app-for-hrv-guided-training/25778
You have to save a copy and work on the copy. But as this is now available on the Matlabs app, all support for the Excel/Google sheets version is all but over.
