Can you share the Colab NOtebook in python? Thanks , aprecciated
Gerald, how do you calculate the FTP at the end of your two suggested tests?
I did Half Monty and I think the estimate was/is too high.
I saw an interesting way (I think anway, I am new to this) to validate your numbers.
What do you think?

- The KM test uses average power, for the duration of the effort. It’s mentally a littler easier than the 20-min effort, and even easier if you’re doing extensive interval training (extending the time in zone).
- The “traditional” 20-min test (which includes the 5m all-out effort before, to flush your system of any anaerobic contribution) can use about 90-95% of the average power for 20-minutes. Depending on your phenotype (sprinter, pursuiter, all rounder or time TTer) the % adjustment will be made to the % used, eg.a sprinter might be 90% of the 20-min test, while a TTer might be 95%. The relationship between the PMax and FTP is the key here - it’s a WKO-biased approach, and works well for the athletes I’ve coached.
The half monty is a ramp test, so you’re out of steady-state once you rise above your upper threshold. A ramp test is usually performed for a VO2max and peak power output (PPO), among a few others, and not for longer efforts.
Me, personally, I use 93% of my 20-min result, and 95% if I can hold it to 25-mins. If I’m feeling good, I’ll go longer, otherwise call it a day at 20-mins. It’s usually results in a 5-7W difference, and I’d prefer to under-estimate the final value. If the test yields >10W difference, then I update my settings otherwise I’ll keep it the same until the next time.
1 Like
Thank you sir!
HM is a ramp test but uses power/hr also from the constrained effort to determine ”FTP” so it has some sort of steady state part in it that will try to determine where you cross the threshold in the ramp. Or this is what I’ve understood.
For my cycling “phenotype” I found it accurate, unlike the simpler one from TR that will overestimate my “FTP”.
———
Can’t find a formula for the “FTP” part but this is what is reported in the article from the science team behind it:
Predicted VO2 max was calculated by averaging the 2.5 and 5.0 minute mean maximal power outputs achieved during the ramp protocol by 80 watts/liter of O2.
Predicted LB power output was calculated via linear regression of power versus HR from the warm-up, constrained effort and ramp. We set 90.5% of the peak 1-minute HR as the intercept for the HR associated with predicted LB power.
This is really interesting, thanks!
What if you don’t use/have access to WKO thou? How do you interpret the data/set zones?
Good question, that requires a lengthy answer. I’ll edit this post when I’ve made notes and have some screenshots.
-
It’s a model-based system, so it doesn’t work off a % of a value, eg. 90% of FTP. Instead, it requires reliable data to give a reliable interpretation. For Intervals, the algorithm requires 3 maximal efforts, one of 5s, one of 3-5 minutes and another of between 10 and 30 minutes. I (personally) include 60-mins (“the hour of power”) and also the estimated race duration (if the person is racing), which is not included in the algorithm. This allows setting a target range for the longer efforts too.
-
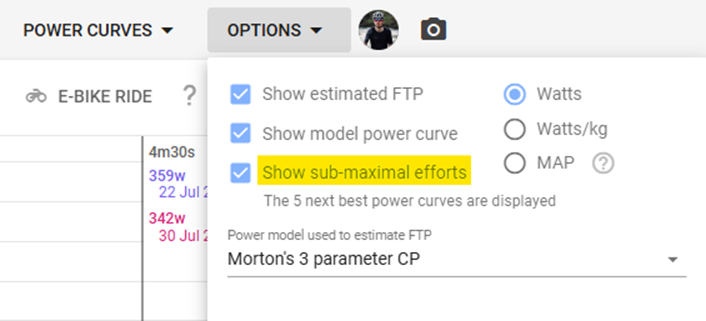
Intervals works on a similar process to WKO, as it lists the maximal efforts over a range of time on the PDC, and then also provides a target duration, target power and number of intervals/set/repeats across the duration curve (called iLevels). I probably didn’t describe it as well as what it deserves, but this is about using Intervals and not WKO. You can see the sub-maximal efforts by ticking the box, then defining the period/date range for your relevant curves.
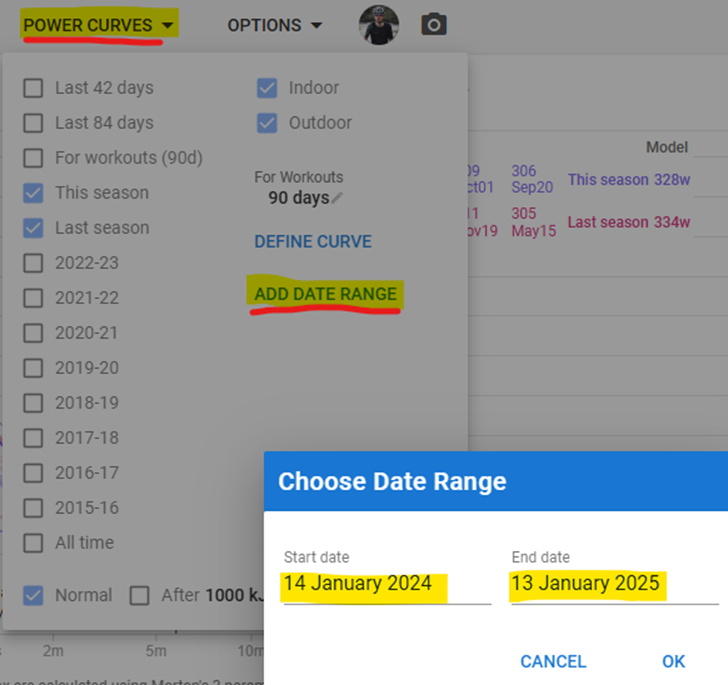
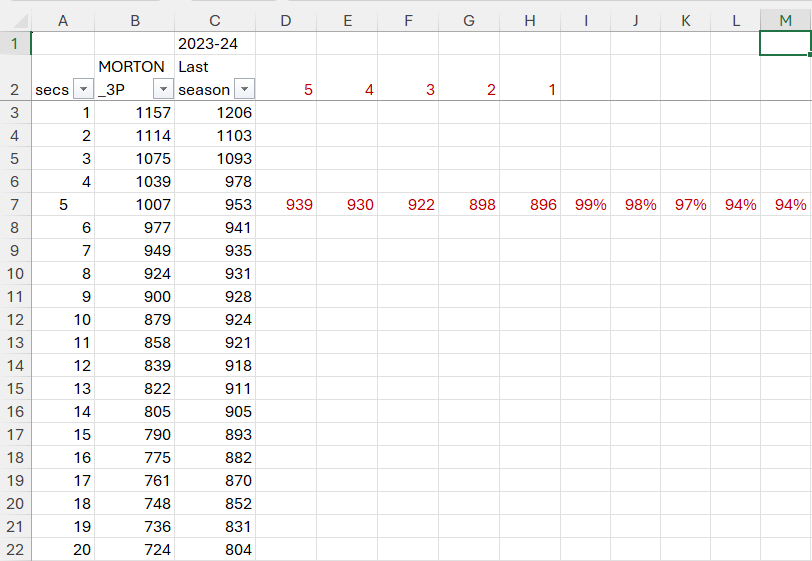
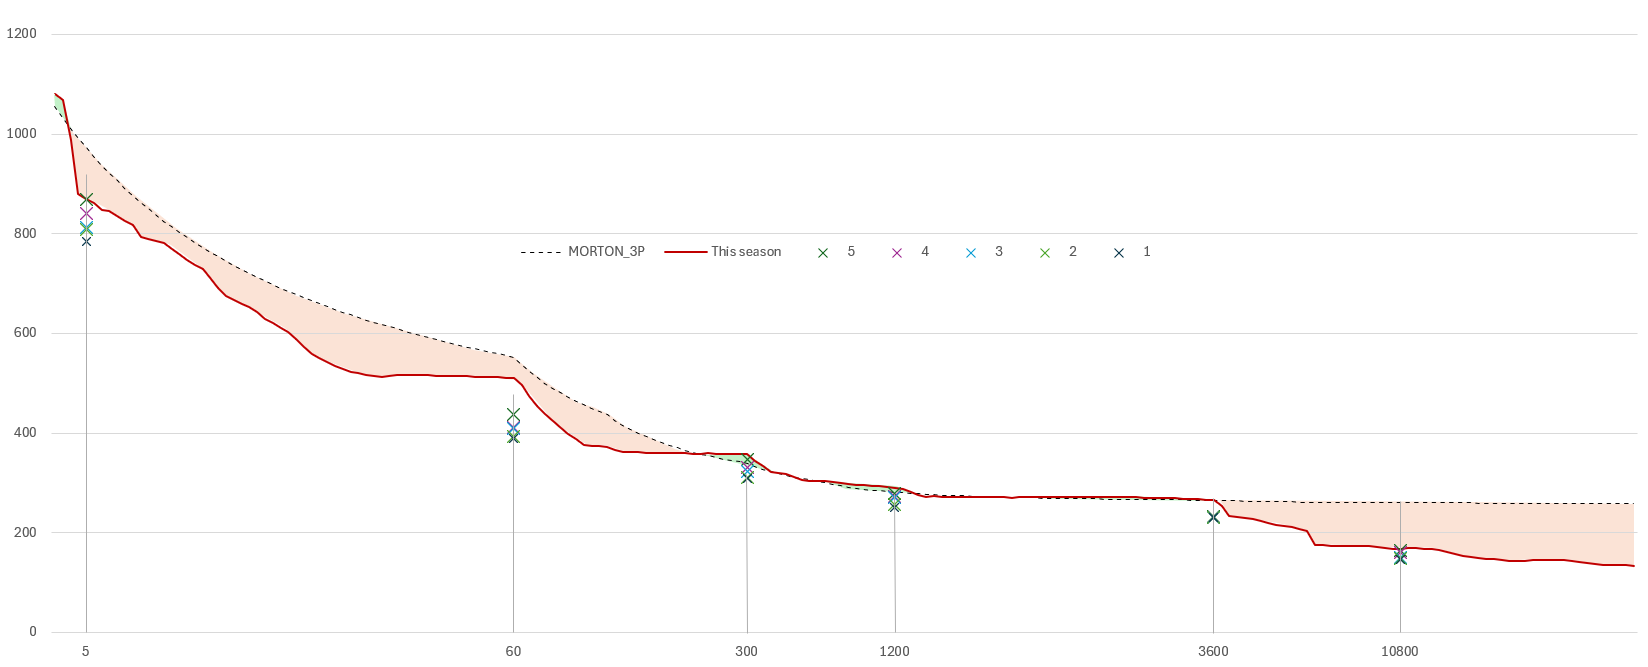
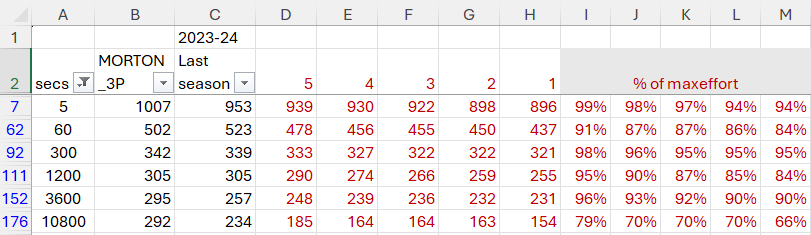
Depending on where you are in the current season, eg. the start, mid, or near-end, then you might have to define a curve that is the last 365 days (it’s custom, not a predefined one). One year should be enough to get some meaningful information. But the max can be misleading, so looking at the next 5 best efforts is equalling important, which Intervals can show on the PDC, as mentioned above. The screen may be a little too wide-angle to view the micro details of each duration, so I find it better/easier to plot on a spreadsheet. Download the PDC using the CSV option (bottom right of image) to get the model curve and date range curve data. The best 5 sub-max efforts unfortunately don’t show in the CSV,but show on the chart as 5,4,3,2,1 in the image below.

@david would it be possible, please, to include the best 5 sub-maximal efforts in the CSV file on the power page, as it’s currently excluded. The black text is what downloads, the red is what I added.
-
If the maximal was an anomaly, from a power spike, then you’d see that by comparing to the sub-maximal efforts. This can be viewed on the PDC, or in a custom excel file as well as custom charts showing the max efforts over time. This is also a little cumbersome, so Excel works best for me. The table below shows the % (of the max value) that each sub-maximal effort is. Makes a little easier to see the range, eg. 300s (5-min) is quite close together (95-95% of max), while 60s (1-min) is wider. 84-91% max).
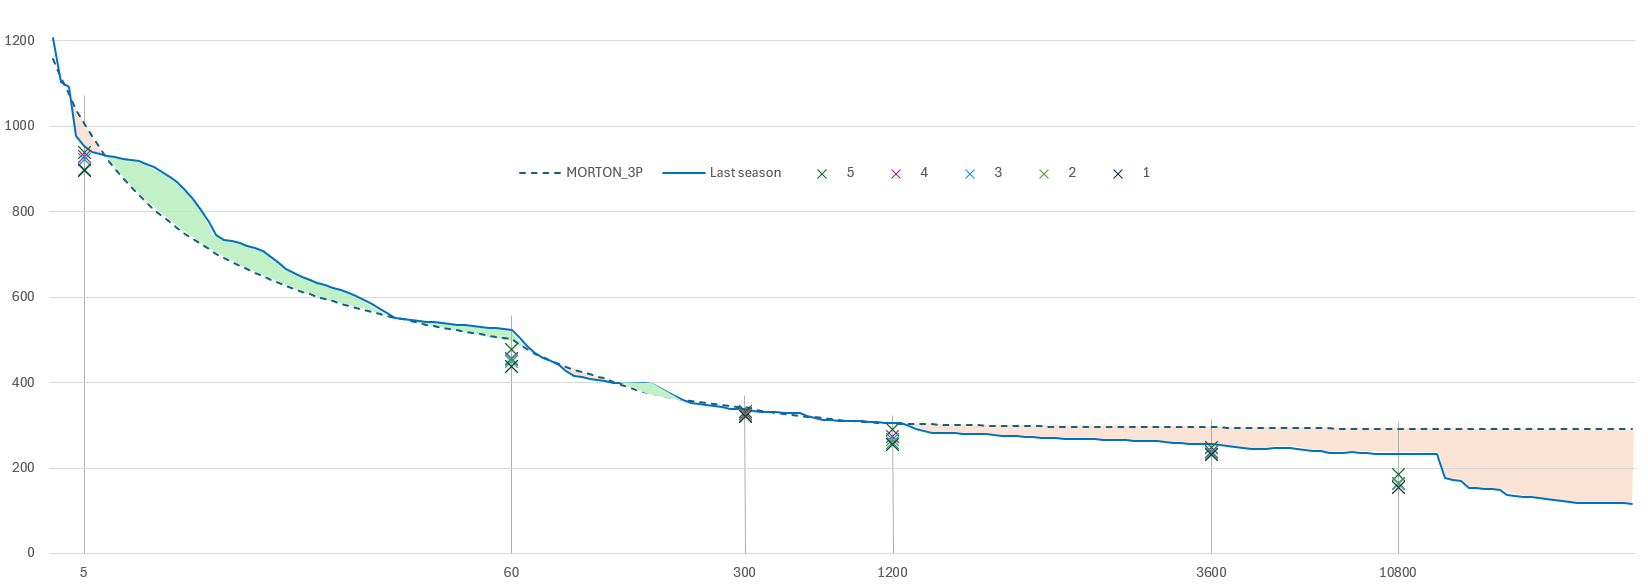
The green and red shaded area(s) indicates where the max effort(s) is(are) either better than the model (green) or not (red). Areas for improvement would be everything below the curve (red). -
So looking at the durations for 5s, 60s, 5m, 20m, 60m and 3h, you would see the peak power (on the PDC curve) as well as the “x” marks for the next best 5 efforts. This gives an idea of the range to aim for (when doing intervals). I wouldn’t worry about whether it’s a 3-zone, a 5-zone or even a 6/7-zone model, but rather what range of power is targeted for a set duration, eg. 5-min efforts could be in the range of the values grouped close together. In my example, the grouping of the 5-min power is quite tight, i.e. 322-333W (11W), relative to the max of 359W. So 359W would be a single max effort, whereas the 322-333 requires looking at those efforts to see how it was produced. In this example, it was done during interval training (5-min repeats), an 20-min test as well as for one ride after having done a certain amount of work (kJ). So knowing where those max efforts were done, helps guide what can be done for a similar effort(s).
-
This is not a system to use a % of FTP, % of CP or %of MMP, but rather using the values from the model to see your range of best efforts across the range of durations and intensity. If you don’t have adequate data (as a newbie), or it has a wide range across the sub-efforts, then it gets a little harder to manage (but not impossible). This makes this system unique to you, rather using a population average (95% of a 20-min test, or 90-105% of FTP) to determine a range of power/heart rate.
Thank you sir, most appreciated!
If doing this indoors, would you do it in ERG or level mode? There is like a 2000 post thread on the TrainerRoad forum that I’m trying to slog through to get an answer but it’s making my head hurt. Hahaha.
1 Like
If you have the ability to switch between ERG and level, then use ERG during the warmup and endurance bit, and do the hard efforts on level mode.
The reason is that you don’t want to set a resistance that prevents you from achieving a true maximal effort. It would either be too hard or too easy.
2 Likes
The prior post has been updated. Ask is there’s something a little unclear.
1 Like
Very cool, I greatly appreciate all your effort!
1 Like
re: switching out of ERG, yeah should be able to with the Garmin, good idea in fact, thanks!
1 Like
Allo Gerald,
I noticed something in your version of the test. That second block at 100 percent of FTP you have set to 10 minutes.
I thought it was supposed to be 15?
I’m going to get this knocked out next week so I want to make sure, thanks ![]()
1 Like
Thanks, I’ve updated the second block to 15-mins. The last one is 10-15 or as long as you can sustain.
1 Like
Okay I got it knocked out but encountered a few issues.
The way I did it was sent the workout to TrainingPeaks and then to my Garmin. I was able to override ERG mode and switch to level mode at the start of the first hard block. But then when the next power increase came up, the trainer flipped back to ERG and I had to manually override it again. Same with the short ramps near the end. A bit frustrating (allthou the Normalized Power was close to the average still).
What did I do wrong with the head unit?
Thanks ![]()
What Garmin are you using?
1 Like
Edge 540. Trainer is a Wahoo
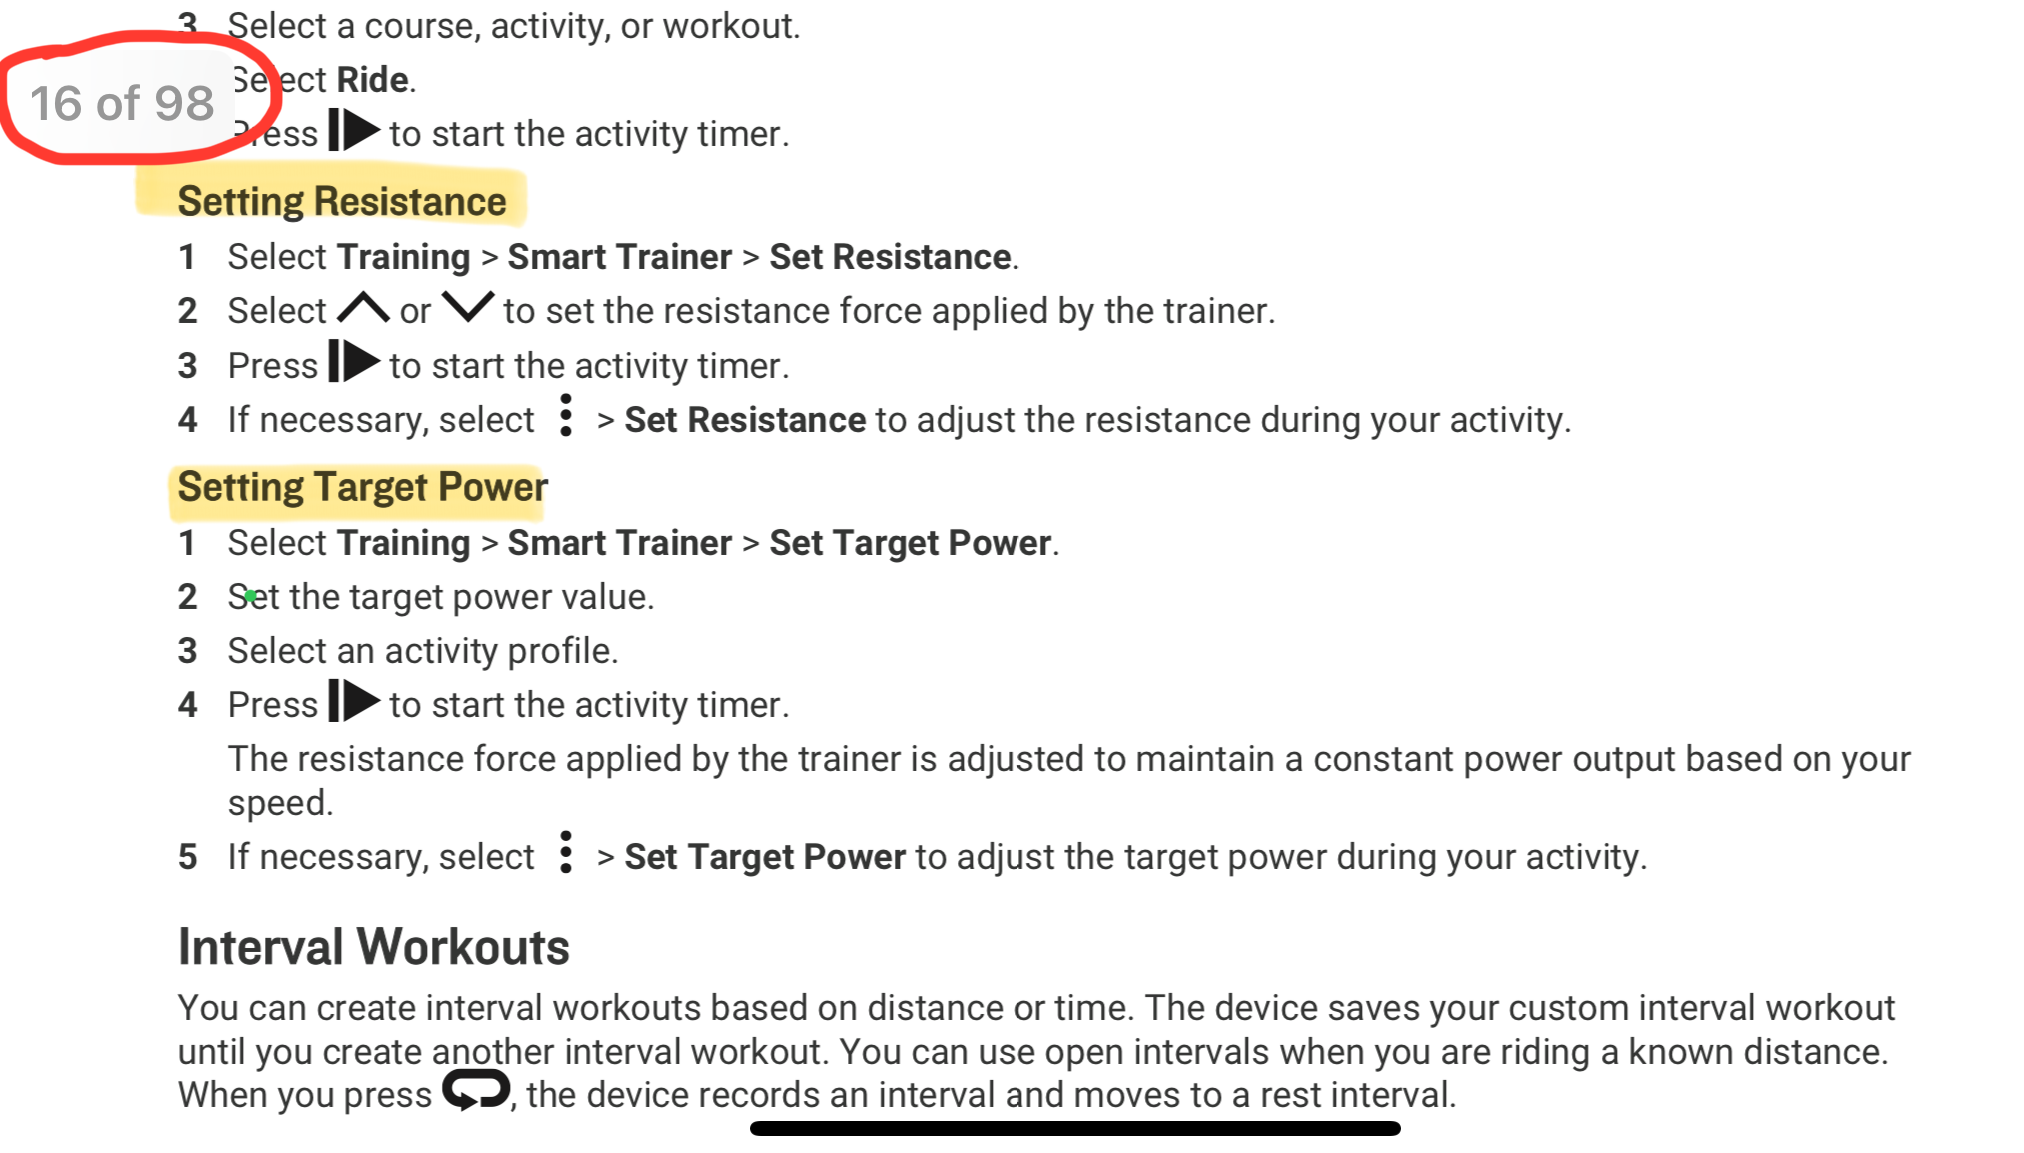
So your Garmin is probably set to control your trainer on indoor mode; see the 16th page of the manual… https://www8.garmin.com/manuals/webhelp/GUID-17DE938E-466A-4746-BDBF-7A6FC1B3A32C/EN-US/Edge_540_OM_EN-US.pdf
This is fine if you only use the Garmin to control your resistance. If you use any other application, eg. Zwift, TP Virtual, Rouvy, etc., then you need to disable this so the terrain in the virtual app can control the resistance.
I prefer following the workout only on the Garmin, and use gears and/or another app to control resistance. The Wahoo app can seamlessly switch between ERG, resistance and simulation mode, but is not automatic; you need to manual change.
How about this source for a standard CPET test:
That´s the Gold Standard for measuring VO2.
But it´s expensive and the ramp rate isn´t adapted to find FTP. It´s focussed on max VO2.
It does also provide VT1, where the RER = 1.
3 Likes