The 4DP test protocol is available but the analysis of the data is within Wahoo’s environment. I’ve done the Half Monty for my own experience, while on the trial period, but won’t rush to do it repeatedly. Unless you know how interpret it, there’s no point trying to get your own interpretation. Same with the INSCYD test, the analysis of the data is in their software.
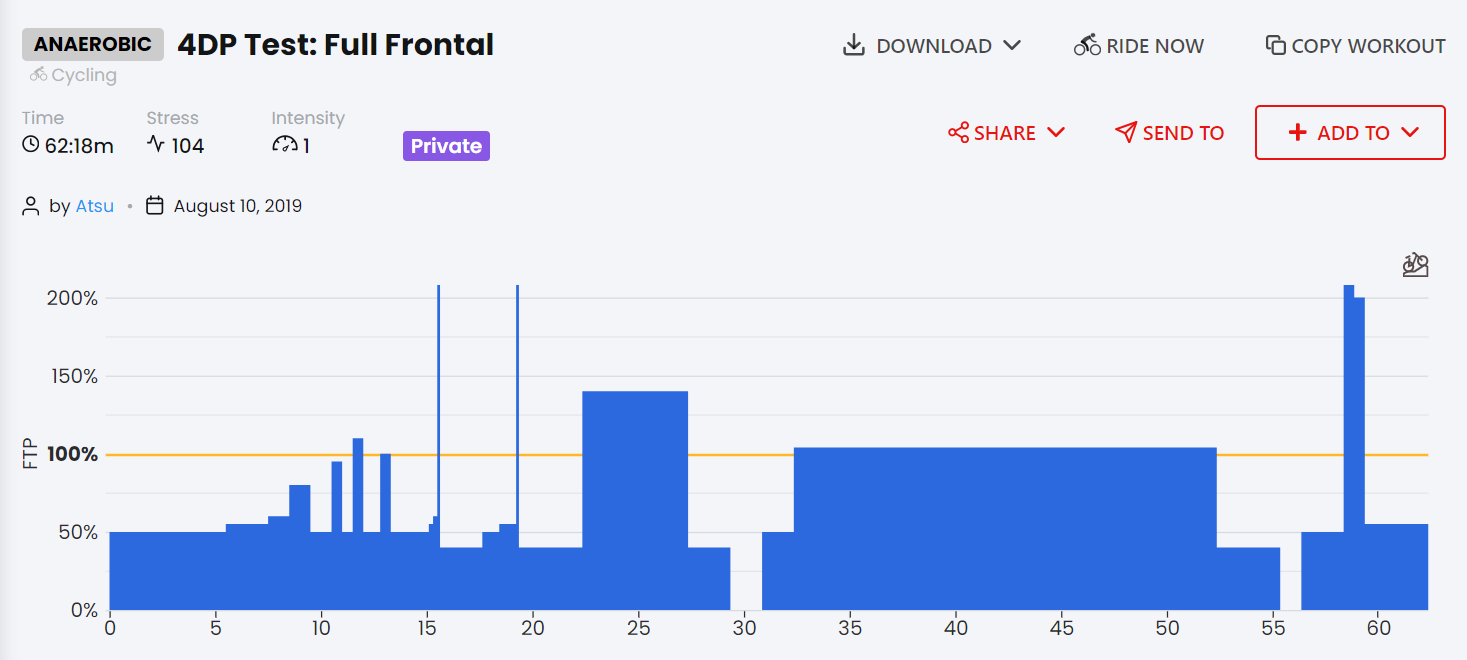
4DP is a copy of Coggan’s Power Profiling. Wahoo just stuffed all efforts in one workout. Here are a couple references:
Another explaination:
If you want something kind of close to INSCYD, you can also DIY using this Python notebook. It’s based on Mader’s model, which is what INSCYD is. The python notebook won’t do the complex workout simulations that INSCYD also offers. I stopped trying to measure and use VLaMax after I spent lots of time sprinting and sampling in cycling and running. I find that if you know VO2Max and CP/MLSS to a good degree, back calculating VLaMax is easier than trying to measure it.
This paper is what INSCYD is partially based on. You can find INSCYD’s patent online to read if you want.
And a recent application:
3 Likes
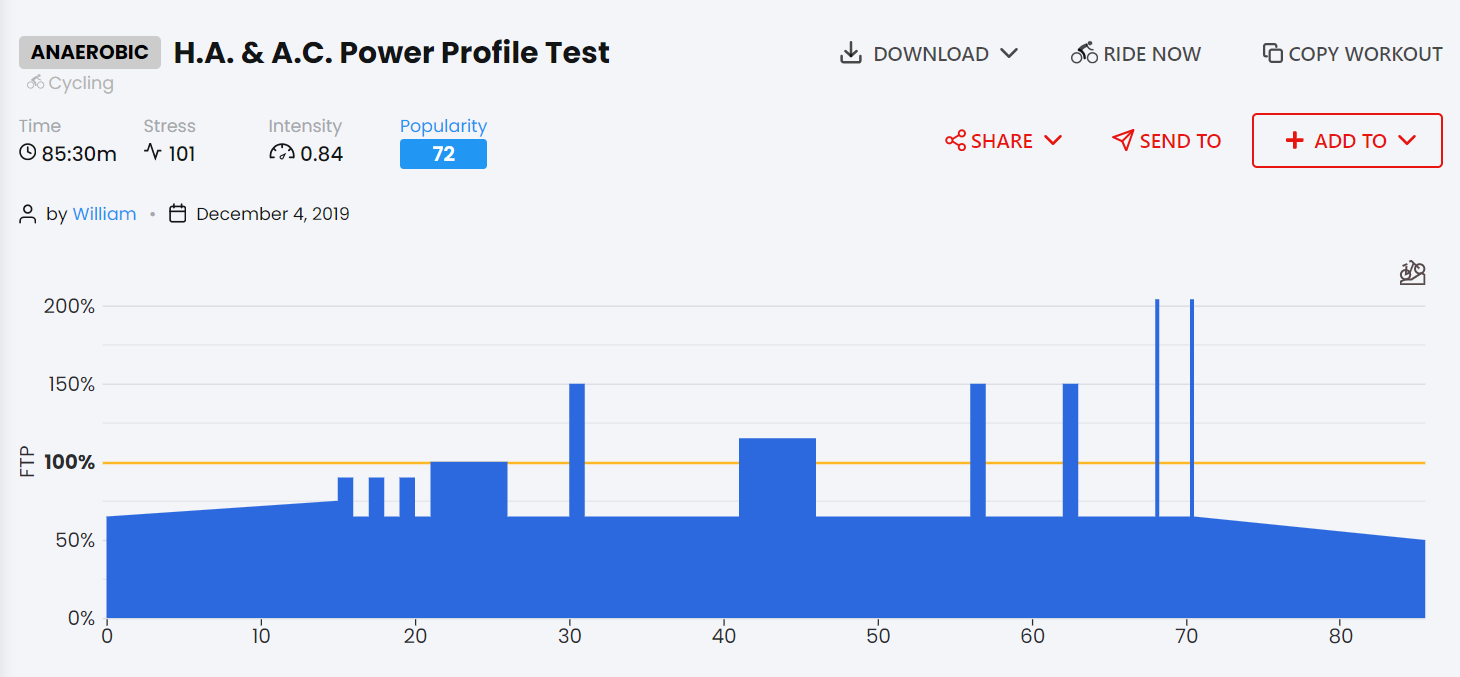
The Coggan power profile test is also all in one, unless you’re referring to Fatigue Profile tests(level 5, 6, 7) on pages 62-63(2nd edition).
The 4DP test does it in a different order (2x max efforts first instead of last).
The Coggan power profile is available in my shared library.
1 Like
Good catch, I misremembered.
1 Like
These two metrics are important:
- Fun
- Consistency
If it’s not fun, you will be inclined to give up. Keeping it fun contributes to the consistency achievement.
Aerobic fitness is easy to grow, maintain and hold on to. It’s like compound interest on a savings account; the interest becomes capital and the new interest grows higher on top of the higher capital.
1 Like
I’ve done a lot of playing around with ramp test protocols, steady-state “FTP” tests, and 4-DP / power-profile style tests in the last few years since getting a power meter, all of which I’ve found enjoyable. Although I think what I got most enjoyment out of was trying to understand the different protocols. I came to view the 4-DP style tests as the most effective for me to understand my current performance level, but I came to find tackling them quite daunting since they do take a high physical and mental effort to perform well. Additionally it was my preference to perform those tests out on the roads which adds another few layers of complexity in terms of routing and likely traffic!
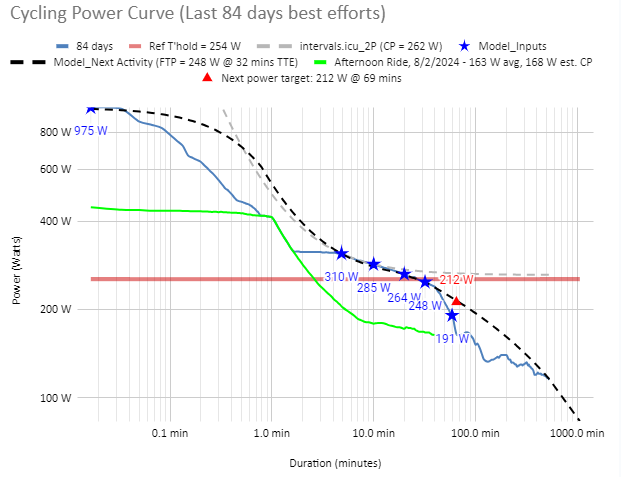
More recently, and as I’ve developed the Next Activity spreadsheet (latest version is 2.7 as of January 2024 by the way) I’ve tended to prefer defining current performance by the power curve itself. Now of course, the power curve has to be reasonably well filled with high quality efforts, and all of the testing protocols discussed above can help with that. And then you can define your FTP, CP and other metrics directly from your power curve.
I think the tricky bit is in identifying what efforts are needed to sufficiently define your power curve such that it is a good representation of the performance that you are capable of. This is something that a good coach can help with and is something that Kolie Moore talks about in his podcasts - that he is able to determine by eye when he looks at his athlete’s power curves. I’ve taken a mathematical approach within the Next Activity spreadsheet, such that based on various rules / heuristics the spreadsheet will recommend what sort of effort you could incorporate next into your training / testing to better define your power curve. For instance, you can see in the copied image of my power curve that the spreadsheet recommends that I should try doing an effort of 210W for a bit over an hour, when my FTP is approximately 250W. This is basically a validation effort, since as you can see the model sits higher there than my actual power curve. Similarly, by eye you could take a view that I should throw in some shorter duration efforts for a similar reason, which the spreadsheet might recommend if the relative difference between the model and my power curve at those short durations is greatest.
Anyway, I’m pleased to hear @PiPPi that you’re using the Next Activity spreadsheet and hope it proves useful for you. Hopefully some of what I’ve written above will help you with your quest to determine what testing protocols fit best for you!
2 Likes
The power curve is a model based off what actual cyclists, at that level, are capable of doing. Your data is then placed on top of the curve placing you either above, on par, or below the modelled curve.
Intervals requires one maximal effort to workout the eFTP, which is fine, but there’s more to the curve than just FTP.
In WKO, the efforts should always be maximal, and not a combination of efforts in one go, like the 4DP. The tests should range across all phenotypes, i.e. 5s, 1m, 5m and 20m and even longer. I don’t test differently between Intervals and WKO, so all my testing, and my athletes will always lean to maximal efforts.
It doesn’t have to be structured in a formal test, and will encourage anyone to do a 5s or 1m maximal effort any time on a ride. Not every ride, but when they feel well rested.
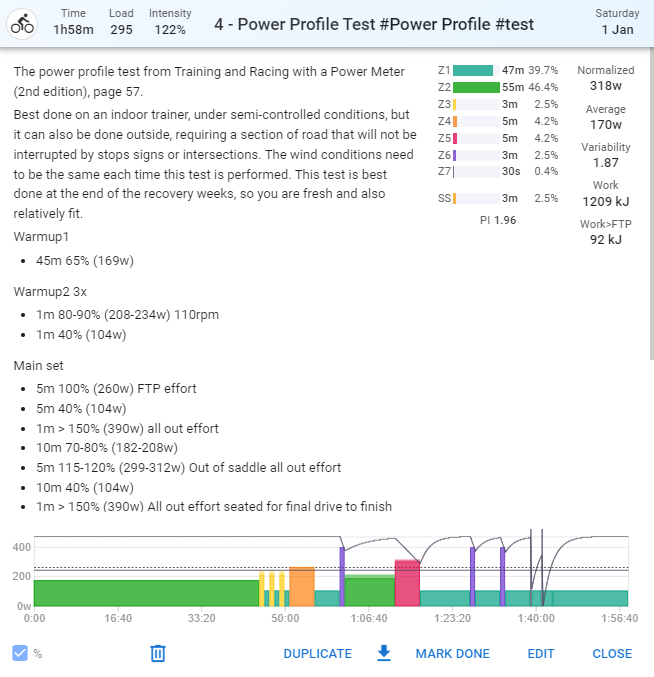
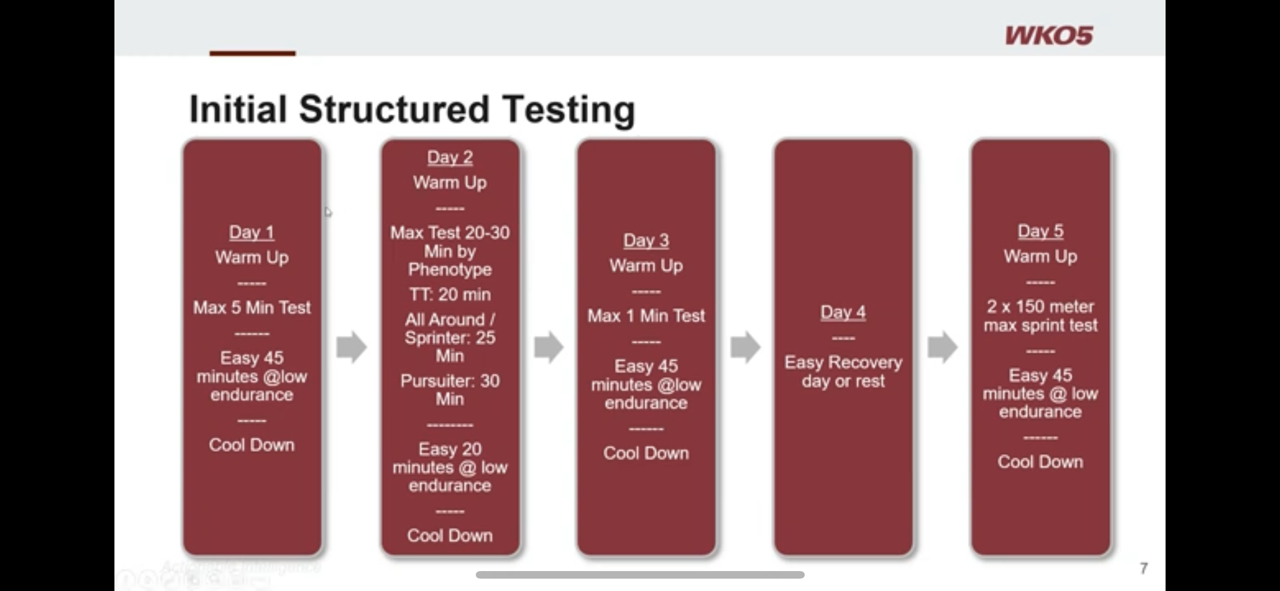
Here is the testing protocol from Tim Cusick (WKO). 11:45 into the video is this slide:

This not working for me , sadly - I have high power in short duration , but longer duration is a disaster , even CP with 3 tests give me higher Power (i wish) could sustain for 20min
Hello GarageLab,
Thank you once again for all the valuable information you’ve shared with us.
I have a small question about the answer you just gave.
How do you determine VLaMax with only VO2max and MLSS?
Thank you very much.
I would argue that CP works for you the same way that it works for everyone else…since CP is only a mathematical exercise. Not only is it a mathematical exercise, but the value also depends on the testing method and model used, and some methods and models are worse or better at describing your physiological reality. It’s an iterative process to work all that out.
I still like Andy Coggan’s 7 deadly sins.
Do you do 40+ minute time trials?
1 Like
In my experience measuring VLaMax is quite difficult and I can get very different VLaMax results from 15-60 second tests. Correlating power to VO2Max and MLSS are much easier, so I usually back-calculate VLaMax from the VO2Max, MLSS, VLaMax relationship. I don’t know of a power to VLaMax equation.
Thank you for your feedback.
Would it be possible to share with us the correlation you found? I’ve never seen anything like it … thank you very much.
Hi Damien,
I’ve posted the python notebook several times and that’s what I’m referring to when I say vlamax, vo2max, and mlss relationship.
Assuming your own body weight, vo2max, and mlss, you can use the python notebook to back -out the vlamax.
Check this out. Someone plotted contours of Mader’s model:
Thanks @Doug_Pape for asking this question. Lots of interest with the Peloton Power Zone training members as to switching from a 20 min FTP to a ramped test. I’m a curious type and have spent far too long trying to find ‘a clean or clear protocol.’ At the end of the day, I’ll just stick with my Zwift-based FTP test that has the 20 min effort built in. Lots of informative responses and will now go down some internet rabbit holes reading more about some of them.
1 Like
Thank you @madooroy. I think it is time for a conclusion post, at least from my end. I have come to some simple conclusions that may help answer my original post and hopefully will help solidify the options presented. I appreciate very much the amazing level of input and thought given here, this is truly an incredible community.
I had a talk with dr. Phil Skiba sometimes ago and he said that he uses the 2p model with 3 efforts (3-6-12) performed in different days.
I can add that is crucial the quality of tests data in order to obtain good results. Avoid mixed effort (seated/standing) and different powermeters. Just do dedicated testing session in a controlled environment. Same thing if outdoor.
If done correctly there’s no need to test periods longer than 12m. The CP will fall in the 25-40’ domain for sure.
Testing 20-30-40m is 100% glycogen depletion that needs days to be restored and recovered. For this duration use races or dedicated event to test them.
1 Like
After many tests i can confirm that the sprint test is very challenging in order to obtain good results compared to a “backward calculation” that uses steady state VO2 and the relative max lactate value for that effort.
Thanks again for sharing.
I’ll take a closer look. It would be great if we could find the complete Mader equation so we could play with the numbers ourselves… It’s so expensive Inscyd, too bad for all the enthusiasts…
This post hast all you need to get started coding your own Mader model. Use the Python notebook to see how it works. Read the hauser paper to see the equations.
3 Likes