iOS and Android app for Intervals.icu Data

Having read this post, I think there could be a few other key metrics that could be displayed on a summary page.

In WKO5, they have summary info in the hero bar, which lists (in Intervals’ terminology):

  • eFTP

  • TTE

  • Tmap

  • VO2max

  • Fitness

  • Fatigue

  • Form

  • Rider profile

Example below.

2 Likes

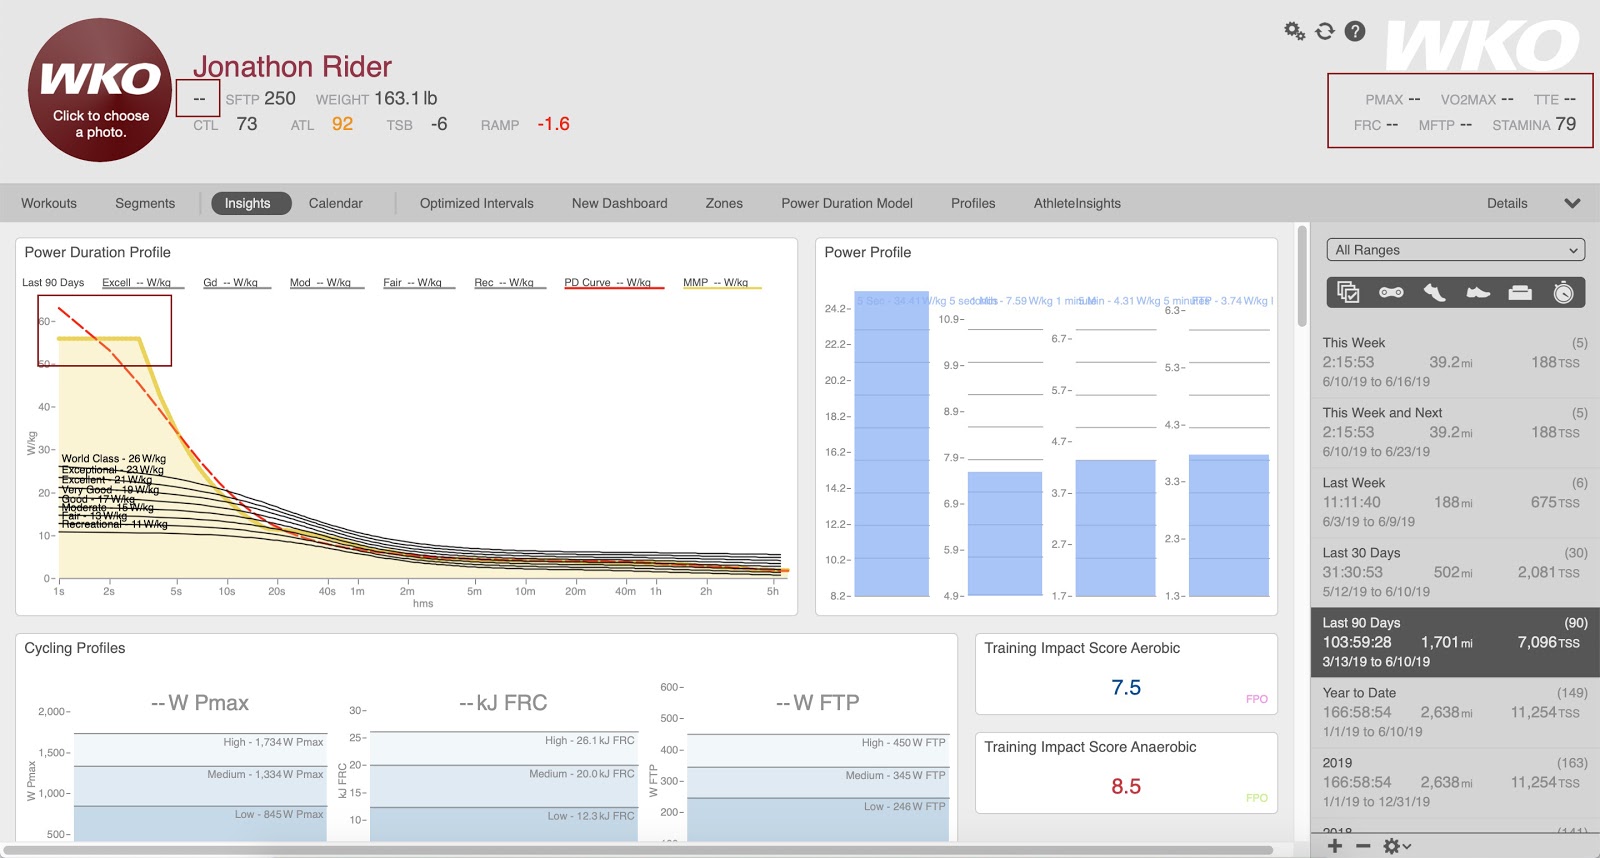
Ok, so you mean adding this extra data to the home screen of the app ? so you get more than just the form, fitness and fatigue?
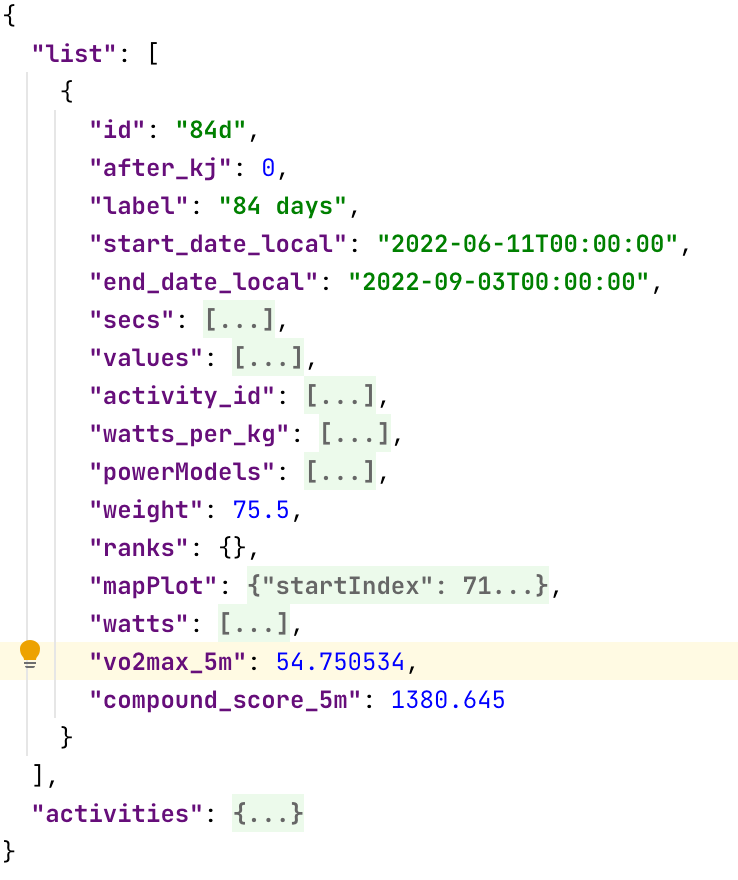
Let me try to acomodate this info and see what I already have from the api

Yes, having a summary of key information as well as the ability to update key metrics (as mentioned before).

Happy to help lay it out in graphical/visual layout and seeing what is possible from there. I’m not a developer, so not sure what’s possible, but I like that you can possibly create this; inspired by what other apps/websites offer and seeing how this can be linked to the Intervals data.

I’ll try to add eFTP, VO2Max tonight since this data is already there
I’ll add current weight into the settings page, read-only now, but will give the possibility to update from there by the end of week

1 Like

@david From where can I get the current vo2max? Should I iterate thru all the workouts and get the last value?

The VO2max I was referring to, in my post, was the one in the best power table on the power page. That’s where TTE, MAP, Tmap, etc.

I don’t think there’s value in having this change based on the period selected, and could possibly be the info in the column 84 days.

I added a few extra fields under a new screen, I still need to refine the layout and styling, but I just want to keep giving you more value with this app
I’m still exploring the interval API to understand from where pull what data
Can you please tell me what values would make sense in this specific new screen? I think I can also add the power curve here

I sent you a private message of the screens as I see it.
If you think it’s possible, then I’m sure you can share it.

Try this:

GET /api/v1/athlete/2049151/power-curves?type=Ride&curves=84d

That will get you the power curve using the most recent 84 days of data.

3 Likes

Thanks @pmcarlos , can I change the Color’s between optimal training area and overload ?

How would it be exactly? do you mean in the form chart? (the one at the bottom)
would you like to change the threshold values?

Quick Update: Now you can add your Feel and RPE for every activity

3 Likes

This is awesome! I like the idea of having somewhere to quickly see my fitness and form. It would be nice of the charts had some detail on the left axis explaining what we are looking at, if you know what I mean!

1 Like

Nice job! Tks

1 Like

Can you elaborate please?

Sure sorry I want clear to start. As I look at the charts I don’t really have an understanding on what is being shown or what level I’m at

On form for example I just have a grey line but I’m not sure what the meaning on the left axis is. Am I in form? Am I dead?

Hope that makes sense

1 Like

This is neat as a quick summary and bit easier to read the graphs and activities than the full website. A next workout tab for those with schedules would also be useful.

1 Like

I’ll try to implement this soon, I’m working on adding more numbers and charts like your historic vo2max and your max powers

@david is it possible to add messages to an activity? I’m trying to do it but getting 401
Is that an internal endpoint?

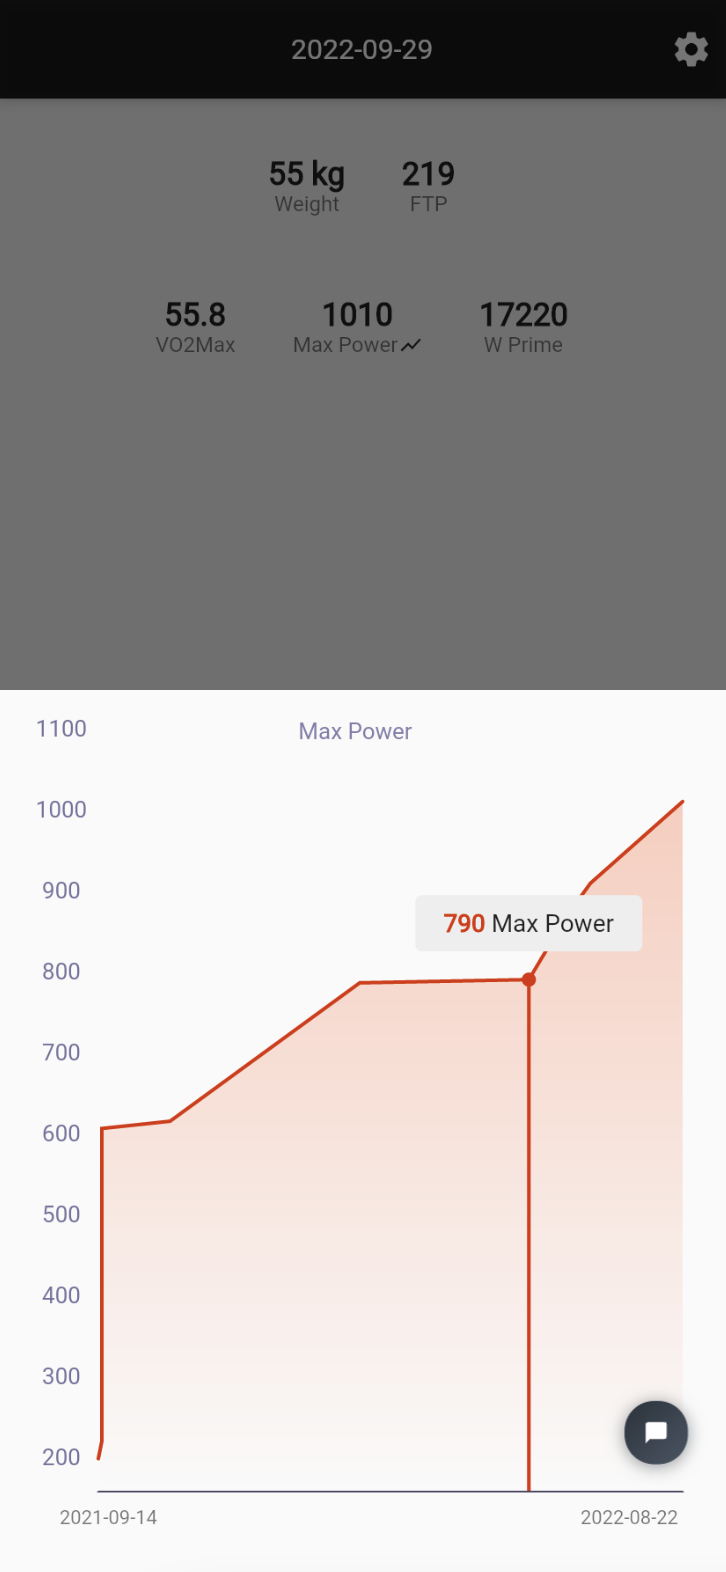
Somehow I’m not able to update my original post anymore but here is today’s update
You can now click on Max Power, and it will show you a chart of your historic max powers, it only consider increasing values (positive changes)