Would it be possible to include a power curve that predicts what you should/could be capable of on the Power Profile Graph. I’ve been having a look at Riduck and the predictive power graph they have.
Gerald
20 January 2026 08:35
2
The power duration curve can only predict what you are capable of, based on doing maximal efforts across a few durations, eg. short, medium and longer durations.
The model curve then fits to your data, with your actual efforts showing below or above the model line. Anything below is an area of improvement, or perhaps a weakness if you simply cannot get to those numbers.
1 Like
Gerald
20 January 2026 08:51
3
Perhaps have a look through some topics on this:
Hi, first feature request here,
I’ve been reading lately about training, power training, etc. It would be lovely to include some overlay over the actual plotted curve, some sort of “ideal” curve to see how over or under our curve is at each moment.
Below it there are some charts and histograms to get an approach, but the “ideal curve” would be a nice addition, along with something like an index to see which athelete you are: all-rounder, sprinter, etc…
Thanks!
[new to intervals.icu. I am NOT an athlete, but a senior who is into touring. I want to keep track of my “range” as in car range estimates that tell you how many miles/kilometers you can expect based on the amount of fuel in the tank, and the driving conditions]
On the Power tab, the power curve displays actual values for duration of up to 2 hrs (the longest amount of time I spent on my indoor trainer) and the power profile settings allow to display comparative power for duration up to 4 hrs. I…
Hello, I am relatively new to Intervals - but I am already loving it!
One issue that I cannot understand right now is the power curve - or I might have to say curves - plural.
My thinking is that when I select multiple display options in the Power Curve Menu - e.g last 42 days and last 84 days - that I would get not only one, but two curves and value sets displayed.
But I get only one - and the values in the tables for
Last 42, last 84 and from beginning are always the same.
(See Screen).
…
Gerald
23 January 2026 05:37
4
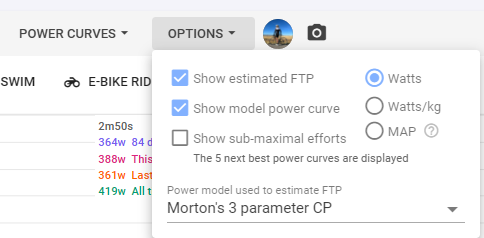
Make sure that you have the model curve showing.
You can also see your next best 5 sub-maximal efforts by ticking the box.
1 Like
Thanks @Gerald that is what I was hoping for!