Hello, I am relatively new to Intervals - but I am already loving it!
One issue that I cannot understand right now is the power curve - or I might have to say curves - plural.
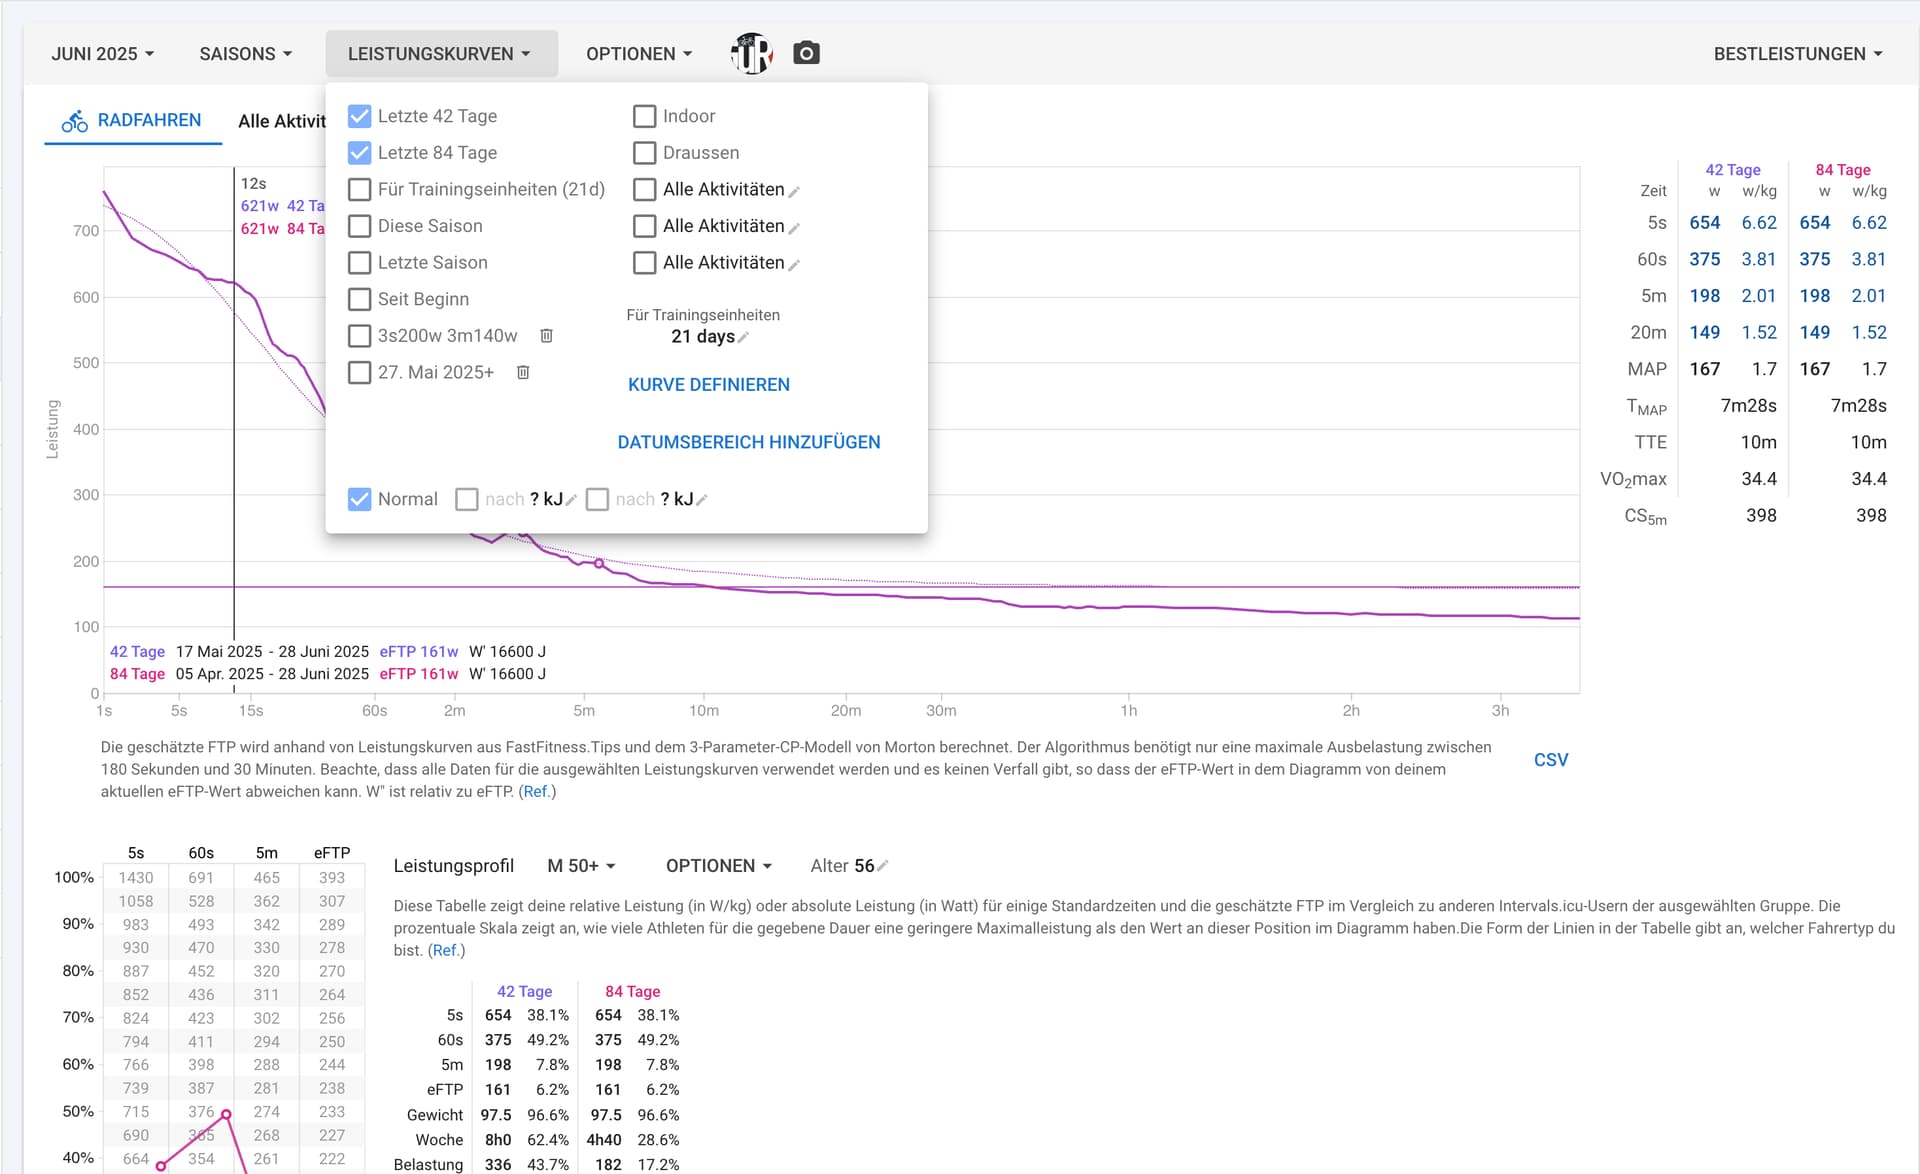
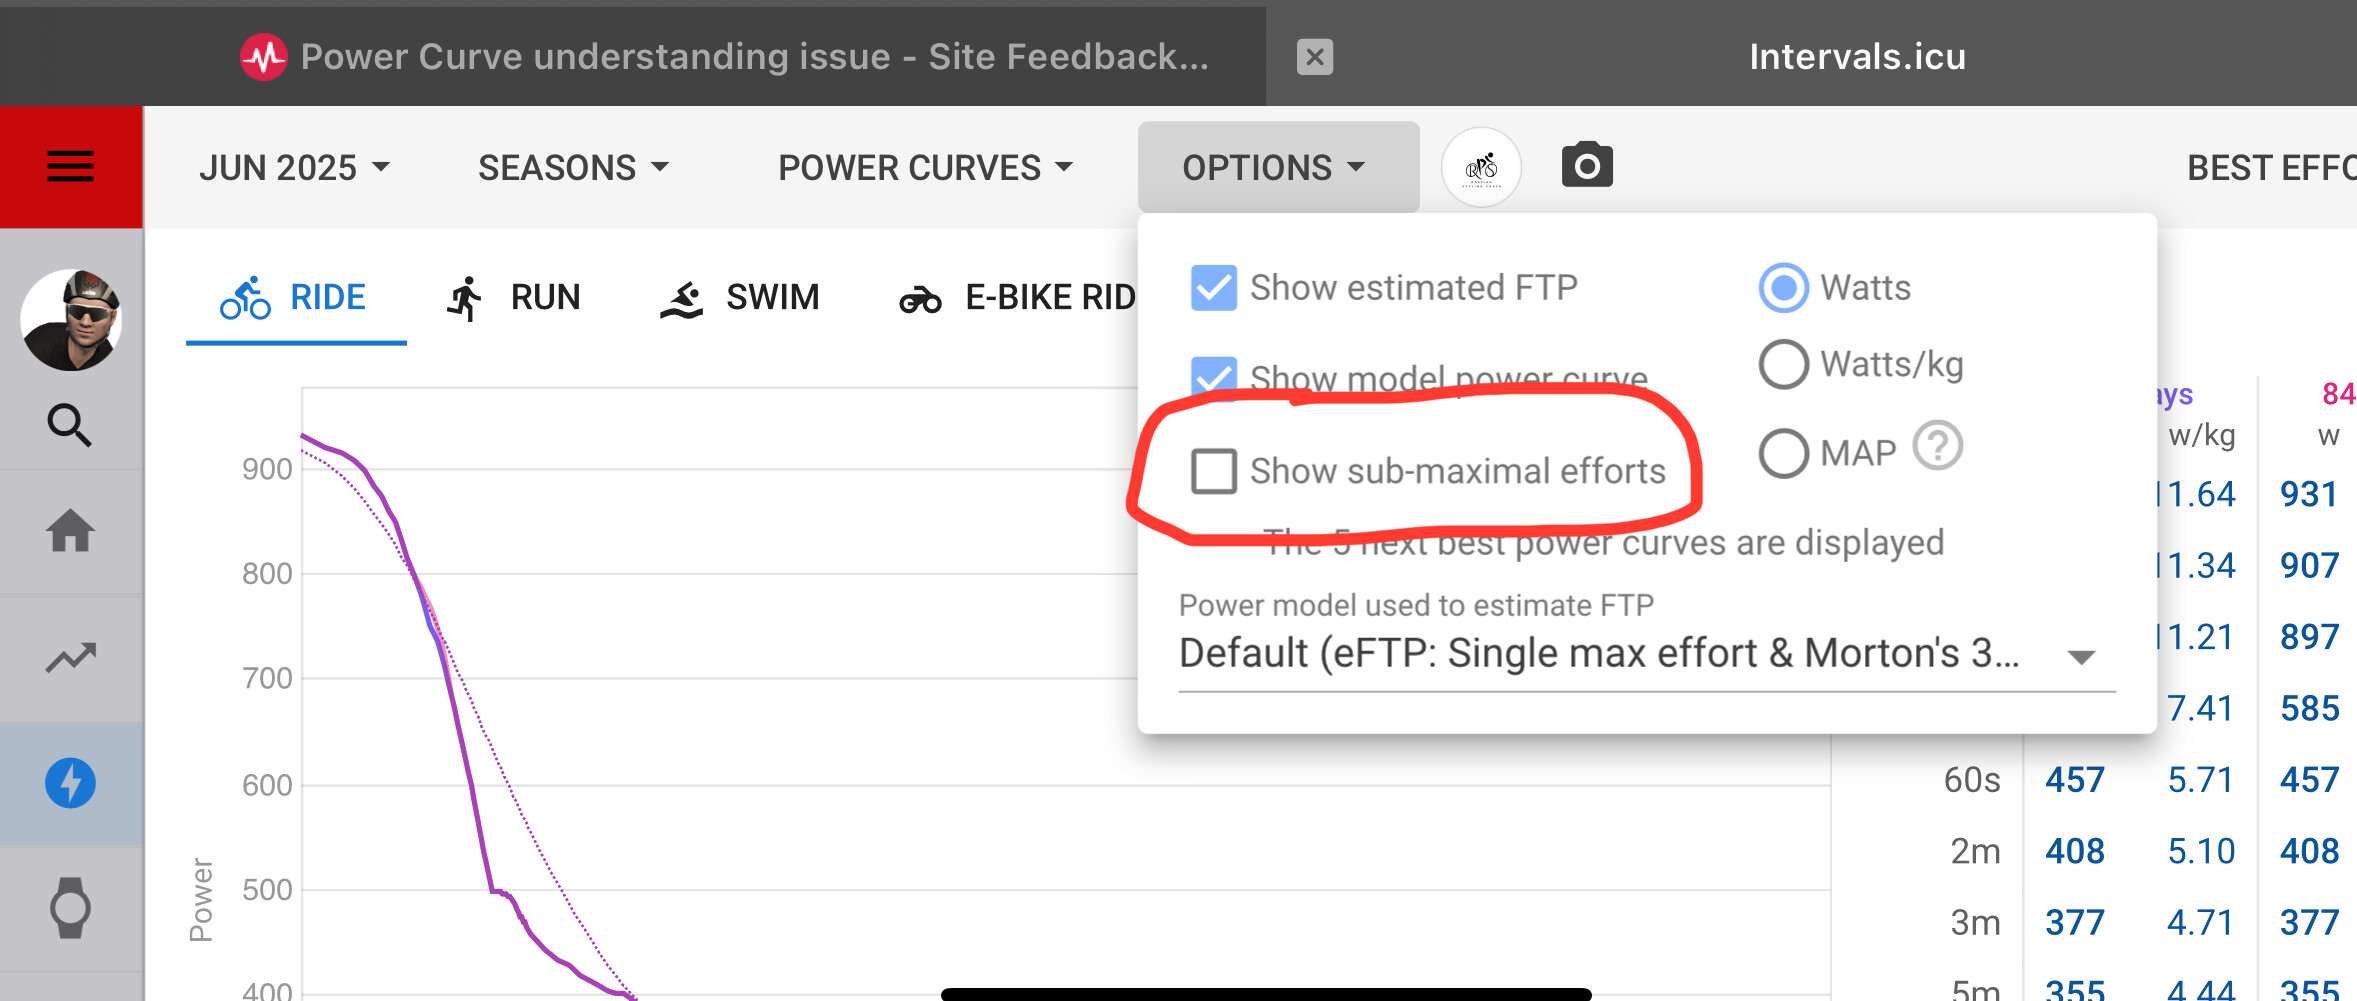
My thinking is that when I select multiple display options in the Power Curve Menu - e.g last 42 days and last 84 days - that I would get not only one, but two curves and value sets displayed.
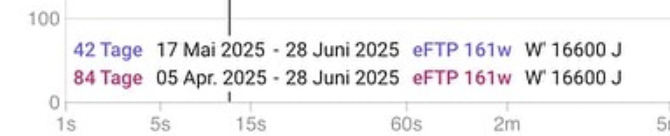
But I get only one - and the values in the tables for
Last 42, last 84 and from beginning are always the same.
(See Screen).
This could - perhaps - be explained by the fact that the first activity has been recorded for May 18th - BUT!:
When I define my own date range - e.g “Add Date range” > Start date: 1. june 2025 and then selecting this range to display, I stll get only one curve.
What am I missing here - or is it just the case that due to my short data aquisition period there is nor real comparison possible?
Thanks already for pointing me into the right direction!
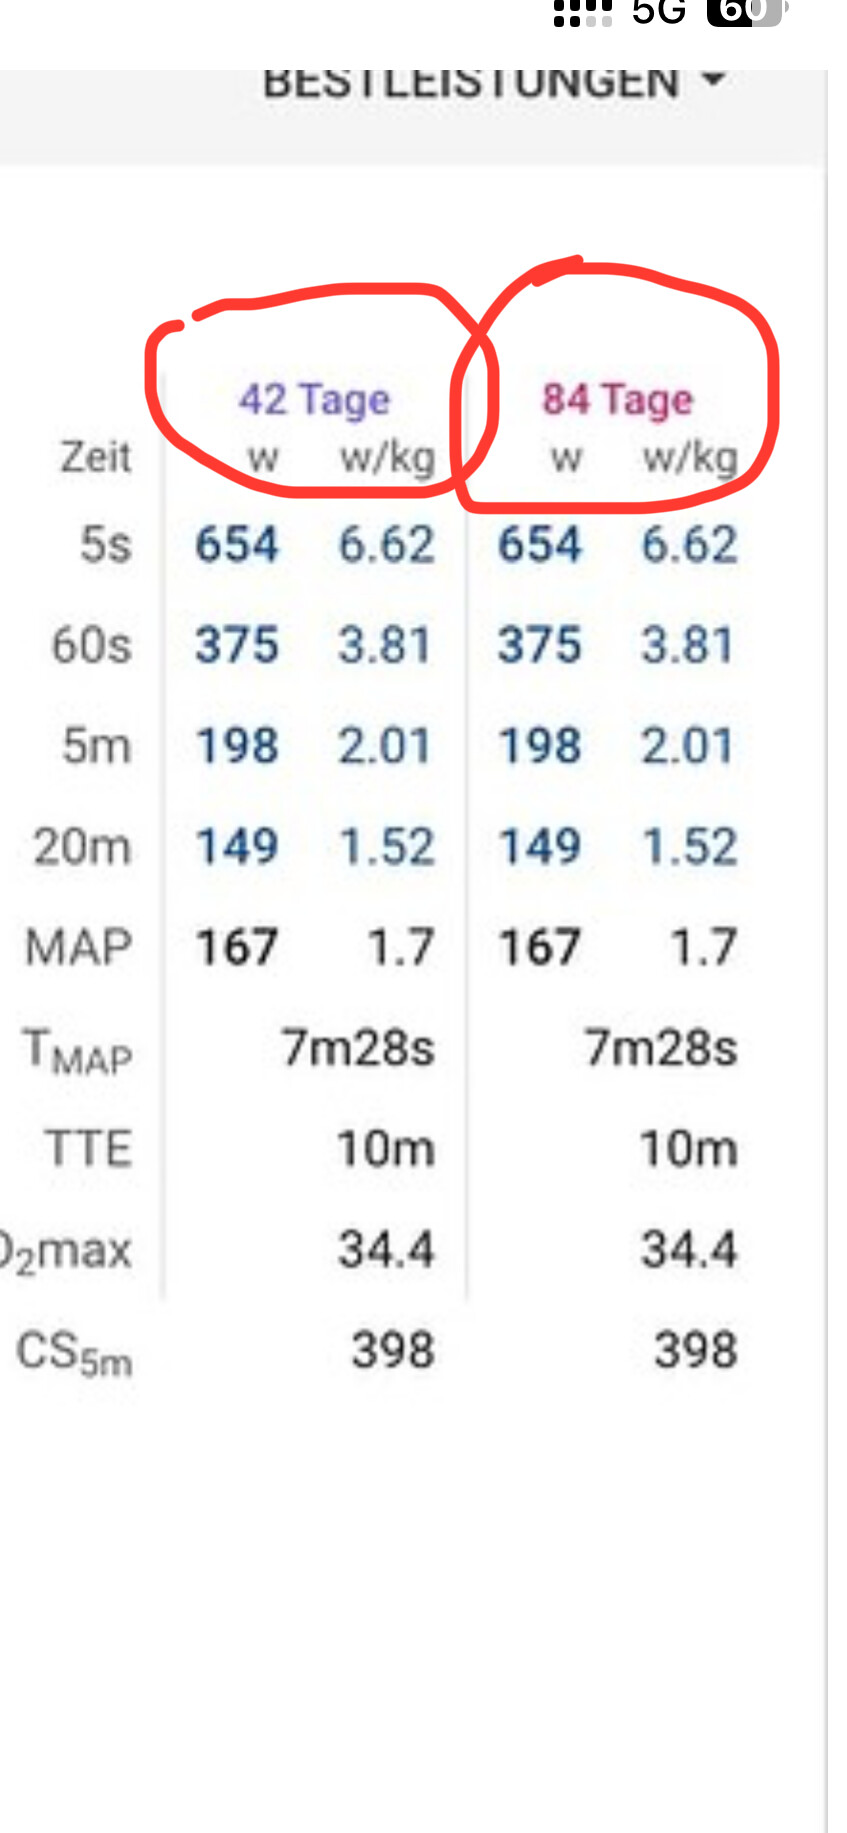
As @app4g has mentioned, your best efforts for each duration is the same for both periods. Look at your table showing each duration and you will see the data is the same.
If you want to see two curves, you would need to have a best effort in the last 84 days that is higher than the same effort in the last 42 days. Your recent best is within the 42 day window.
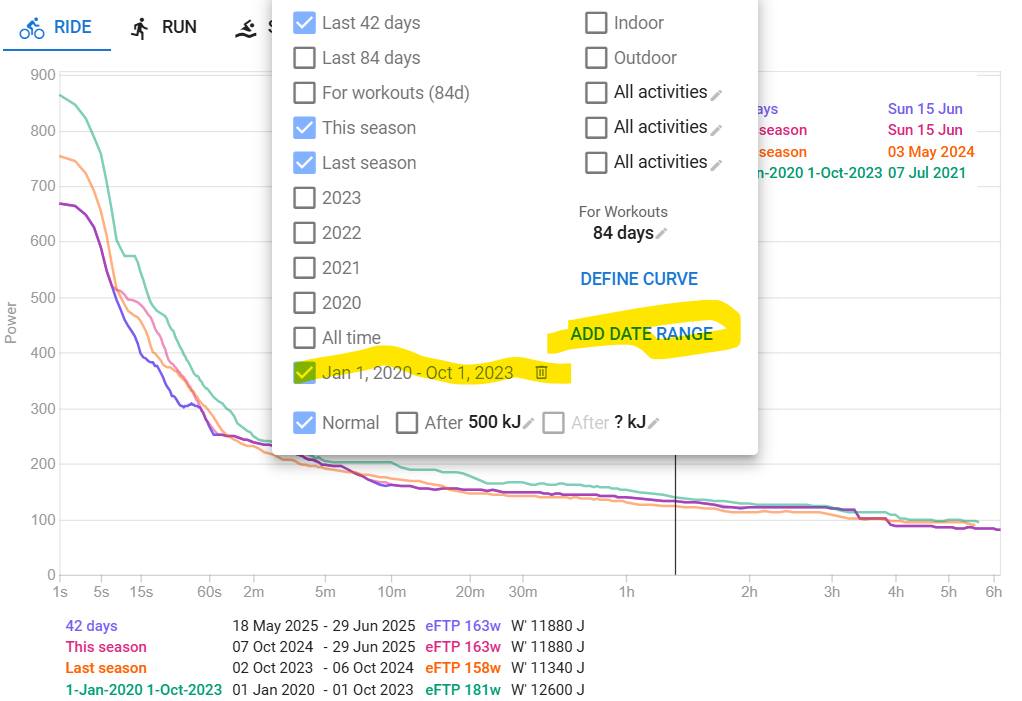
i like to see recent history (42d), This season, Last season and then everything before. I don’t like All Time because that mixes up things too much in my opinion. And I don’t like having a curve for each season either , because that get’s to crowded.
The operative word here is, I think, “that is higher”.
I was under the assumption that all curve values are displayed when a different date range is entered - but as far as I see it now, only the higher value (Watts in a certain time frame) will be displayed.
I will
gather more data points by adding trainings
play around a little with different date ranges.
BTW - is there a possibility to add an own range like:
Last 7 days
Last 14 days?
Thank you so much for pointing me in the right direction.
I am just learning right now - and I have to bee careful not to put too much effort into analyzing vs really creating datasets (e.g. getting on the bike and riding!)
Best regards from Hamburg germany - from an Austrian migrant.
They are, but if your best efforts of the last 42d are also the best for the last 82d, then you will see exactly the same curve. Just like it would when those are the best for the actual season. A best within the last 42 days, which is also a best within the last 82 days will be on both curves…
You can’t set up last 7d or 14d, only last 42 or 84 days.
But you can setup a fixed date range as you want. You could for example create the custom date ranges for Jan 25, Feb 25, … and then compare month by month.
My example above has such a date range for anything before Last Season. (I start my seasons beginning October each year because September is considered end of season and wind-down, October starts again with a base period)