You have at least that one not interpreted correctly: NP IS a 30sec rolling avg.
I do!! That wasn’t referring to NP. It was referring to decoupling and the previous poster said decoupling uses a 60s rolling average, which it doesn’t. I was just correcting that poster.
Decoupling does not require rolling averages. NP does.
1 Like
Then there is only one possible conclusion. Intervals has a (small?) difference in the calculation of NP that clearly shows for short intervals, but not for longer intervals compared to TP
Or maybe, TrainingPeaks has done something to NP to account for the problem described in the mentioned article?
I would be tempted to consider the second answer because they are really close to the avg power, meaning that the higher intensity of the preceding interval is almost not influencing the NP value. But can’t be sure if nothing is found on their site.
I think this is what you’re looking for
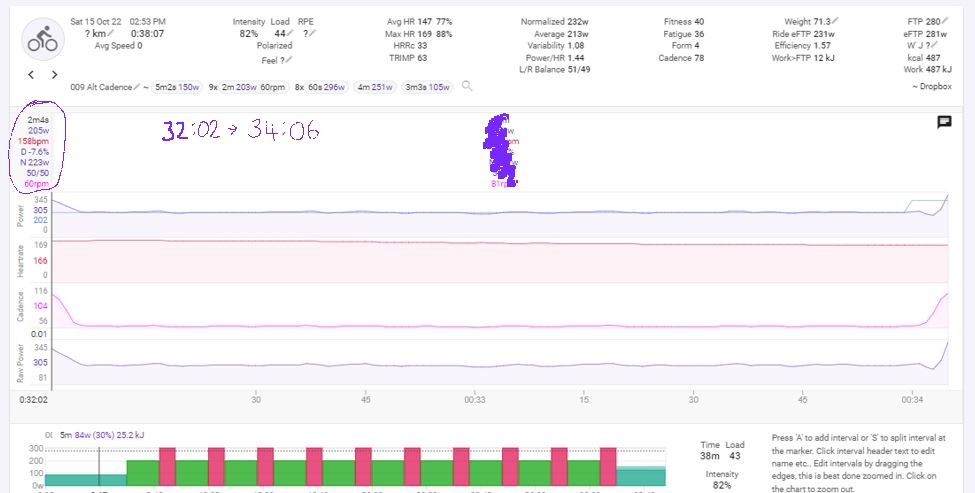
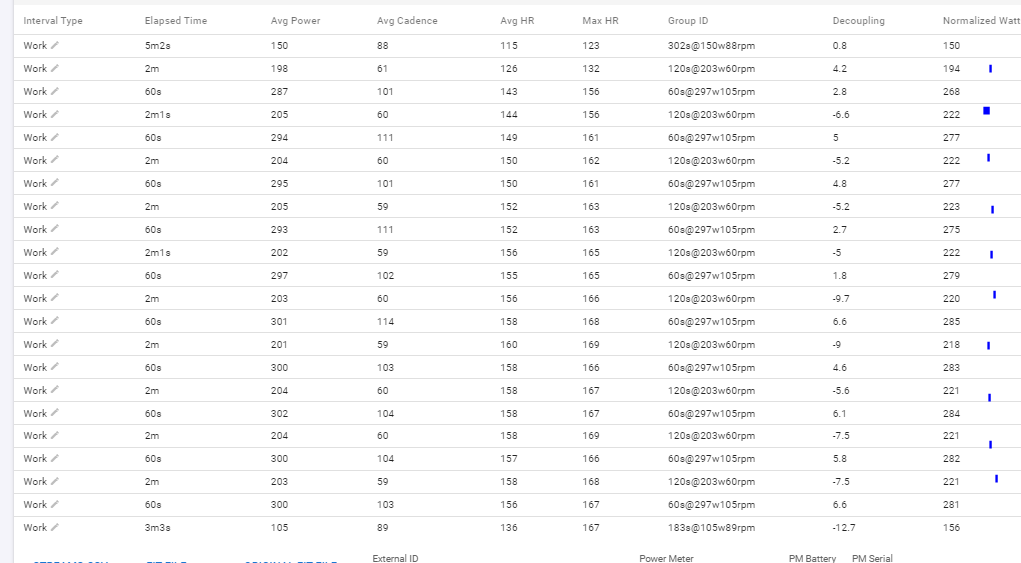
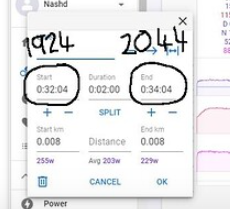
I’ve zoomed in o from 32:02 - 34:06 although the NP is calculated from 32:04 - 34:04 as can be seen from here:
Some info in this thread but nothing that can explain the difference:
Thx for the second screenshot. I just wanted to make sure that the power trace had no wonky data like spikes or missing values.
1 Like
Is it something worth looking into?
Manual calculations from the second by second data in the excel sheet provided at the link some posts above are consistent (well exactly the same) as Training Peaks. There is something funny going on with the intervals.icu NP calculations.
It’s all off again today from my session, which was a 4x8mins
Not off as much but by 3 or 4 watts every interval.
(I’m not saying Intervals.icu is wrong here today, just different from TP. TP could well be incorrect. I will analyze the raw data again later)
Intervals.icu calculates the 30s moving average for the whole power stream and uses that for each interval. So it doesn’t only use the data for the 2 min interval. It seemed to me to be the best way to do this especially for short intervals.
Ooof.
While that’s grand for short intervals less than 10 minutes I don’t see how it works for longer intervals, say 20 minute SS efforts or 30 minute Tempo blocks.
Accurate decoupling percentages are nice to have and analyse on those type of efforts as well as long endurance spins.
Is there any way this can be changed to be more like TP? Or is it way too much work.
Decoupling data is pretty meaningless so on intervals.icu unless viewed after a long steady endurance spin.
Hey @MedTechCD how did you make that chart seen in the photo? I guess it is power above/below FTP but diferent colours for each.
And do you know if is there a way to edit the charts code to experiment a little bit?
Also the charts option of moving average does it take also 0 into account? Asking for a sleep graph in this case (fitness ones)
Oh I think this graph may be the balance one. In case it is does anyone know if it is possible to do the same but with power below or above FTP?
It is the default L/R Balance chart.
For custom charts you can color the background but not the trace itself.
Hi @MedTechCD
How do I set the interval type to recovery like in your screenshot? I assume it’s something you do when building the workout?
Thanks
D
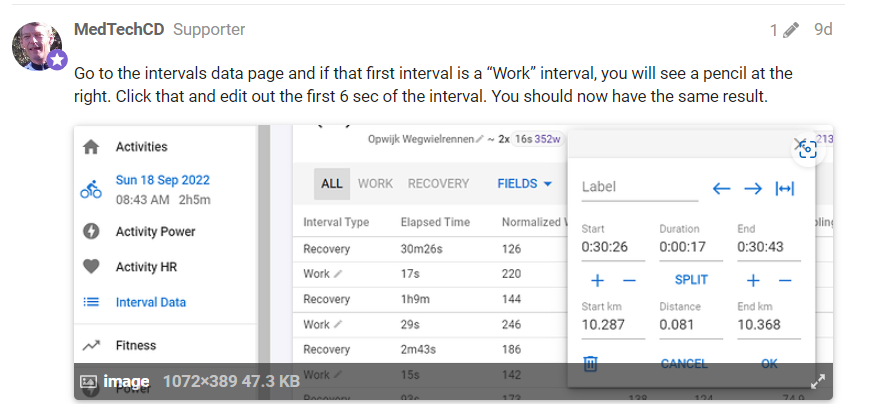
On the chart view, put your mouse cursor in the interval you want to redefine a a recovery interval and press ‘d’ to delete. It will now be a Recovery interval.
3 Likes
OK. Nice. That worked nicely. Now for the next question 
What does that do for analysis? Is it simply to separate the intervals out so all the ‘work’ intervals can be viewed together in the ‘work’ tab? Or is this ‘recovery’ data now not included in NP calculations or something?
It shouldn’t have any influence on the NP for the activity. That remains the same.
What it does, is setting a part of your activity to a ‘work interval’, meaning, it will be considered as an interval that can be searched for on the ‘Intervals’ page and give you a historical trend.
Hope you get what I mean because I fail to find a better way to explain 
2 Likes
Perfect! Thanks
I’m only after noticing this 

Folks
I uploaded a fit file to this thread before in csv format. I cannot for the life of me remember how I did it. Can anyone tell me how to view a wahoo fit file in csv format so I can get data from each second?
I did it before but can’t do it now
Edit - This site seems to be able to do it but I’m pretty sure I didn’t use that site before for this purpose
Convert FIT Files to CSV (gotoes.org)