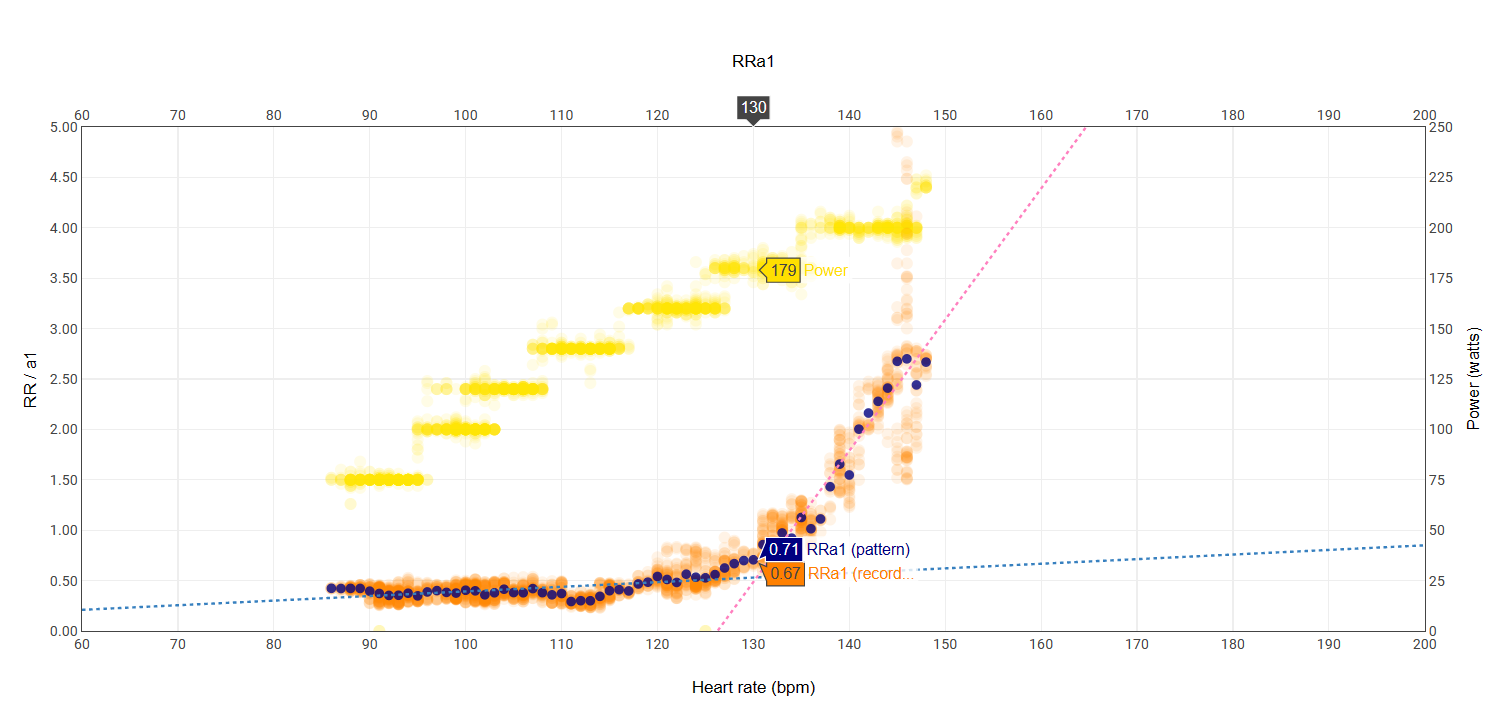
FYI: you can move both Power and RR/a1 charts up and down by grabbing the left/right axis. Putting them over each other with a linear Power chart, makes it more clear where the RR/a1 chart deflects.
You can also zoom by drawing a rectangle. Double click to zoom out again.
@Inigo_Tolosa Could you move the RR/a1 to the front so that it displays on top of the Power. At this moment, Power is the one most to the front.
2 Likes
Done.
Some tip for anyone creating charts with secondary Y axis. I created the chart trying to order series so that power was overlapped by RRa1 records series and this by RRa1 pattern. However plotly seems to draw first series in main axis and then series in secondary axis, so that series in secondary axis come to foreground. Now power is linked to main axis and RRa1 to secondary one.
3 Likes
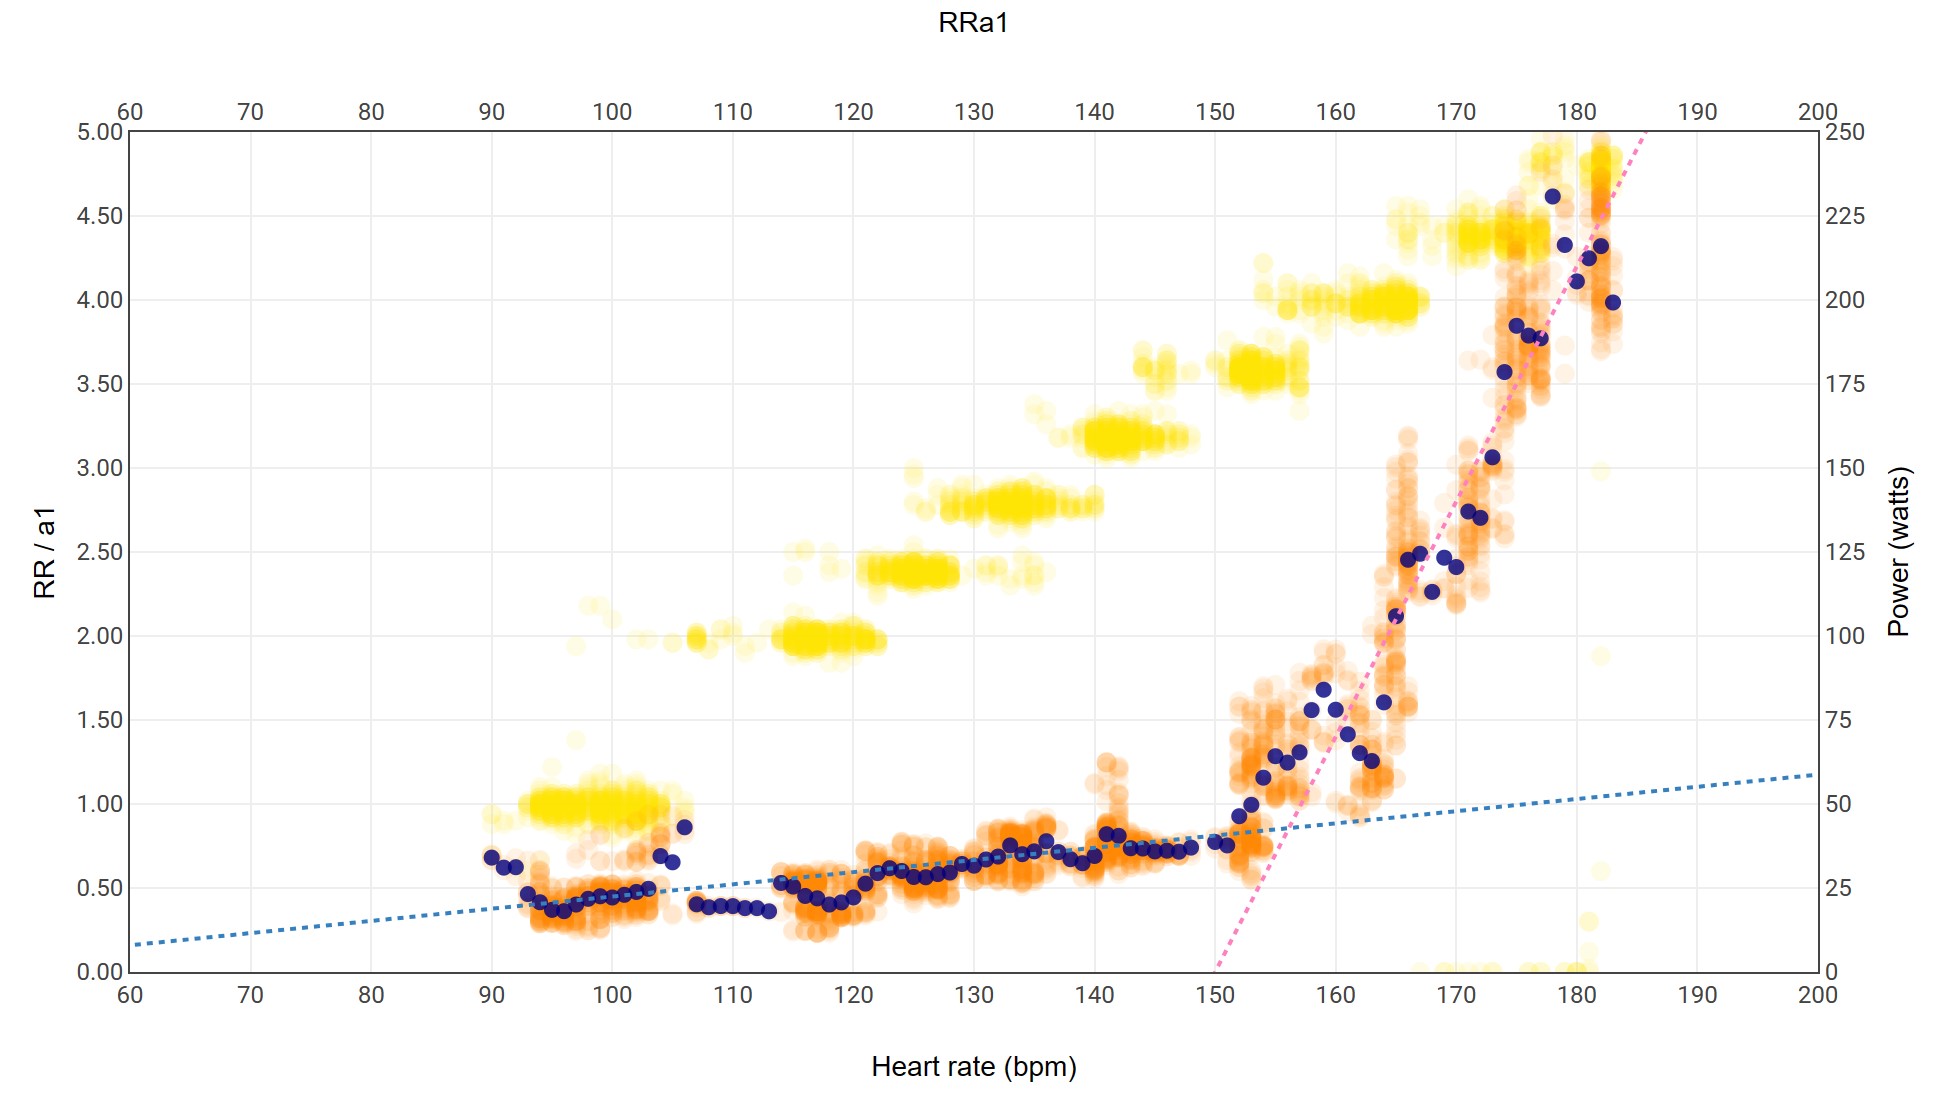
I have added an experimental feature to custom chart RRa1, so that now it automatically calculates and displays best bilinear regression.
Take into account that results will be only if raw data actually show this bilinear shape
I will share details this evening for anyone interested in adding regressions for his own charts
11 Likes
That would be fantastic. In the above example if it was mine I would take my Z2 zone as 125-147 bpm. Would you agree?
1 Like
1 Like
It did, but it’s not updating ‘on the fly’. You need to remove the chart (delete) and add it again to get the newer config.
Remember that when you add a chart or custom field to your setup, you are making your own personal copy of it!
3 Likes
Exactly. You will get also linear fitting then
I guess it doesn’t work for me.
240W is probably not my aerobic threshold, my anaerobic threshold is probably about 260W. Two years ago when I did a lab fitness test my aerobic threshold was 186W and 145BPM and my anaerobic threshold was 256W and 174BPM.
Can you put the averages of each interval?
| Elapsed Time | Avg Power | Avg HR | Avg DFA a1 | Avg Respiration |
|---|---|---|---|---|
| 361 | 49 | 89 | 1.39 | 25.4 |
| 360 | 99 | 100 | 1.39 | 29.0 |
| 360 | 119 | 107 | 1.10 | 29.2 |
| 360 | 140 | 114 | 1.09 | 28.5 |
| 360 | 159 | 121 | 1.25 | 33.8 |
| 360 | 180 | 129 | 1.08 | 37.0 |
| 360 | 200 | 139 | 1.07 | 39.2 |
| 360 | 221 | 148 | 0.86 | 43.5 |
| 360 | 244 | 160 | 0.75 | 48.7 |
| 360 | 261 | 169 | 0.57 | 57.0 |
If you want, I can send you the *.fit file or you can preview my profile here, if it helps anything. I can also send you my fitness tests, but they are from two years ago.
Awesome!!! Thank you very much.
One doubt: the crossing point of your chart is filled with measured points so the “reading” of a possible AeT it’s straight forward.
In my case, to be conservator, can I say would be safer to “read” my AeT a little bit on the left? Maybe one step down?
Really appreciate your work.
best regards,
Thanks for all the work done. I have been using the data field from a while and was really not confident about the validity of 0.75 and 0.5 values to detect the thresholds. I did my own research but I am very glad you both guys are addressing the problem from a different perspective than mine. Without any further ado, I am catching up with the discussion, but so far I have some comments.
- Last week I did a little ramp to play with the data field, so I did the test with some cavalier attitude and with some info gathered here and there. At the end of the day, the ramp was the following
10’@55%
6’@60%
6’@65%
6’@70%
6’@75%
6’@80%
The 10’ was the warmup, so it turns out I started off way too high and quit the test too early. After reading some replies, I am now aware of what is the protocol you are using. The result of the ramp is contained in the attached plot and it is basically useless (lap1 in the plot corresponds to the 10’ interval and so on). This is just to reinforce the GIGO concept.
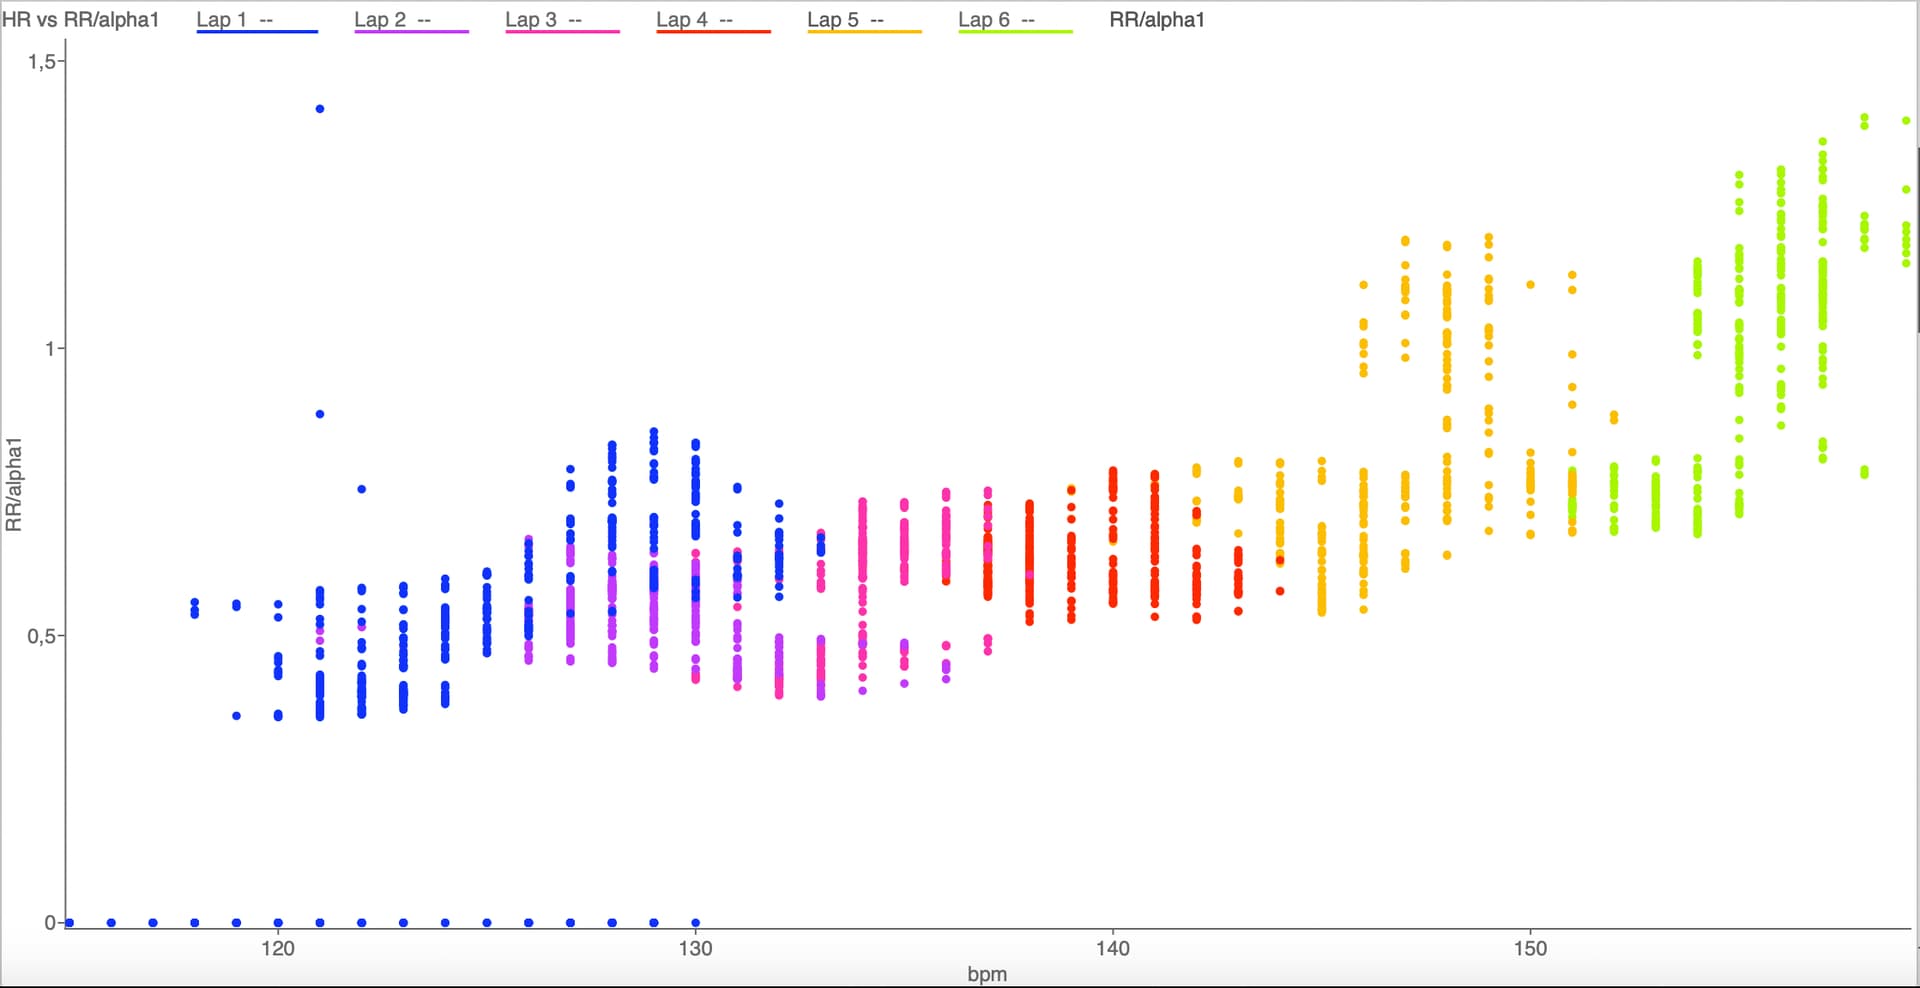
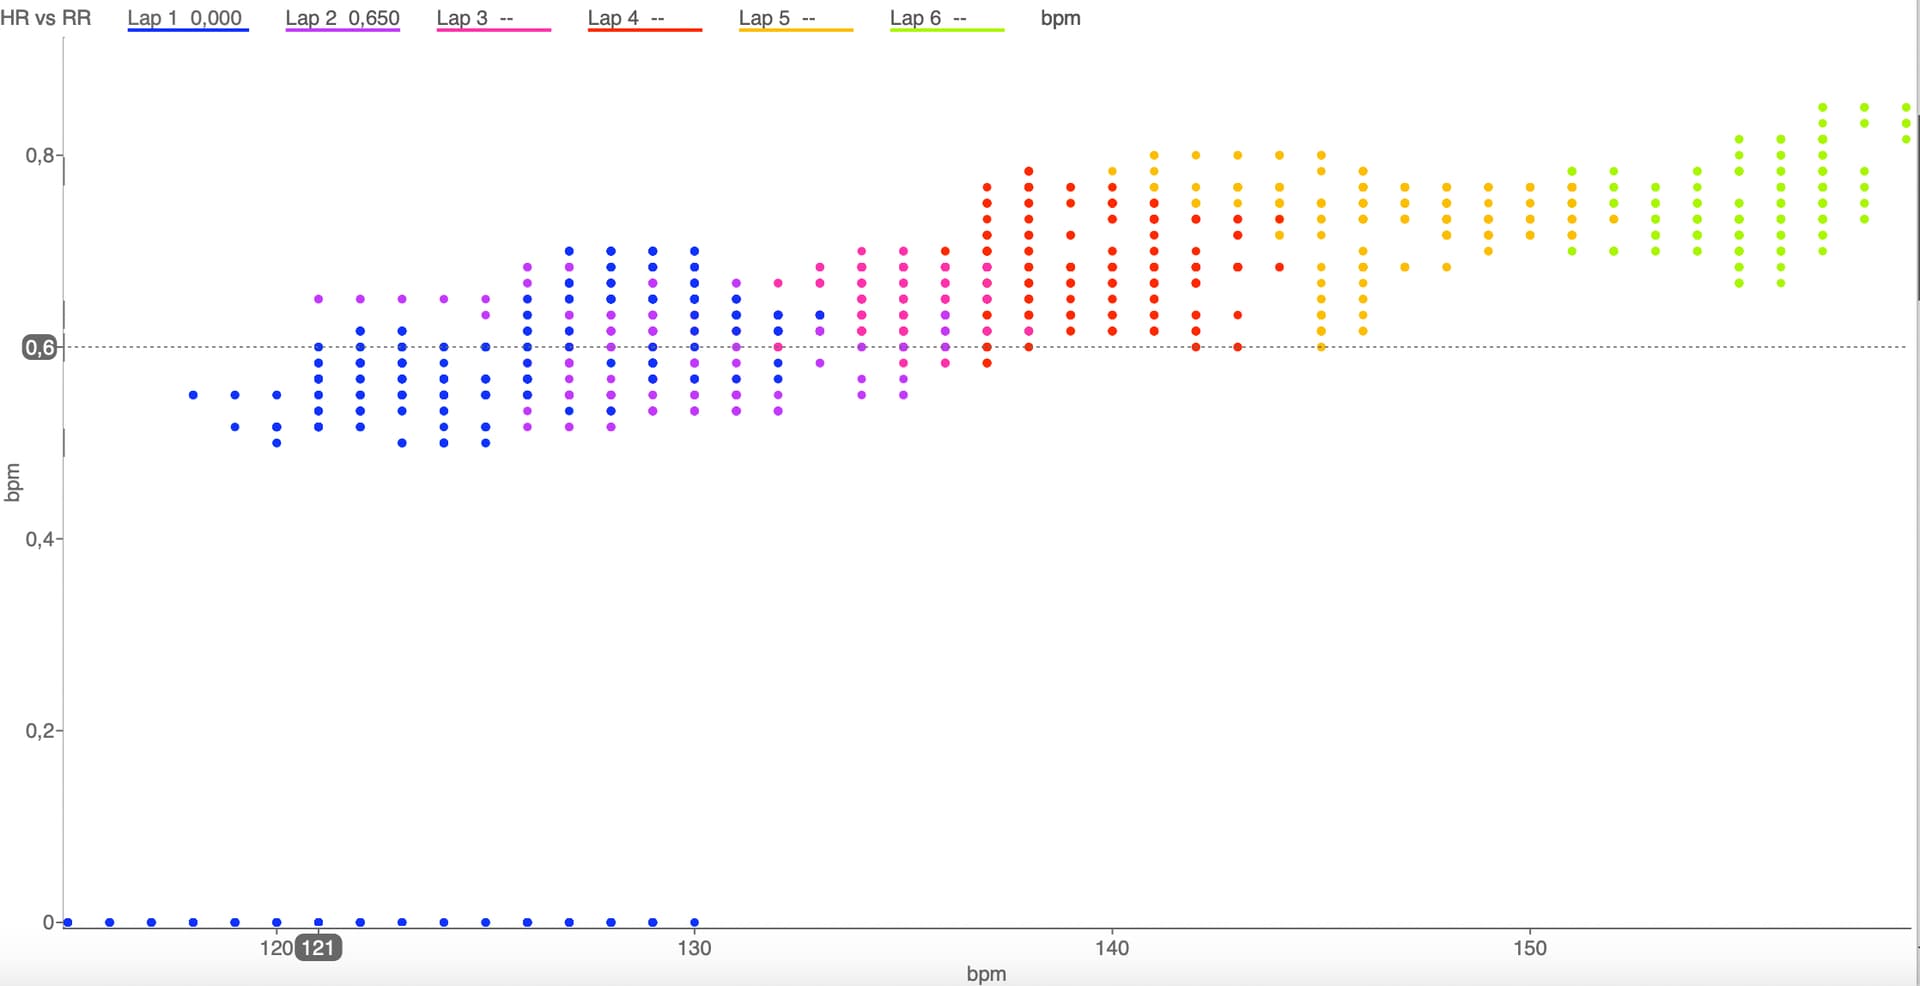
- I have some experience with DFA and I know it is basically a PITA both from a theoretical point of view, for instance you need to detrend the series, and from a computational point of view, a FIR filter can be computationally demanding, leaving aside ad hoc choices for tuning parameters. From one hand, I think that using RR/alpha1, so sticking to DFA, is needed to bring in the equation HR/HRV. On the other hand, sticking to DFA entails to come up with a proposal that is going to have some of the weak points that the original proposal has. I am wondering why not just to rely on a HR vs RR, since you have just done a terrific job in getting RR right. Regrettably I cannot have a proper ramp to play with and I am just attaching the plot HR vs RR from the ramp I had. It is hard and meaningless to compare those plots, given that the ramp is not good, but given that alpha 1 has a limited practical range, I am not expecting a big difference in the trend
1 Like
Send it to me at luisma.gallego@gmail.com, it should be around 200-221w with the naked eye.
I sent an email. I doubt I have an oxygen threshold above 200W. I would like to, but after an hour of riding at 200W my heart rate will be close to my LHTR 
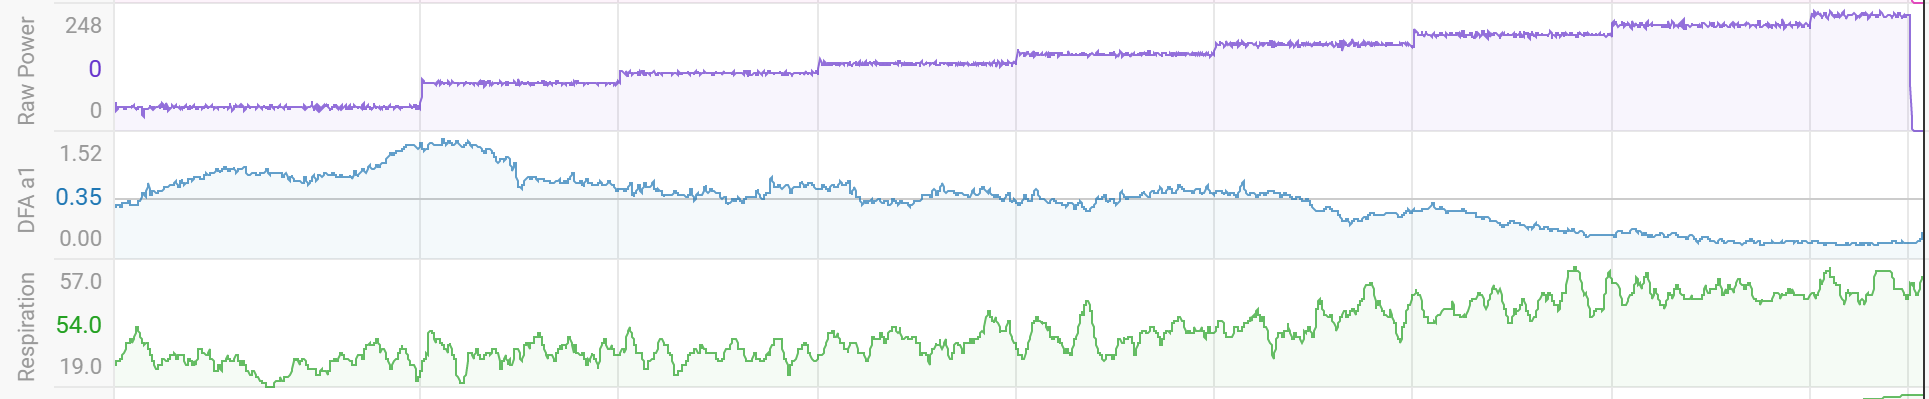
If you see stuff like this: (red line)
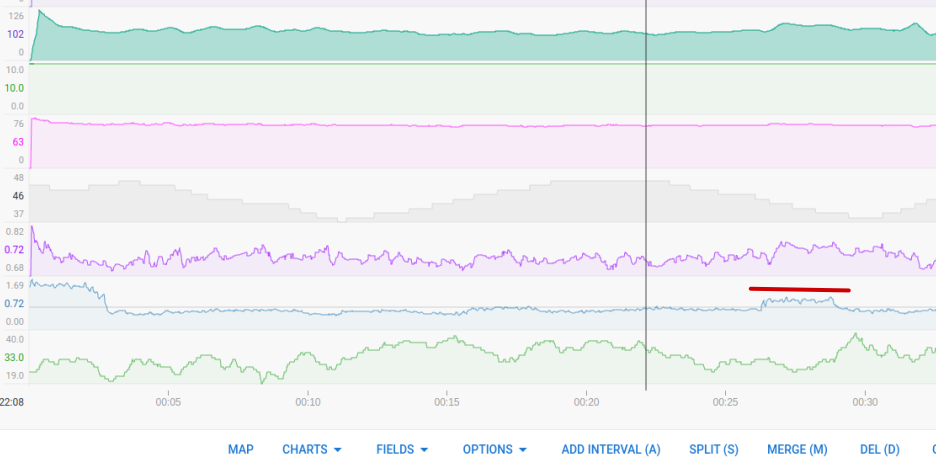
Better be cautious. The double step in dfa-a1 means that there was an uncorrected artifact.
It also means that RR is uncertain because RR is derived from HRV.
The signal quality and artifact correction is very important to get something meaningfull.
You should always look at a1 and RR separately before interpreting RR/a1.
Are you replying to my post?(sorry, I am new and getting confused about how the replies work). I am not aware about how RR is calculated but if it depends on HRV data, then this reinforces my point in trying to get rid of alpha 1 or to come with a cleaner solution. Indeed, assuming RR is estimated from HRV data, we are in a setting in which we use two measures - RR and alpha 1 - derived from the same input, and RR is calculated on a 60s window, while alpha 1 on a 200 beat window (just referring to custom values).
I am not criticising the work done, also because I haven’t seen the actual procedure, just trying to use in a constructive way my statistical background and, if possible, to help out.
Sort of, but it is important information for everyone…
There’s still a lot to be learned on this subject. What we know now for 99% sure:
- a1 is a metric that gives information about intensity. The initial tought that it had fixed points for a broad population, has been proven wrong but we can’t dismiss the fact that a1 goes down when intensity goes up. Another problem is that a1 measurements are very prone to even one single artifact.
- Ventilation has been there as an intensity marker for a long time. But we don’t have easy affordable ways to measure it consistently. That’s a bit strange because technically it shouldn’t be to difficult to measure breathing rate. But ventilation is not only breathing rate, depth of breathing also influences ventilation.
AlphaHRV is doing a pretty good job in measuring a1and breathing rate. But there are a lot of HR sensors that are not up to the job simply because they were not designed for this purpose. They were designed to detect R-peaks and count them. Combine that with movement during exercise and the faults quickly accumulate. RespRate in alphaHRV is calculated based on the fact that inter-beat intervals become longer when breathing out (HR slightly lowers) and shorter when breathing in. HRV in other words. But again very dependent on correct detection of inter-beat intervals.
With good signal quality, both a1 and RespRate measurements have, in my opinion, a good chance of leading us to a very good estimation of the VT1 point. Combining them, amplfies the deflection point that has been correlated with lactate results.But there’s still a long way to go to make it user-proof.
All initiatives to improve measurement of a1 and/or RR are welcome. I’m experimenting with deriving RespRate from single lead ECG recorded with a Polar chest strap at the moment. The inconvenience is that, for now, this can only be done on a pc, so only indoors. But doing this on a pc indoors, also gives acces to more demanding computing power, required to do better artifact correction for a1.
It’s way to early to say anything meaningfull now, but I would like to compare the results from alphaHRV with those from a pc computed a1 and some other more solid measurement of resp rate.
In the mean time, anyone with recent lab results that is willing to test this, can give valuable information.
You have all the tests on Bruce Rogers blog, think that it is being calculated on a device with a low processing power, the tests comparing with other devices were quite good, also the threshold is not calculated through Dfa , calculating a threshold through Dfa is a very big mistake.
1 Like
Thanks. Looking at the lines that are put on my graph, my view is that its more nuanced than just fitting 2 straight lines. On this graph Point A is at 83% HRmax and at 175.180W. From how that feels it is far harder than I would think LT1 should feel. It’s far more like the Lactate Balance Point (Low Tempo 'E") which Steve Neal works with. From lactate and gas tests in the past my feeling is that the 1st inflection point is at B and my VT1 is at C giving me a Z2 of around 125bpm to 135 with the power levels to match. Without doing a simultaneous lactate test its hard to be certain though.

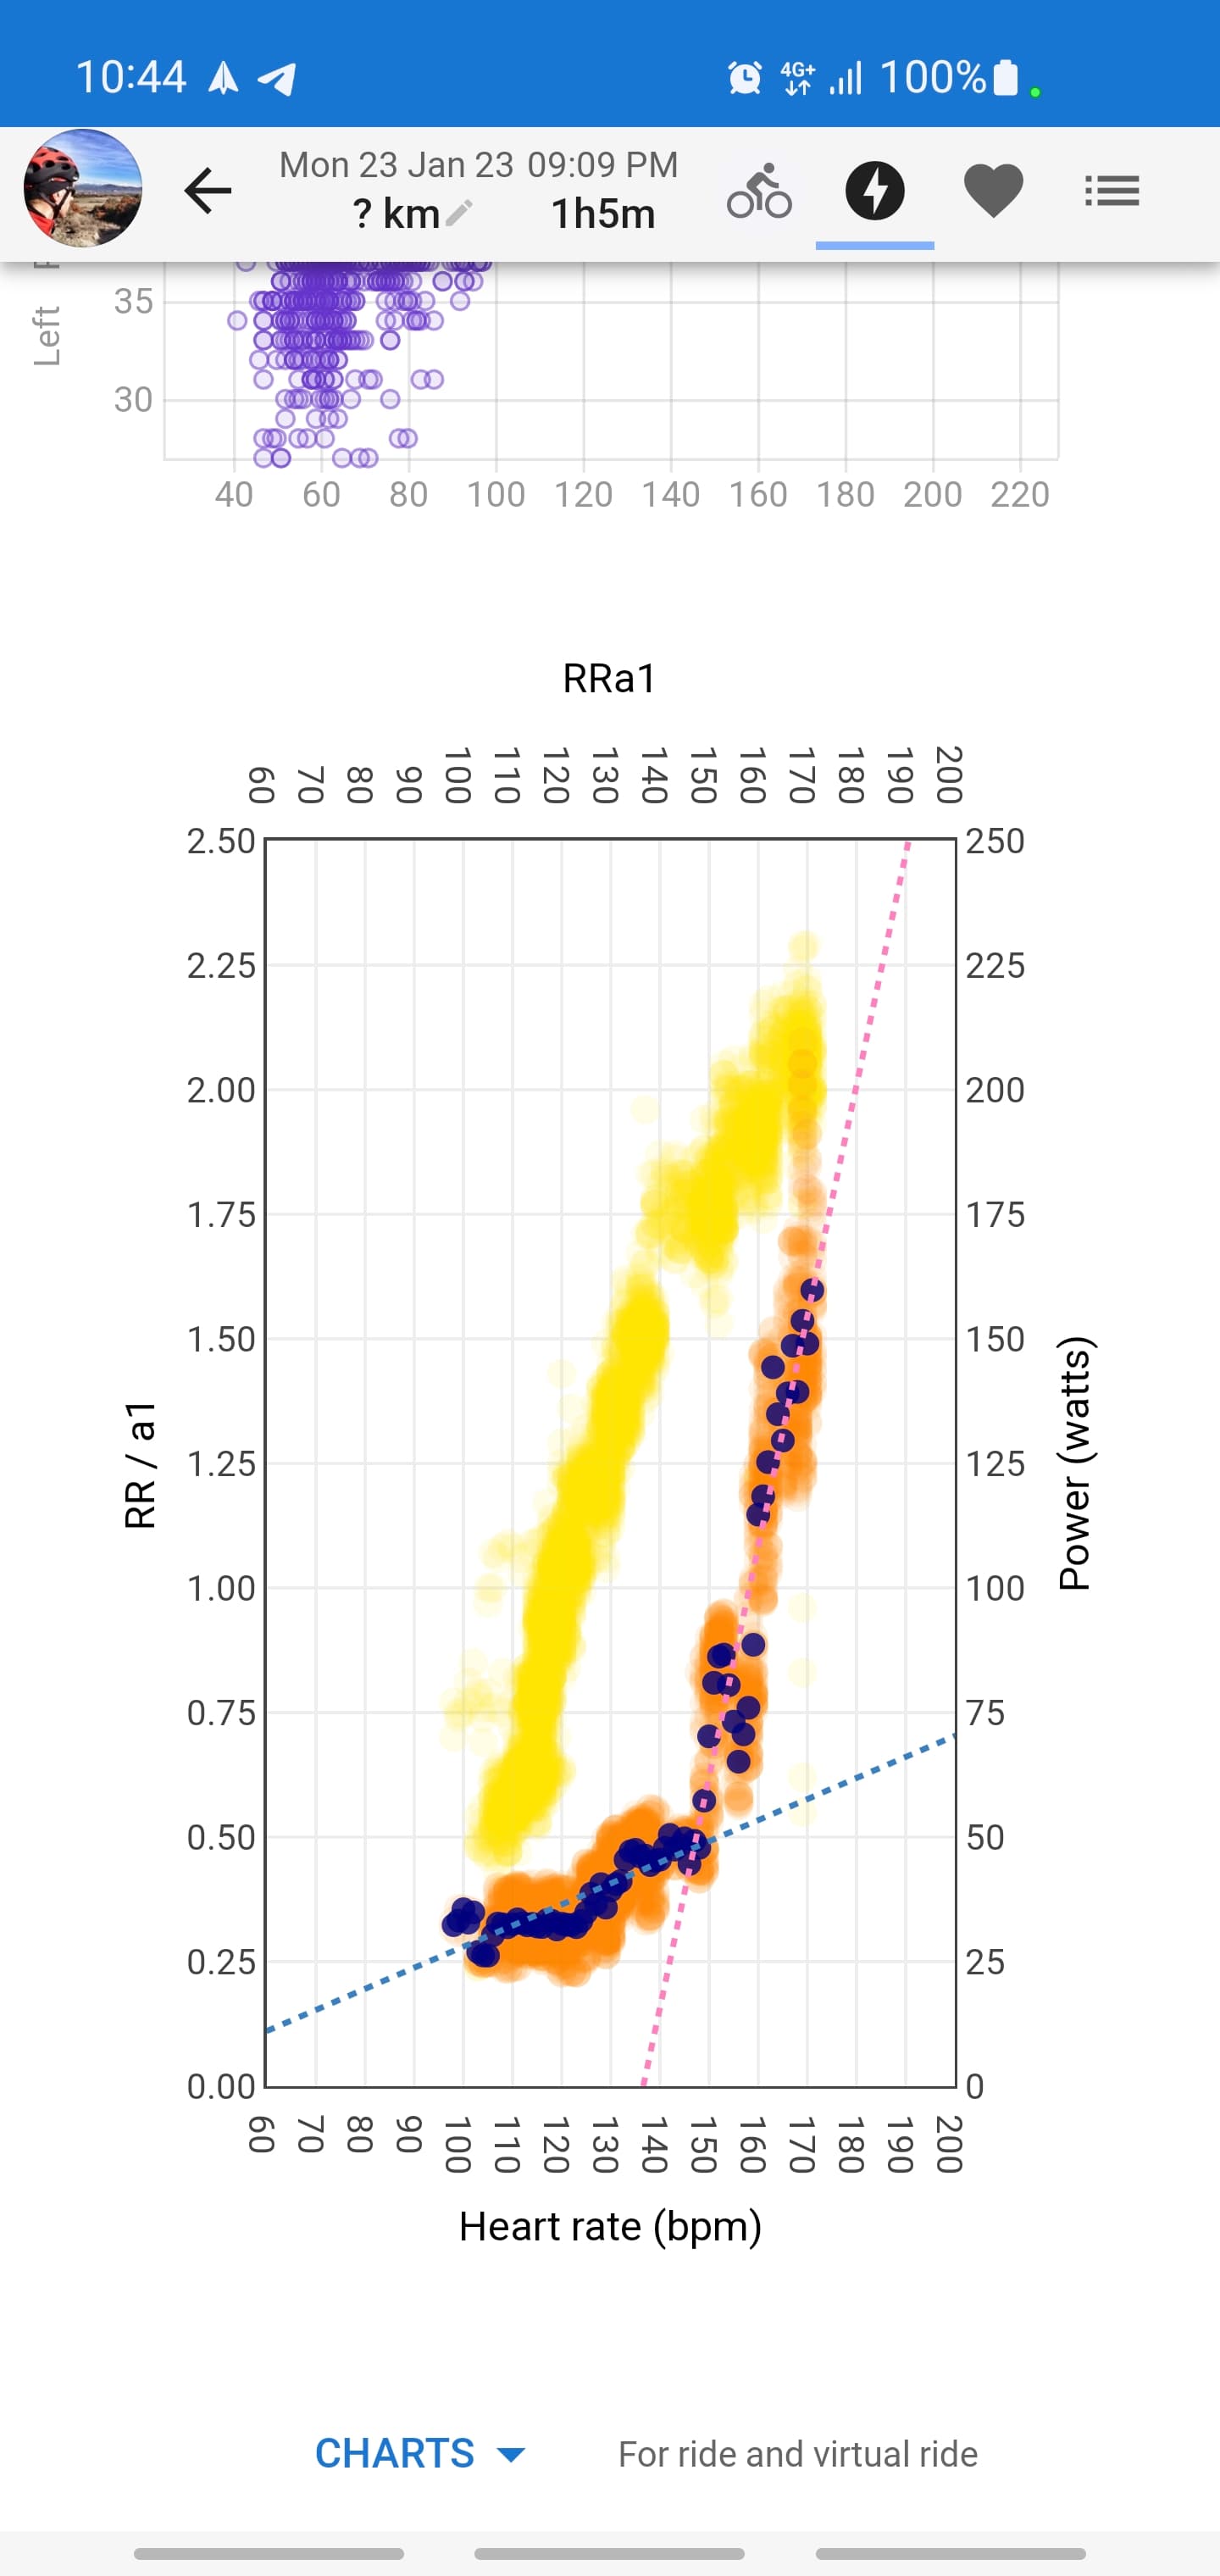
Hello Guys, @Inigo_Tolosa @Luisma_Gallego_Soy_P great work thank you!!!
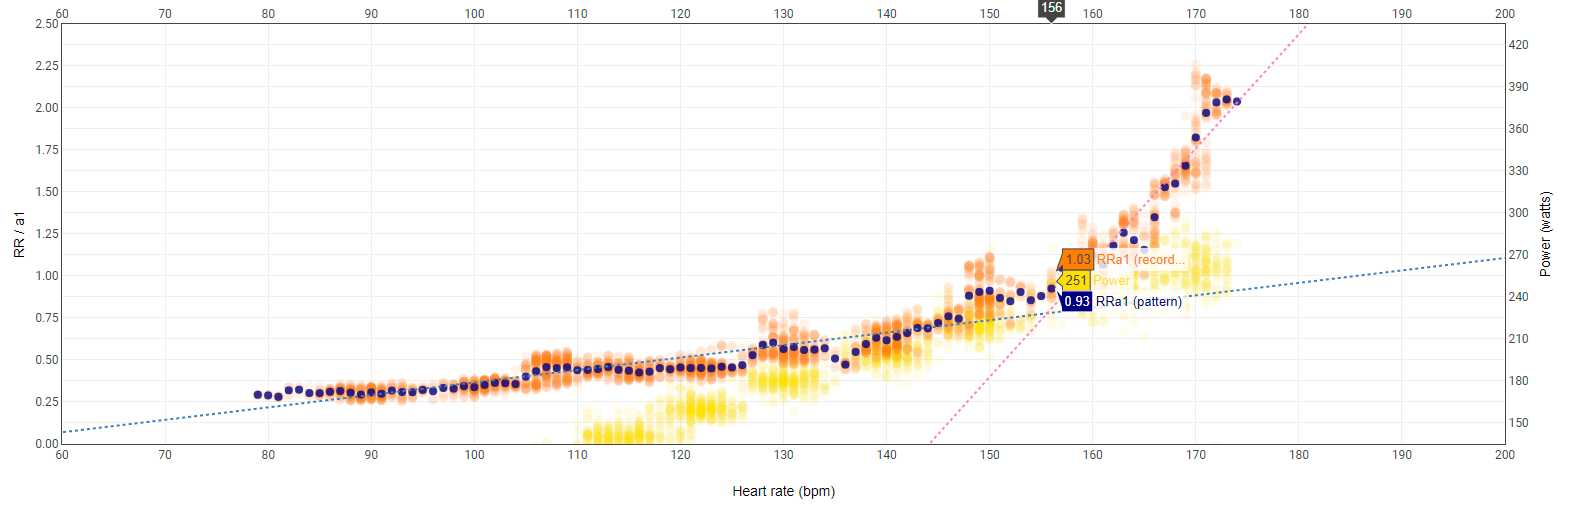
This was my test today:
For me, the crosspoint on the graph (156bpm, 205w) is a lot higher than my LT1 measured in the past which was like 140bpm, 150w… I am not fitter at this point altough I was training at 150w during several weeks so far… So please can you help me to interpretet the charts? What info can I get from this crosspoint? Is not a threshold I know, but how can I use it?
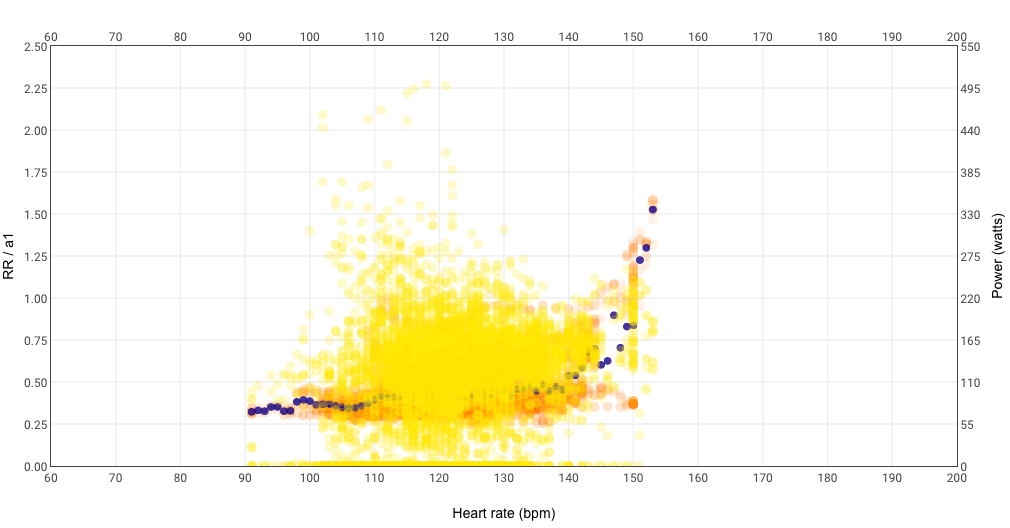
My a1 and RR of the test:
Can I get a chart with artifacts too? I know from Garmin Connect that artifacts were very low and present mostly at the first 7 minutes… I have used a Polar H10.
Please any help would be appreciate it!
Maybe I did a mistake doing a test with very high power steps for me at the end? (I think my LT2 should be around 200w-210w which make my last step 120% higher), and then my RR/a1 curve get steeper, changing my curve? Do I haver to crop the activity and deleting last 2 steps?
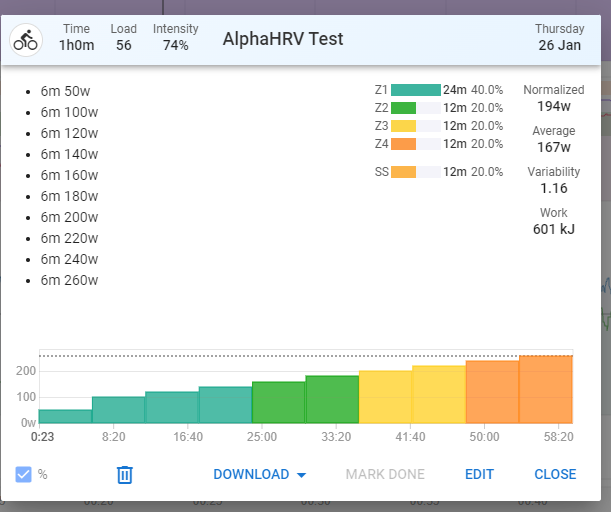
Protocol:
50w
100w@6min
120w@6min
140w@6min
160w@6min
180w@6min
200w@6min
220w @6min
240w (Cannot hold any more… higher than my LT2 for sure!)