FR935 has a limitation for data fields size of 64kb, not enough for alphaHRV. This constraint does not allow even building the app for this device
Sorry.
1 Like
A very good article reinforcing the importance of this work of yours.
1 Like
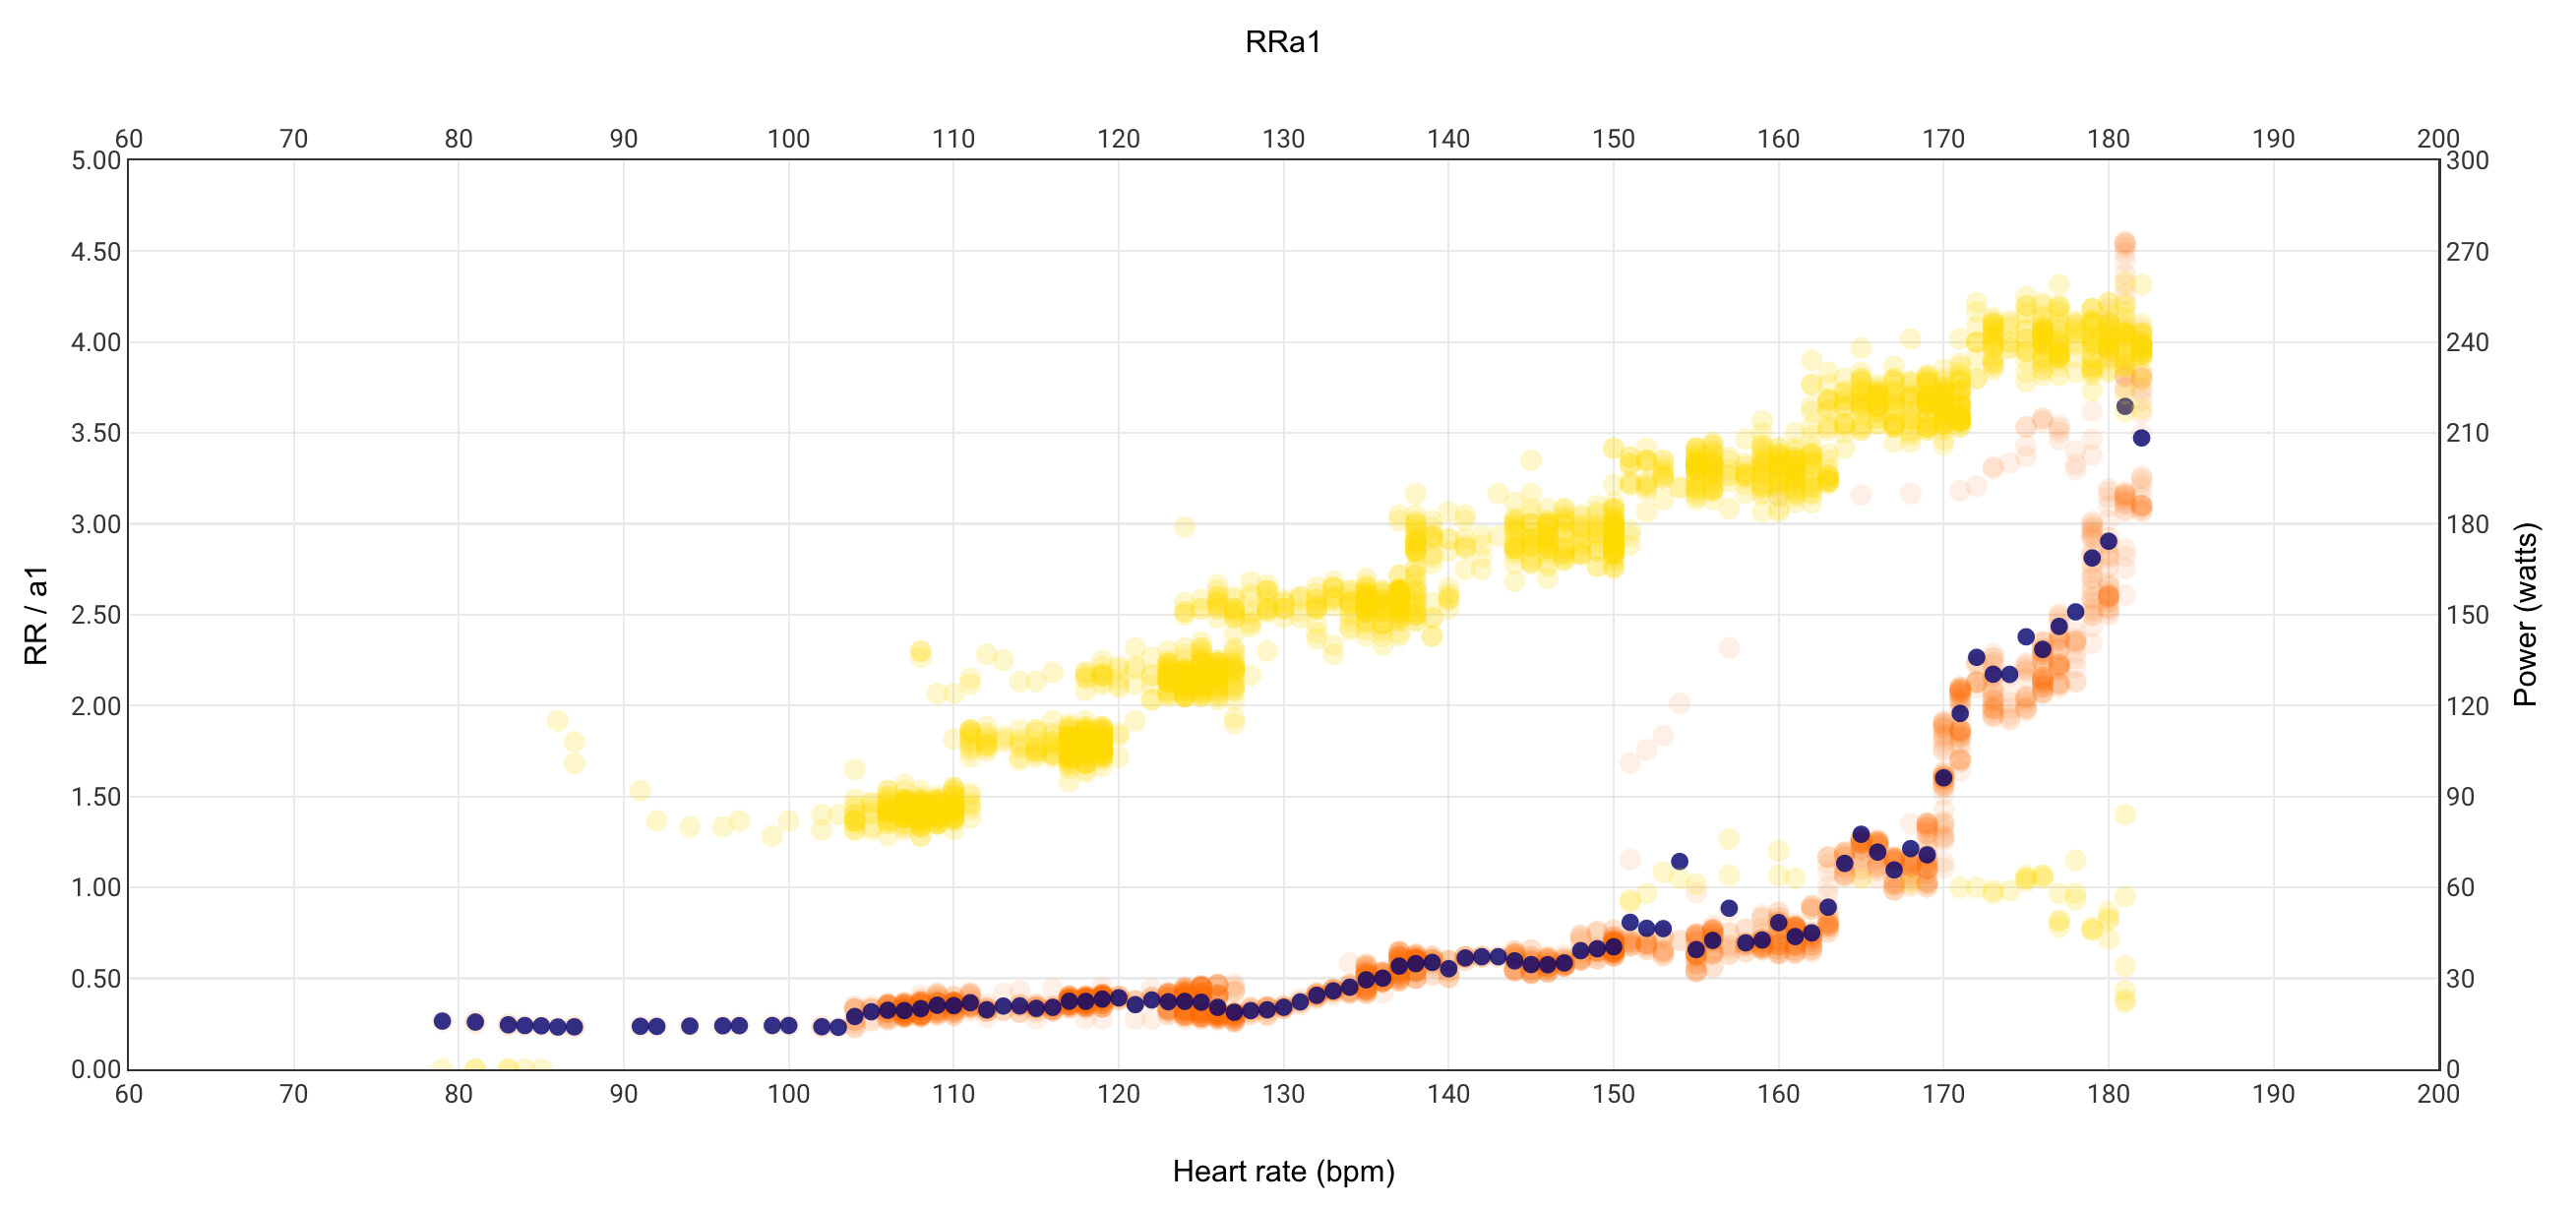
I have just shared a custom activity chart that plots RRa1. It is similar to the matlab script shared yesterday, but now integrated inside your intervals activity Power page.
Look for RRa1 if you are interested
18 Likes
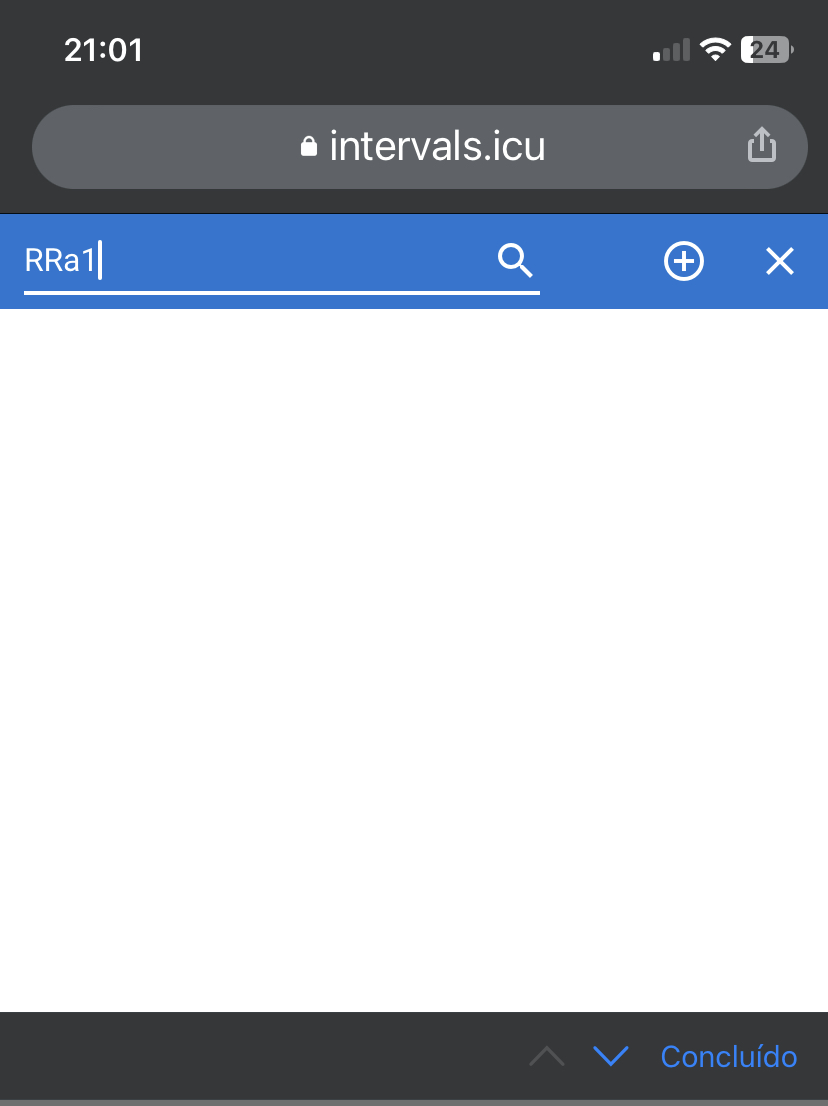
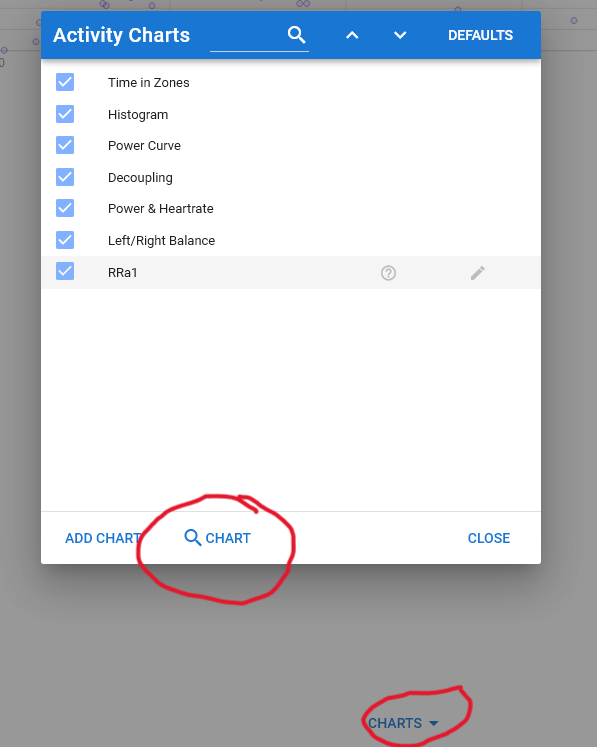
Click on “Charts” at the bottom of Activity Power, then select “[magnifying glass symbol] Charts” in the pop up window, then select RRa1
2 Likes
My bad.
I was at fitness page …
Tks
is incredible! How can I modify this chart so that it shows pace instead of power?
1 Like
That is fantastic. It will save me so much time messing around with Google sheets.
Thank you
@Inigo_Tolosa Great work and thanks!
I would like to share some observations I made over the past week.
I performed a ramp test with the idea of re-determining my VT1 via HRV. It was measured at 210-220W two months ago in a lab. Accordingly, I started at 180W and did steps in 10W increments to be as exact as possible. Unfortunately, I don’t have a turbo with erg mode, which turned out to be quite a factor in my opinion.
The last step was at 250W, which is surely above my VT1. However, I couldn’t get the same obvious change of slope that other folks have reported. Correct me if I am missing something. Below are the stats:

I chose 3 minute-steps, subdivided into one minute of “settling down” and 2 minutes of measurement. The test was performed fresh.
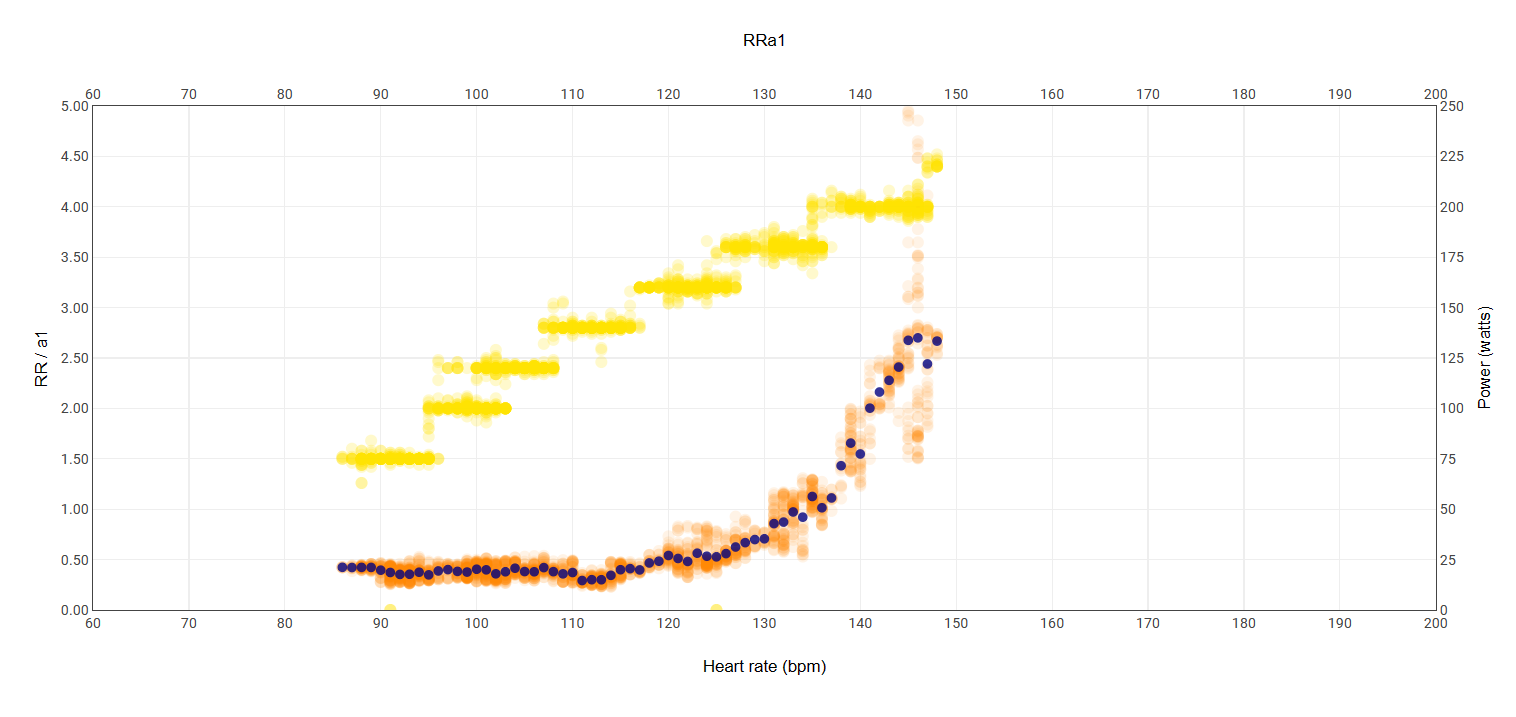
Here is Inigo’s chart cropped to only the relevant bit of the activity. On a side note: I am not sure if this is possible, but maybe adding a slider like in the decoupling above to filter data would not be that bad.

Here, you can see by the power-hr scatter that it is very hard to stay exactly at a given wattage without erg mode, even though I concentrated quite hard to do it. Could it be said that the threshold is at ~133bpm (that would be fairly accurate)?
And as a final note, here is the alpha HRV screenshot (exact same data) after the test:
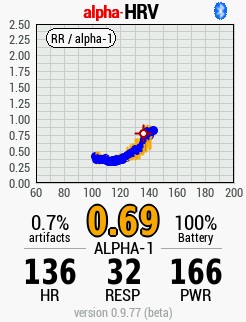
The trend here is quite different, indicating a change of slope at ~120bpm, which would be too low.
Looking forward to comments on:
- why the two cahrts are different (trend extraction)
- what I could do to get a “clearer” picture
PS. I absolutely love the spirit of this forum 
1 Like
Both charts are the same one except for very low HR, that is only present in the alphaHRV screenshot.
The apparent shape difference is only due to the different size of both images
1 Like
I think you should use a totally different test, first, why do you start at 180w, why do you do two minutes? Use the test we are using to do the tests, 5-8 minutes of warm up on 50w and then you can start to increase between 15-20 watts every 6 minutes, in two minutes you don’t let any parameter stabilize, with the chart what you will see is an approximate, then you will have to adjust with each step looking at the average values of each one.
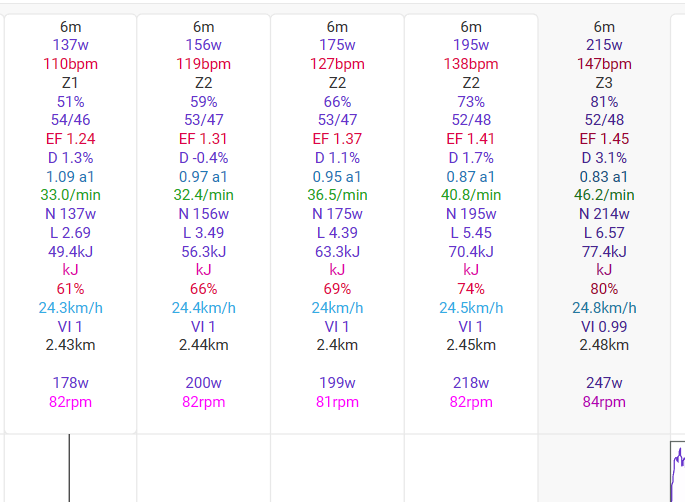
If you look at each step, you will see very clearly where the first major trend change occurs, if you make a graph of the respiration rate and dfa separately you will also see that it all occurs in the same place, exactly in step 8, as we have everything stabilised thanks to the 6 minute steps we can set the first threshold limit at 195w and 138bpm.
1 Like
If you also put a graph with dfa and respiration rate and do a smoothing of the same time as the steps it is very clear where the two changes in dfa and respiration rate occur.
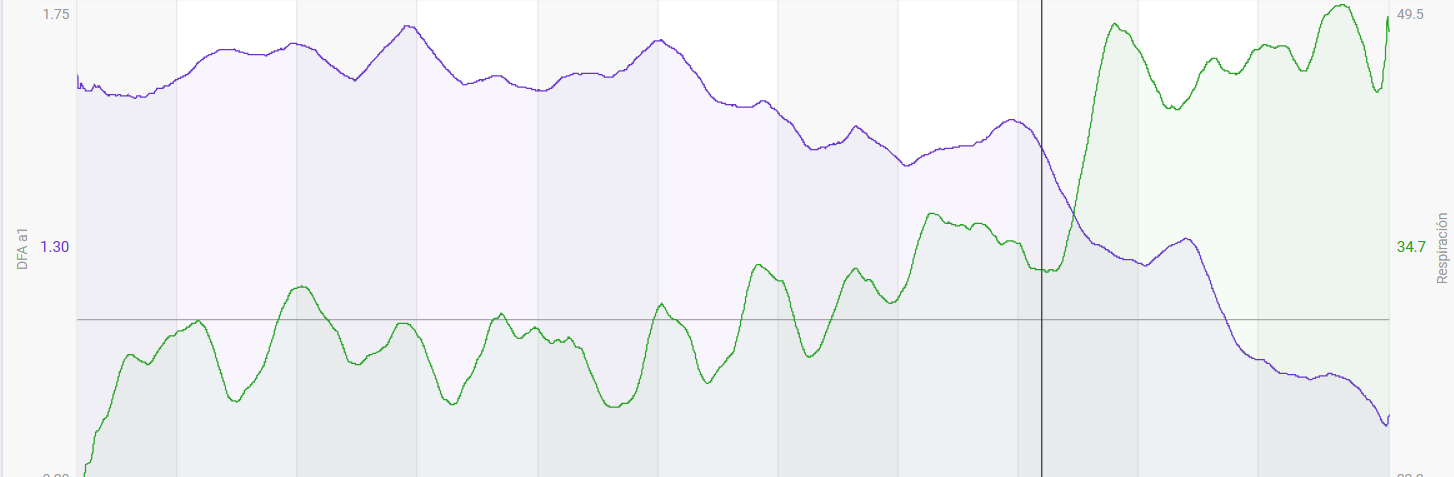

1 Like
Thanks for the info, the 3 minute steps were arbitrary to be honest. I will redo the test with 6 minute steps as you suggest. So start very low (50W) and then how high should I go?
Imagine that it is something similar to a lactate test, try to warm up for example for 6 minutes at 50w and then go up from 100, 20w every 6 minutes, if you reach 100% of the ftp you have enough to be able to draw conclusions from the first threshold.
1 Like
Modify assignment for pwr to map pace stream and adapt legends and range for yaxis2 accordingly
1 Like
I use a Garmin HRM Pro Plus and can use AlphaHRV, but unfortunately only with Ant+ protocol configured (while BT is used to connect to the watch).
Using it the other way round would be my preferred scenario, but it’s not working. AlphaHRV just shows “searching”. I ensured that the HRM Pro Plus is not connected to the watch or smartphone via BT.
I’m using Runalyze in addition, there you can look at the Aerobic Threshold as well based on RR intervals. When HRM Pro Plus is connected via BT to the watch, also Runalyze cannot show the Aerobic Threshold. I can see that all HRV / RR related data is missing, when BT is used.
That might be the reason, that Garmin HRM Pro Plus can only be used with AlphaHRV, when the watch is connected via BT and AlphaHRV via Ant+ (can only be solved on Garmin side, not on AlphaHRV side  )
)
1 Like
Putadón, no hay stream de ritmo xd
No lo he comprobado, pero puedes usar el de velocidad.
Y si quieres calcular el ritmo es muy fácil a partir de la velocidad.
Hay también algunos post de estos días sobre cómo dar formato a los valores de ritmo si quieres que en el eje no salgan con formato decimal
Ánimo que no es difícil.
Amazing tool! Tks.
Can you give some interpretations insights?
Is the gentle or the acute rise that possible mark the VT1 point?
Please what you would say to be mine?
Thank you,
If that was my graph I’d take a conservative view and put my Aet at about 115bpm and therefore my Z2 would be 115- 130. Other people might have different views on it. No matter which method is used it appears it always needs a degree of interpretation. Is that roughly where you thought it would be?
3 Likes