hi, I’m not sure this to be relevante but I’ve seen people using percentage and others using fixed (varied) targets on the test.
If relevante, what about we all conduct the test using the same protocol?
I’ve use Luisma’s but starting with 75W once my turbo on ERG and in the middle gear minimum wattage to be 75W.
Changing gears on ERG always cause huge power spikes.
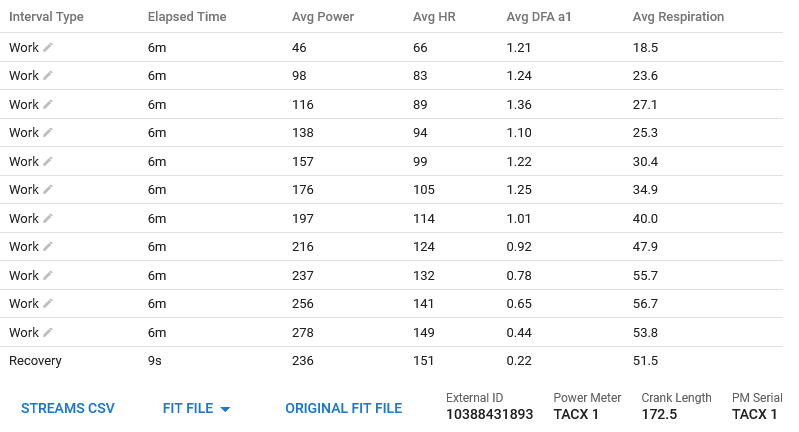
- 8m 75w power=3s
- 6m 100w power=3s
- 6m 120w power=3s
- 6m 140w power=3s
- 6m 160w power=3s
- 6m 180w power=3s
- 6m 200w power=3s
- 6m 220w power=3s
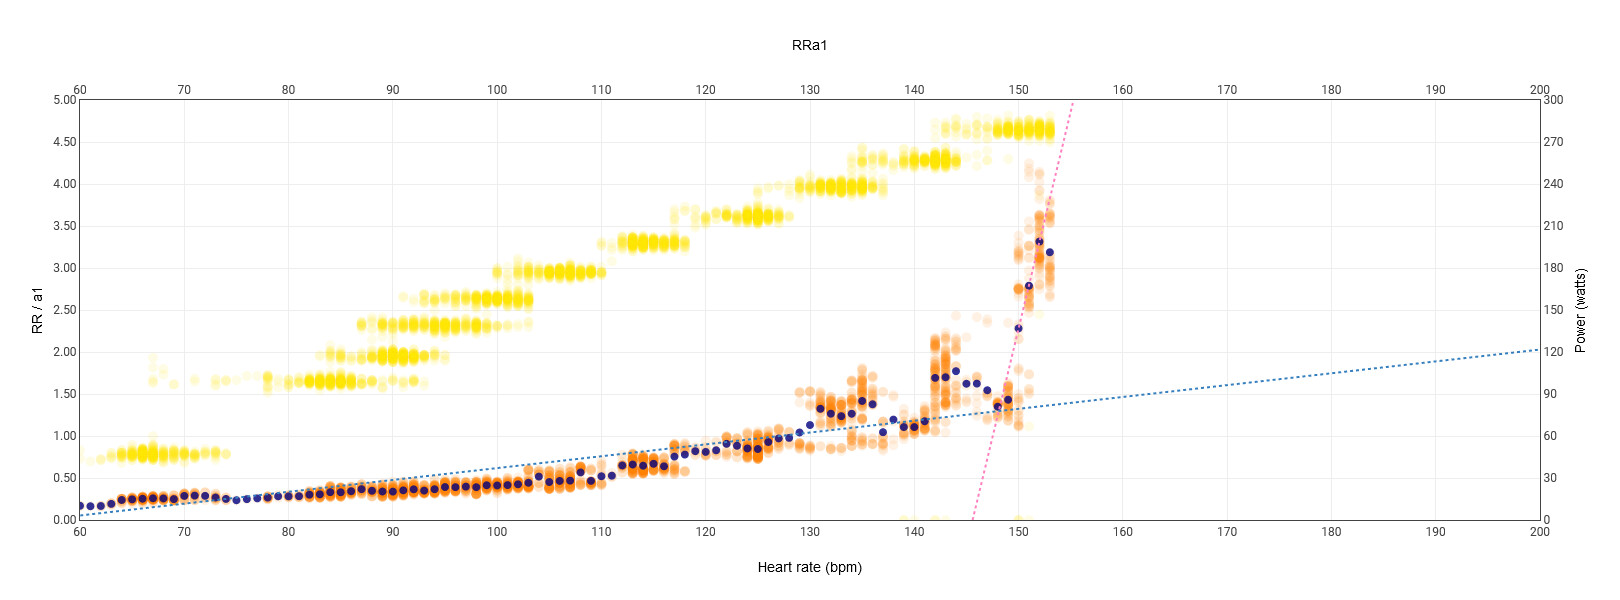
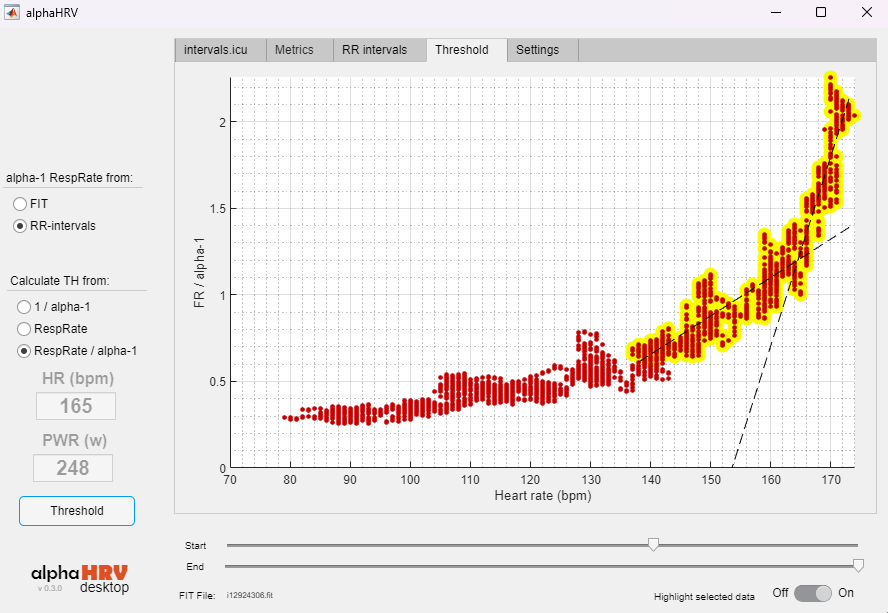
Please do not take the bilinear fitting in the chart as a smart tool that provides any threshold by itself.
It simply identifies the best pair of lines that fit a cloud of points, whatever these points corresponds to. It is ONLY a tool to help YOU analyse the data.
For instance, in this chart and some others presented today by another users, results are affected by points on the right hand side, that move towards them the lines and hidden a probable first slope variation that can be seen close to 130 ppm. This would have been well identified applying the bilinear fitting for hr<140. You can for instance use the crop action on the activity first.
What I want to transmit is that some work is required from your side to focus the analysis.
2 Likes
I did the test this afternoon, but i think my analysis of the results is wanting.
My view prior to the test from using Fatmaxxer and Runalyze was that my LT1 was around 130 bpm and the power at that level was somewhere between 205 and 220w, depending on variations in fitness, conditions, and my readiness to train on the day.
Looking at the chart, clearly there is a change in the clustering of the RRa1 records at around 130bpm. I can’t really call it an inflection point looking at it. Am i correct that this loosening of the clustering could be an indicator of reaching LT1? The change was early in the 240w step, so i have assumed LT1 power today is greater than 220w, but less than 240w. Is this a fair interpretation?
The next big change is at the intersection of the bi linear regression lines, at about 149bpm and during the 280w interval. I really need some help to understand what that actually means please, but i am assuming it is around threshold power, but not LTHR as i haven’t gone long enough at that level of power to hit that in the workout .
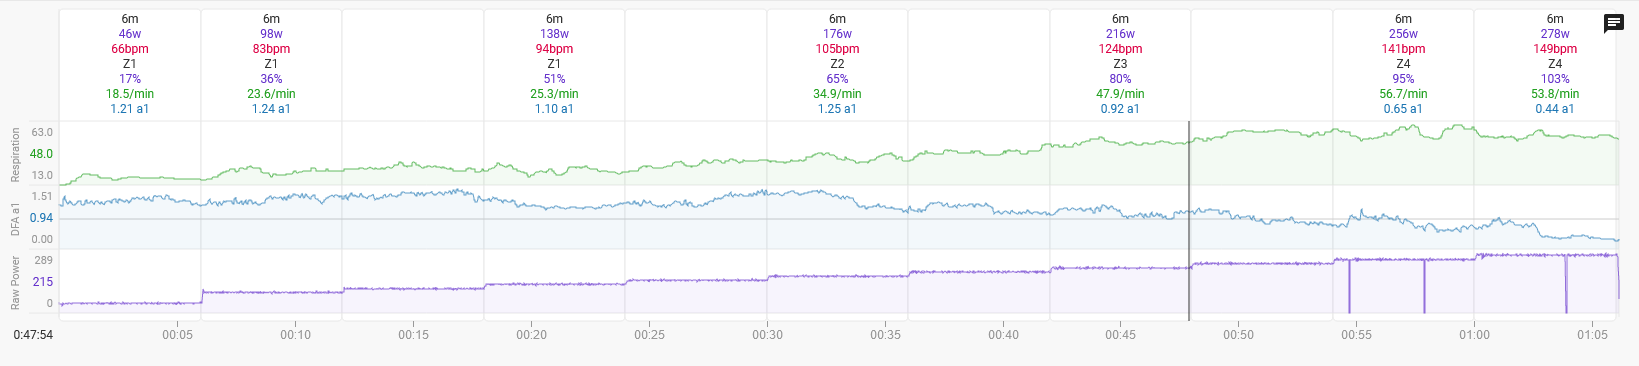
The other two charts are just to provide additional information. It looks like i had some ANT+ drop outs in the last 20 minutes which might be confusing things, and i did notice the artifacts jump up around this time. I used ANT+ as i was having no success with AlphaHRV picking up my Polar H10 via Bluetooth
Thanks in advance for your help
My non expert view of your data, and please note I am NOT anything close to a physiologist is that your appear to get a slight uptick at about 105bpm then another at 130bpm. What is important is how you feel as you go through these points whilst doing the test. In my case the feeling at the first point is almost imperceptible and very easy to miss. Not so the 2nd, when there is a definite increasing in breathing rate. My next test I’m going to do blind to the data and make a note of the time when I feel any change in breathing to see if it matches up with graph afterwards,
That first uptick was unnoticeable, and I would expect it was the move from no effort in Recovery to getting into some Endurance work.
I would normally start a workout warmup at that level of power, so I haven’t noticed it before.
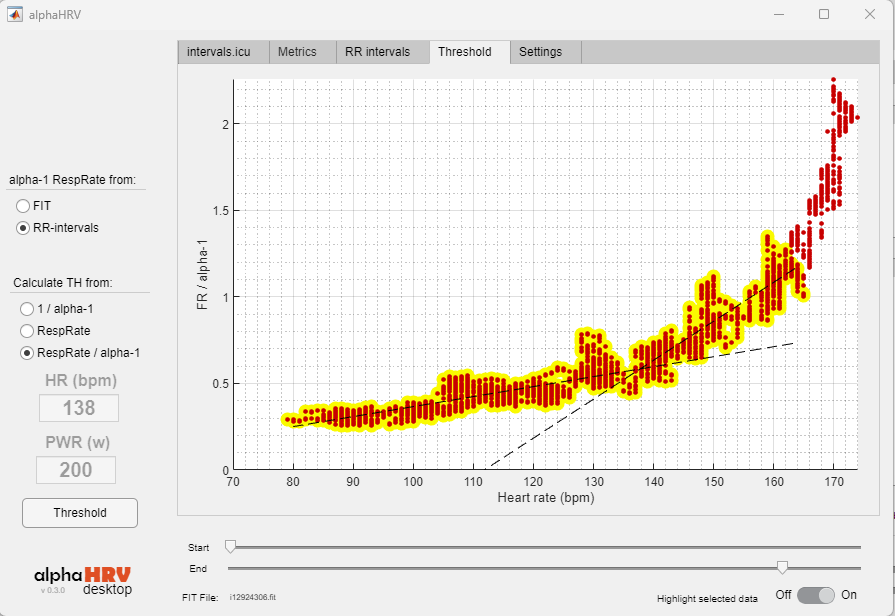
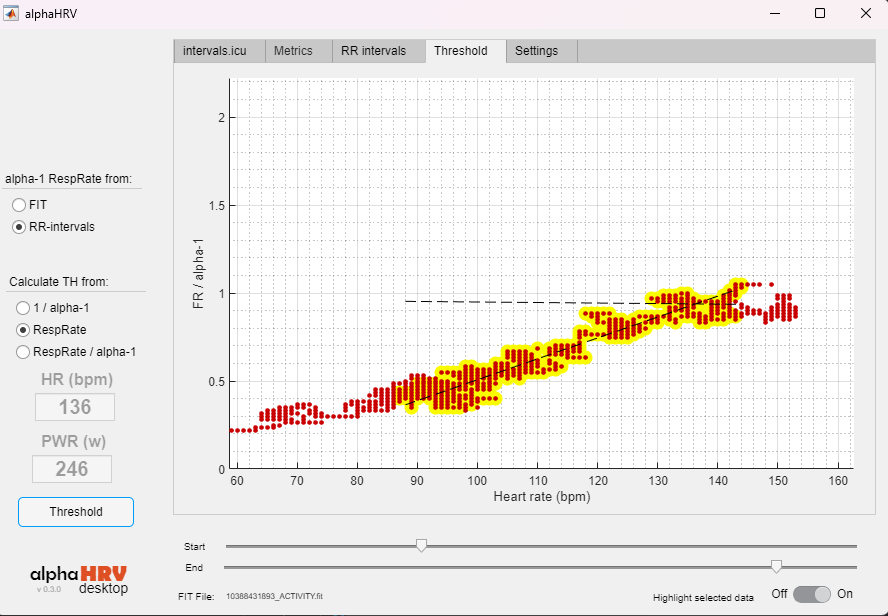
Hi, I have processed your file and the result is as follows
I also attach the second change I see
2 Likes
This is just an aid, little by little it will be improved, it is an approximation, it is not yet possible to do some functionality that we can do with the desktop version, the regression detects the biggest change in trend, being clear that in most cases the biggest change is going to occur in intensities close to the second threshold in most of the people. This is simply an aid which needs interpretation, we have been working with this (desktop version) for a long time and the results in comparison with lactate have a high correlation. I think @Cary_Blackburn is doing a great job of interpreting the results and is very close to what we do manually.
3 Likes
Send an email with the fit file to luisma.gallego@gmail.com
2 Likes
The first is my aerobic threshold and the second is my anaerobic threshold? Do I understand this correctly?
My apologies, I am not a native english speaker, but I cannot figure out where did I mention that your estimate of thresholds is based solely on DFA alpha 1; also, I cannot see the point in your reply referencing to Bruce Rogers validations as I never attempted to strike down any piece of the proposed method you are actually using. I am keen to commit some time to help out, if I can, to streamline the mathematical foundations of the proposal, in spite of the bunch of people that just have concluded that DFA and related methods are a wild goose chase for the estimation of thresholds (on the basis of some quick 5’ web reading). I am not interested in looking for help to build plots and decipher the results of my ramps or to have a no brain software recipe that does that. I just think that some refinements are needed and that, overall, research and improvement must go on. I was only trying to brainstorm and understand if you are not willing to at all or just here.
These are the two biggest increases of rr/a1, the first one you could associate to the first threshold and the second change to the second threshold (this is yet to be tested), but those changes I have given you are evident, remember that this is a range, I have been working with the first threshold values and so far I have not had any problem but it is clear that you need a further analysis and check those values.
I think you misunderstood my words, I simply answered your question, all contributions are welcome, we need to improve the intervals chart, but we have to start with something.
1 Like
Thanks for the insights. Regrettably, my expertise is more on the mathematical/statistical/software related side and I can just be of ant help in those areas. Regarding the mathematical/statistical foundations of DFA I can just say that it is rather tricky to get things right, even with clean/simulated data, that’s why, if possible at all, I would look for alternatives.
Ok, great. So what’s your take about just considering HR vs RR instead of HR vs RR/alpha1? For sure you have a bunch of valid ramps and should be a quick one to check whether results change considerably. Also, I find involved to justify the fact that RR/alpha1 is computed, as far as I understand from the data field, considering different time frames for RR and alpha 1.
Without seeing your file just with the numbers that you have put I have the feeling that it is in the range of 132 bpm and 237 w, this is the result that the application gives me
1 Like
It is an option that we have in the desktop application, use only the RR, DFA is influenced by the RR, using RR/A1 is for the tests that we were doing, it is clear that this can not occur in all athletes, if you look at each step you can see perfectly where the RR increases and I think it would be a good option to see the change. A study is being prepared in Spain with a very high number of athletes using the RR-HR method, I will keep you informed as the data is now being filtered.
1 Like
Thank you very much!
I did send the file through about 30 minutes ago, but maybe it ended up in spam
In the end I could see it and I put it in the previous post, sorry.
1 Like
Thanks again.
So with the FIT file, is the starting point for further analysis a VT1 around 136/246 per the desktop app?
That’s a challenge when my FTP has dropped down to around 270 due to a drop in training volume and intensity. Was there any clarity from the data where VT2 might be?
The FTP I can’t see anything, I would still work on 132 bpm and 232w watts, remember this is a range you can start progressively over 80-90% and then build up to 90-100% of AeT. This requires analysis and knowing a bit about your personal trajectory.
1 Like