Thx for your reply.
I did:
10’ 120w “warmup”
6’ 150w
6’ 180w
6’ 210w
6’ 240w
6’ 270w
6’ 300w
6’ 330w
abort cause reached IANS / VT2
@~69kg atm
If you want i can send you the fit file?
Thx for your reply.
I did:
10’ 120w “warmup”
6’ 150w
6’ 180w
6’ 210w
6’ 240w
6’ 270w
6’ 300w
6’ 330w
abort cause reached IANS / VT2
@~69kg atm
If you want i can send you the fit file?
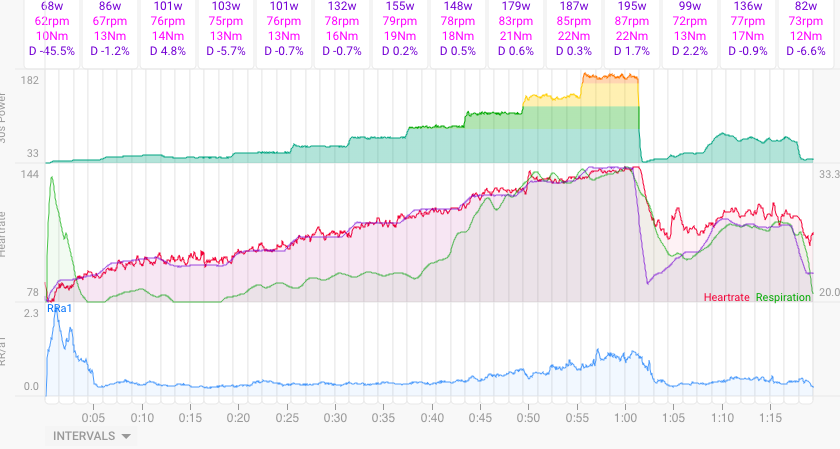
Just used the new IQ App to do a step test.
FTP approx 200W
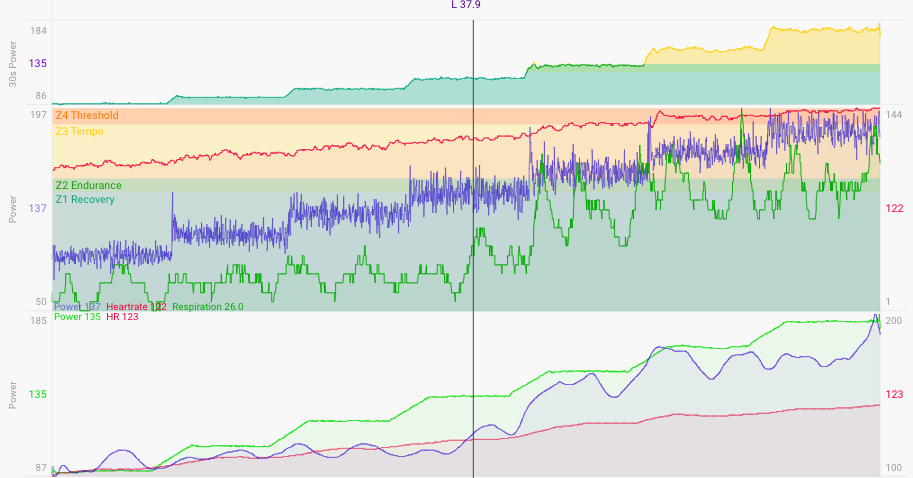
So I did a 24minute warm up @ 70-85W (not shown) then 6m steps starting at 90W and increasing by 15W, stopping at 90% FTP
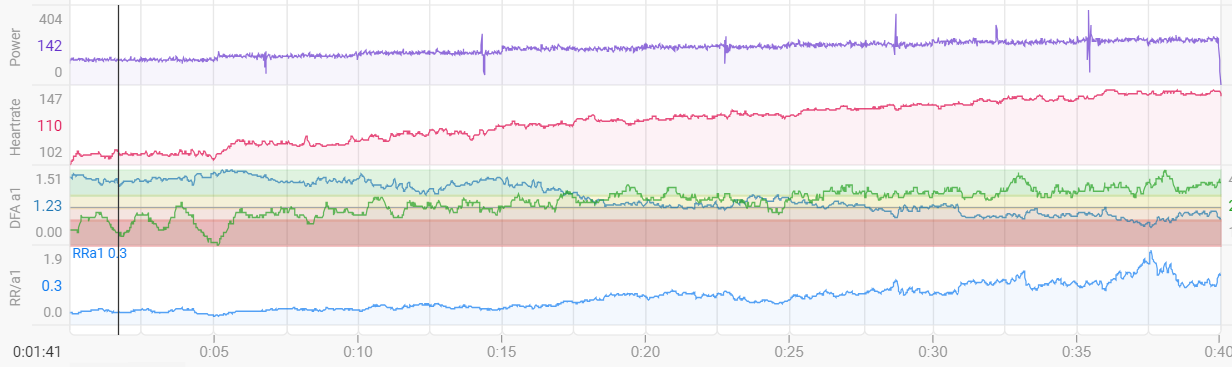
As you can see below there is a clear uplift in Respiration Rate during the 135W step (more clearly shown on the bottom graph where I’ve set it to 120s smoothing. Max HR on that step was 124bpm.
On the RR/A1 trace it shows the change at 127/8 bpm but it could be argued that it starts to increase a little before that.
I would therefore set my VT1 at 135W & 125bpm. Do you think thats correct.
Fantastic app by the way!
I’ve just copied your testing approach noting that I am very much a (slow) amateur and more a runner than a cyclist. For me cyclibg, the VT1 appears to be around 120 BPM and seems to correspond well to RPE. When I’ve derived estimates running it’s been nearer 130 which also seemed to correlate well with RPE. So I think I am maybe up to 10 bpm different between the sports, reflecting training to date I guess, does than seem plausible?
I would say yes reflecting the fact that more highly trained muscle can process lactate better
I experience something very similar but the other way around. 125 bpm for cycling and 115-118 bpm for running. Been cycling consistently for about 20 years, started running less then 3 years ago.
I was also wondering where the difference comes from, but @Cary_Blackburn 's explanation seems very plausible.
Courtesy of all the Sports Physiologists I follow in Twitter
That explains why my zones that I setup on the cross trainer transfer so well to running but not to the bike. When I keep the same heart rate on the bike my legs really feel it. On a run I can be 20-25 beats higher and feel like I’m barely doing anything.
I’ll have to do a ramp on the bike now.
A possible physiological explanation in running is the possible activation of bicarbonate to buffer lactate, we move more muscle groups, the appearance of bicarbonate means that there are two sources of CO2 so ventilation will rise, VE, VO2 and VCO2 in phase 1 go up linearly when there is that transition in VT1 there is a non-linear increase in VCO2 and VE (activation of the buffer system, the two sources of CO2 come from the oxidative pathway and the buffering of [lactate], I think that everything is possibly due to the greater activation of muscle groups.
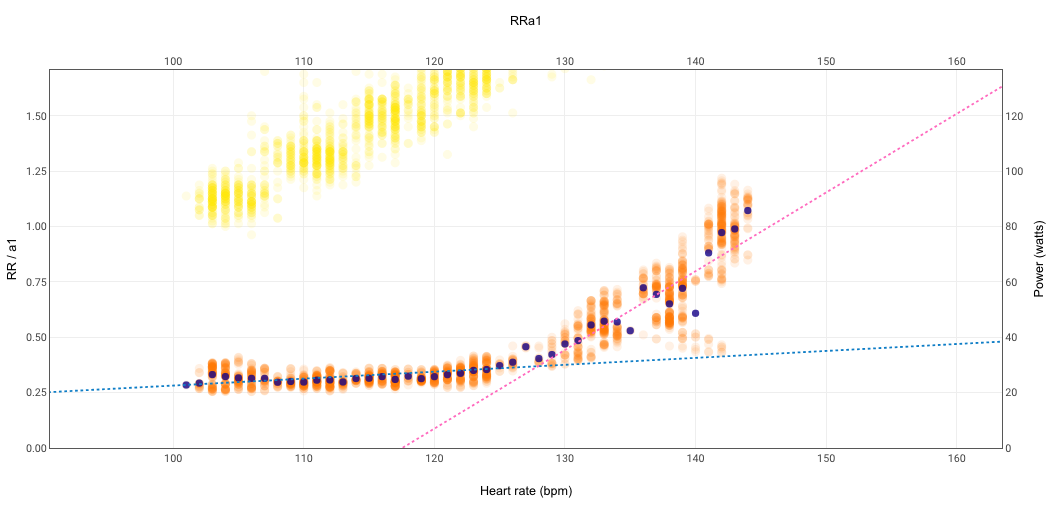
Actualmente con alphaHRV y el nuevo algoritmo de cálculo de la frecuencia respiratoria, estamos investigando si podemos encontrar algo que se parezca al FatMax, de momento las primeras pruebas que estoy realizando (no laboratorio) están encontrado alguna cosa por detrás del primer umbral, en poco tiempo empezaremos con las pruebas de laboratorio, os dejo la imagen de un test donde ha salido el primer umbral y otro valor de corte detrás del primer umbral, vamos a trabajar en los protocolos y ver que sale y su validación en laboratorio.
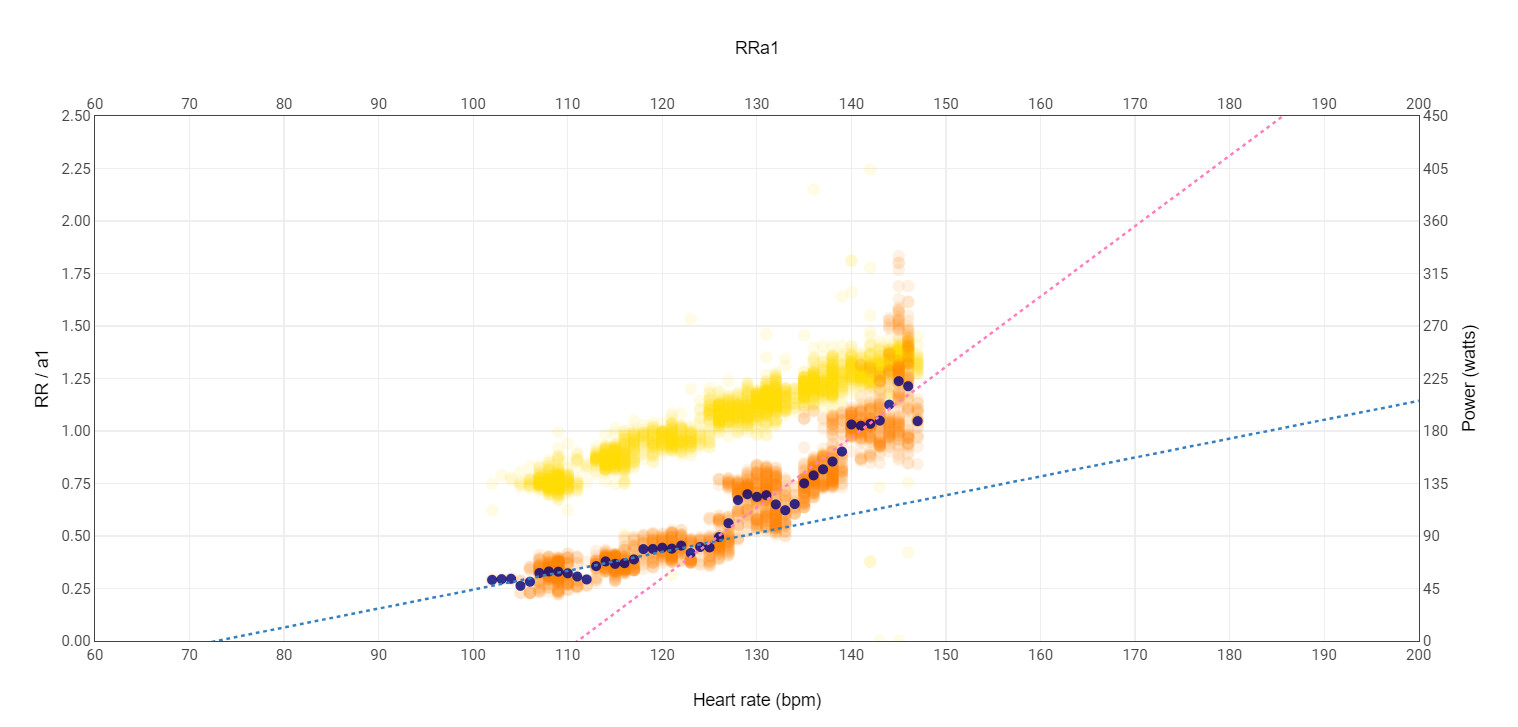
@Luisma_Gallego_Soy_P I’ve just seen and applied the Custom Stream chart you have written for RR/Alpha 1. It’s great, many thanks for the work you do and the knowledge you share on here.
The custom activity chart that plots RRa1 stop working in the last few days after it was working correctly in the past , anything change?
No change in alphaHRV, neither in the RRa1 chart.
Check if you have modified the chart as you are using your own copy of it.
Works fine for me
Deleted the chart and entered it again from the search chart without luck.
Does it need any other custom field or stream to be defined?
Hi,
The chart not shows de RRA1, appears with NaN, but I have all the streams loaded. What could be the problem?
Many thanks!
Hi @Inigo_Tolosa , how do you add this chart in an activity? I don’t find the RRa1 chart when try to add a new chart? Do you have to add the stream before?
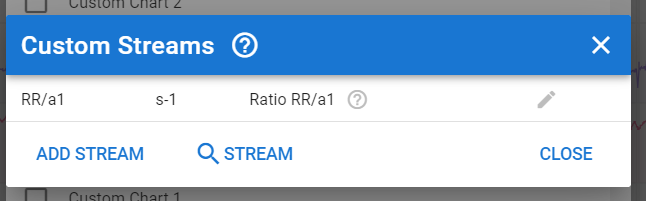
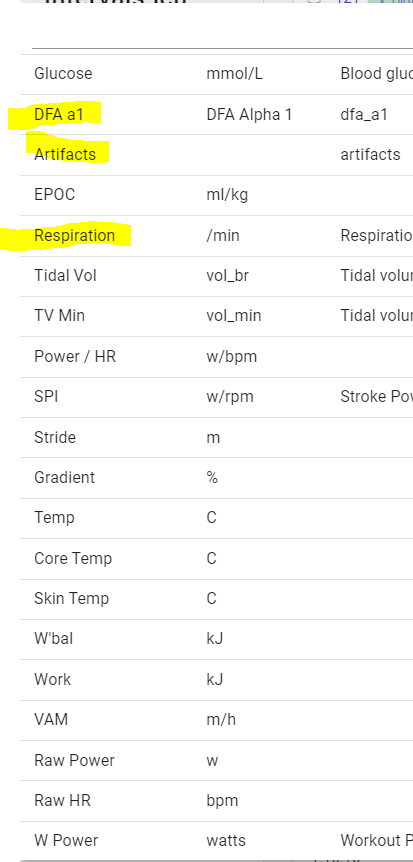
dfa-a1, RR/a1, artefacts and respiration are standard available plots in Intervals.
Just click on charts, then the + chart, and add the plots as you wish.
It seems there could be something wrong in the activity data. Are you getting same results for other activities? If so, could you share the fit file of any of those activities?
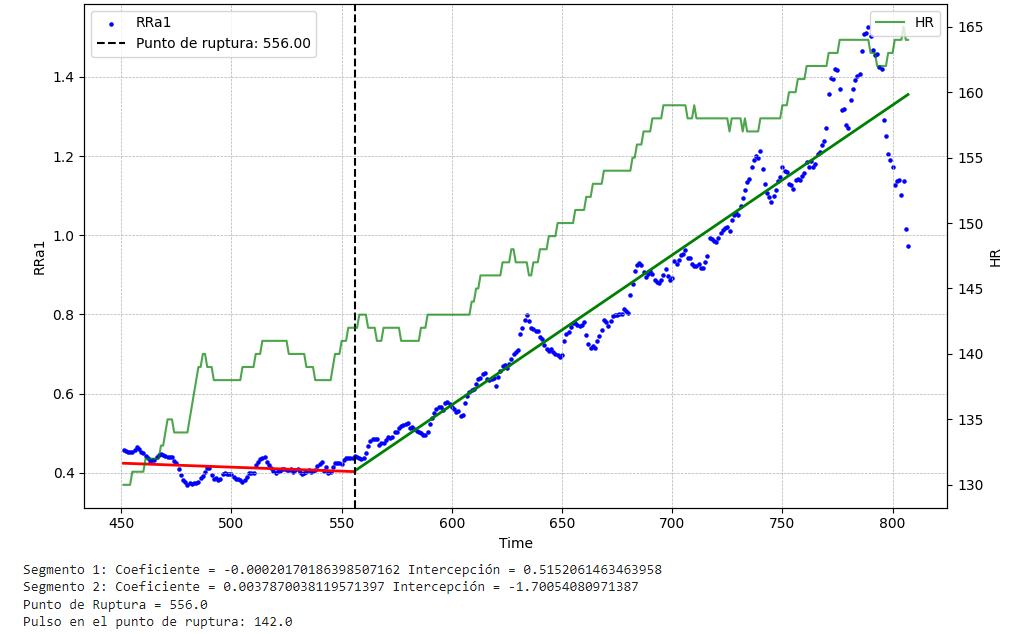
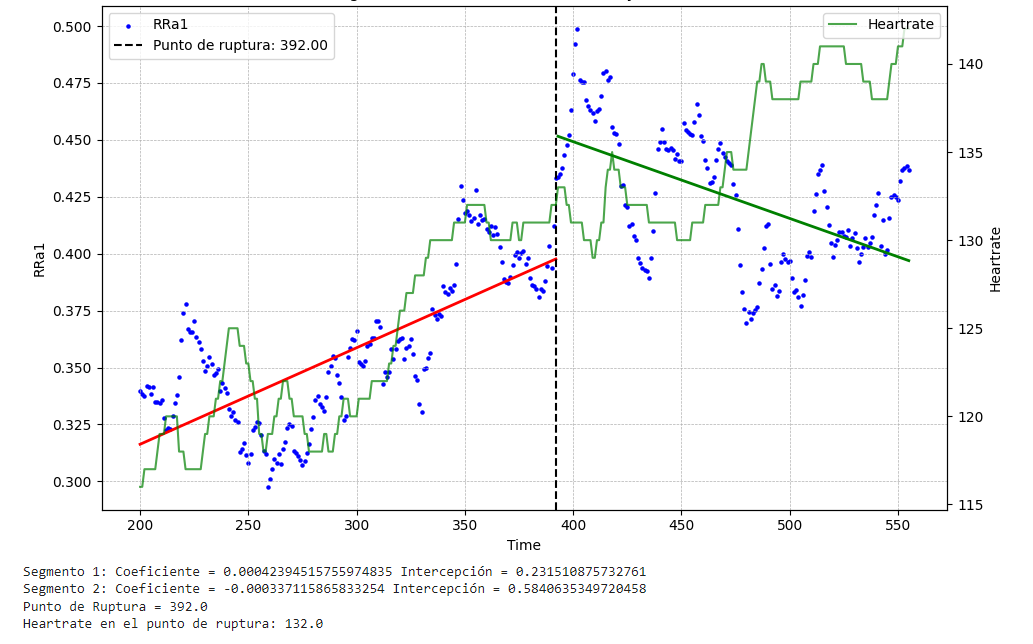
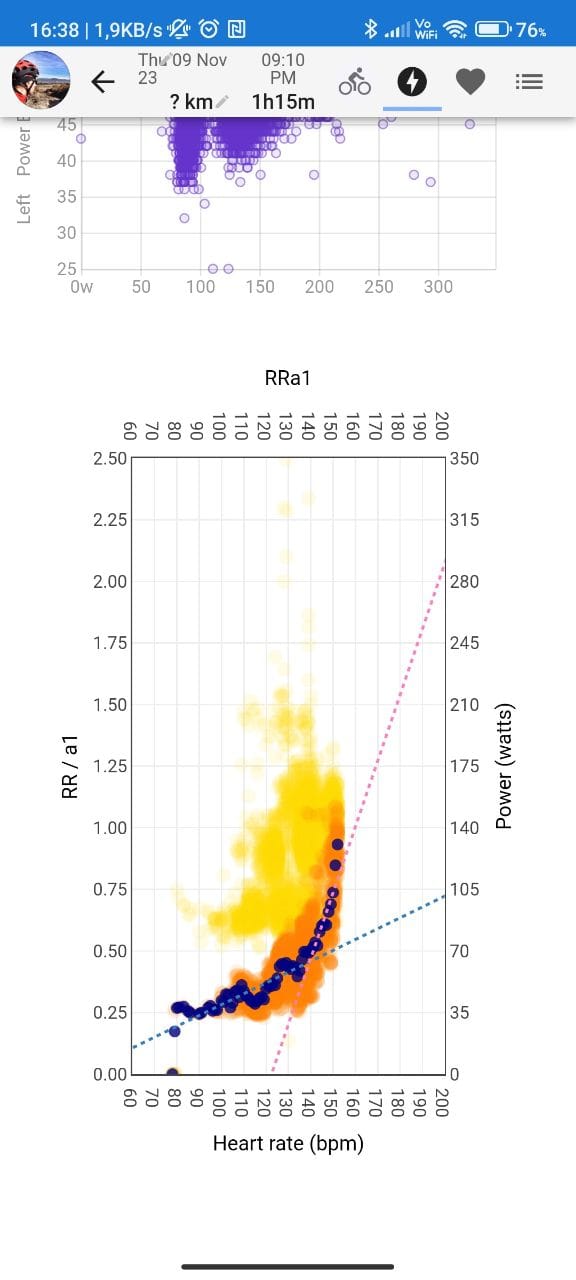
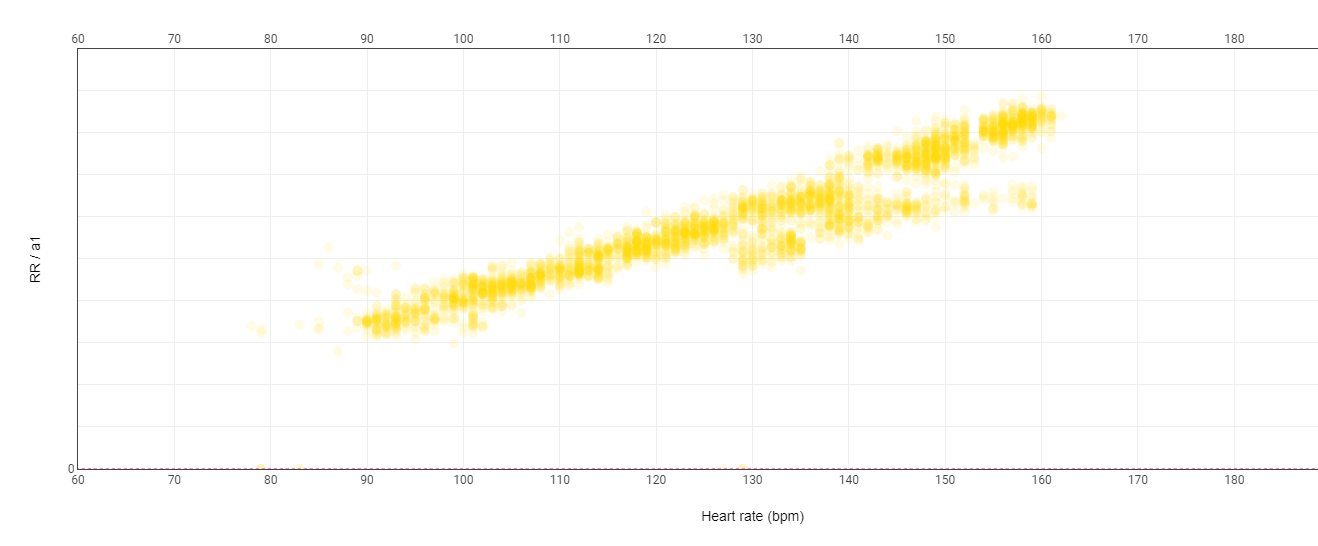
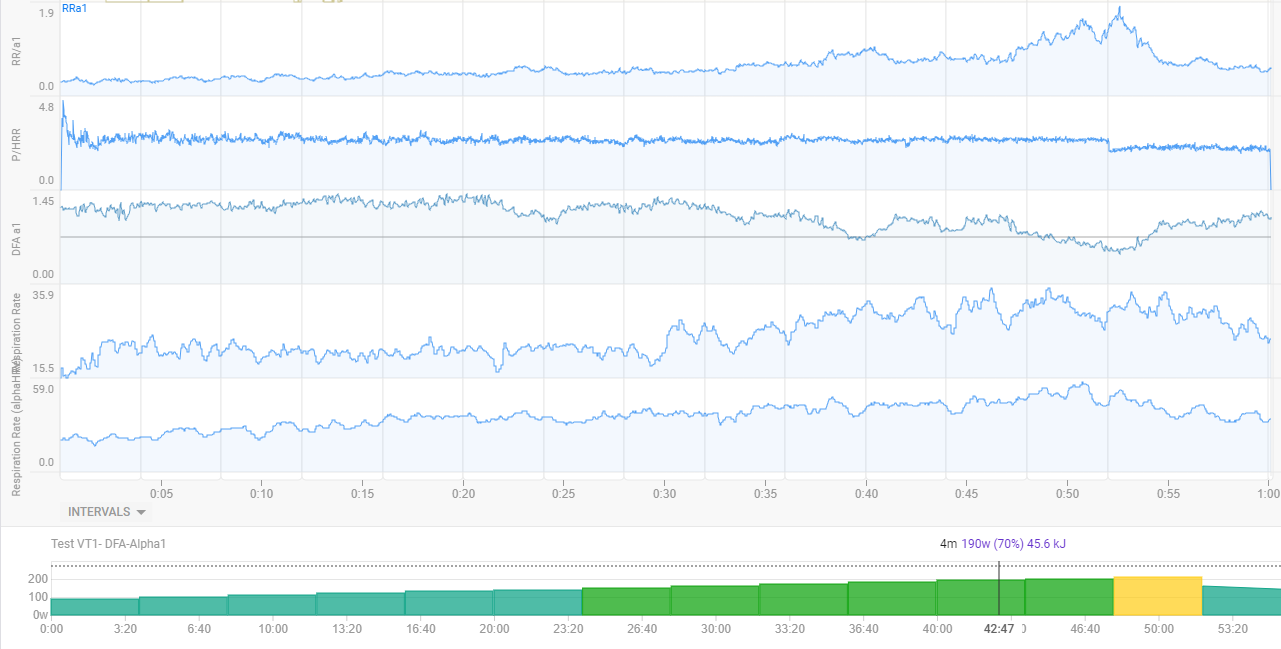
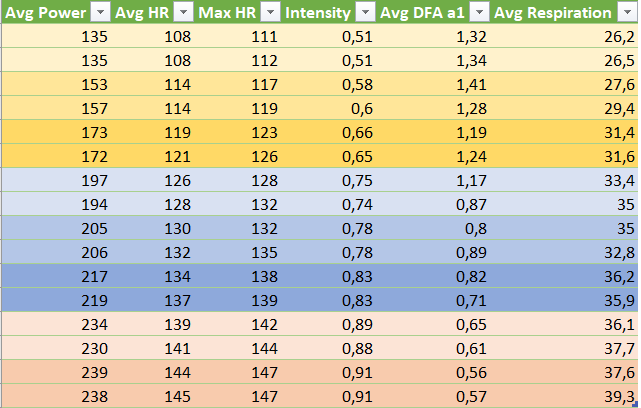
Ok, did my test today. Warmup 10min @40%.
Then 5min steps, with every 2.5min auto lap.
Here the data (FTP around 266W):
Graphs from intervals.icu
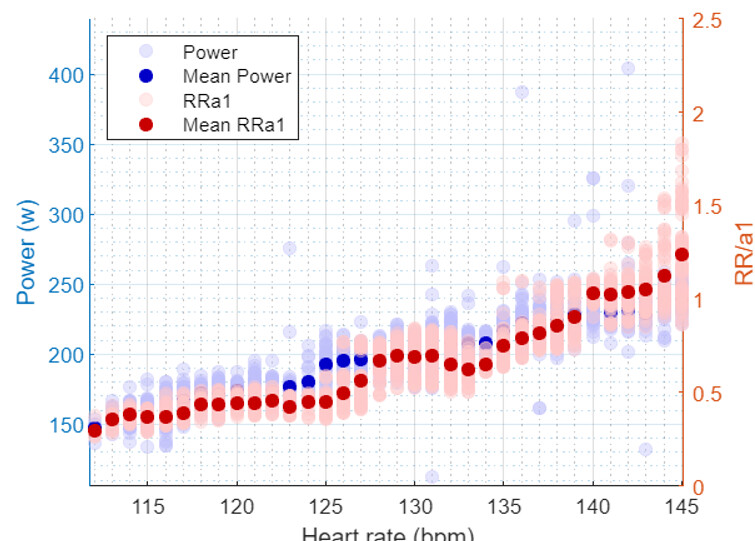
And this the graph from matlab:
What do you guys think?
If that was my data I’d put my LT1/Aet/1st rise at 125bpm and set my Z0 Recovery at <115, Z1 Easy 115-125 and Z2 Steady at 125-135bpm.
That seems a logic explanation. Runalyze gave me 222w and 137bpm and that is also inline with my previous lactate test.
Maybe @Luisma_Gallego_Soy_P has some insights on this performance?
But 125-135 is a good steady Z2 workout yes. I think I am pretty ok at aerobic fitness (I hope). I can ride 100-120min at sweetspot. And within a tempo session not real decoupling normally.