Thanks to @MedTechCD and Kubios I could find my sensor best position is centered.
Also I had to invert it in order to be correct polarized.
Once I’ve heard this behavior to be random, does AlphaHRV handle this automatically?
Tks,
Thanks to @MedTechCD and Kubios I could find my sensor best position is centered.
Also I had to invert it in order to be correct polarized.
Once I’ve heard this behavior to be random, does AlphaHRV handle this automatically?
Tks,
@Luisma_Gallego_Soy_P @Inigo_Tolosa
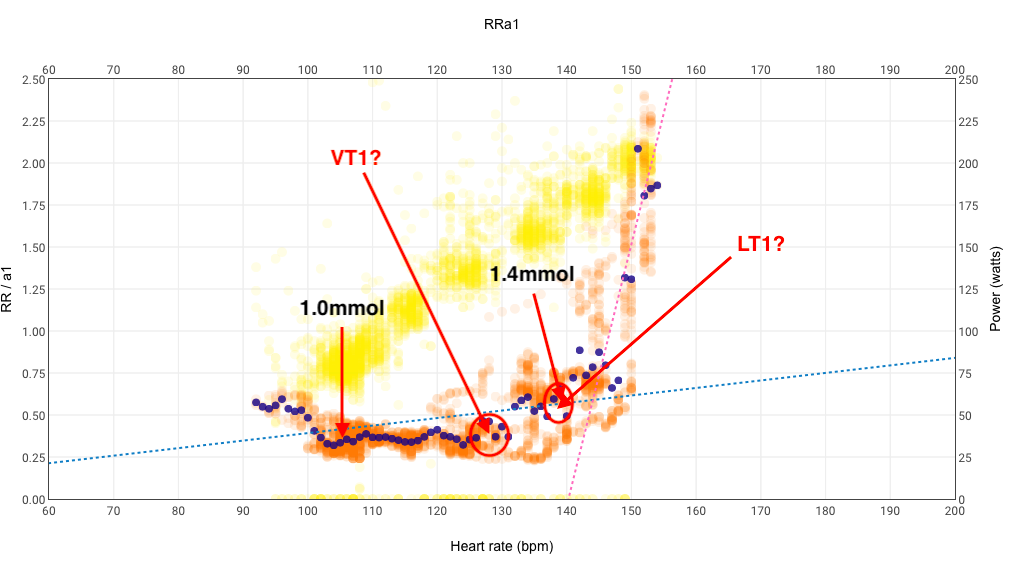
I’ve just done a ramp test with 7.5 min ramps and increasing power by 10% of TP.
I also took a couple of lactate readings where I thought the base level, and 0.5 above base would be based on previous lactate tests.
I found that I got quite a few artefacts when I stopped pedalling to take the lactate reading but they had gone by the end of the next step.
This is the result with where I think the lower thresholds are. In your experience does this make sense and would you put the Z2 (as per Inigo San Milan and Alan Cousins) between VT1 & LT1.
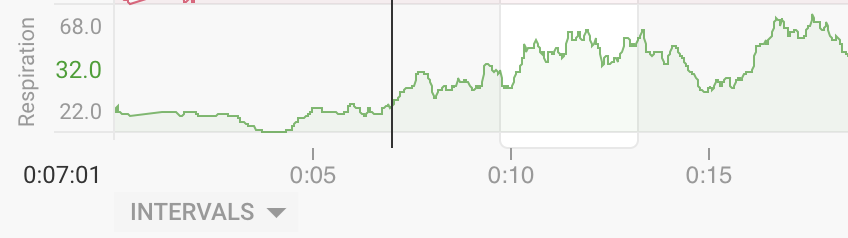
I’m trying to use the breathing rate from AlphaHRV in the intervals chart page. I see @Inigo_Tolosa has a chart available but it’s only displaying the Garmin rate.
How can I display brpm in Intervals? Runalyze has no problem displaying the data.
Intervals only displays the breathing rate from AlphaHRV. Not the one from Garmin.
I had a look at your Monday indoor ride and there is only one “RespirationRate” field in the fit file and Intervals.icu displays that.
I have just moved to an Edge1040 (with Garmin support for respiration) from Edge1030 (without Garmin support for respiration) . Using alphaHRV and Tymewear, my fit files now contain 3 fields with respiration rate values.
I think intervals Respiration field contains Garmin’s respirationrate, if it exist. For devices without native support, it contains alphaHRV’s respirationrate. Is this right @david ?
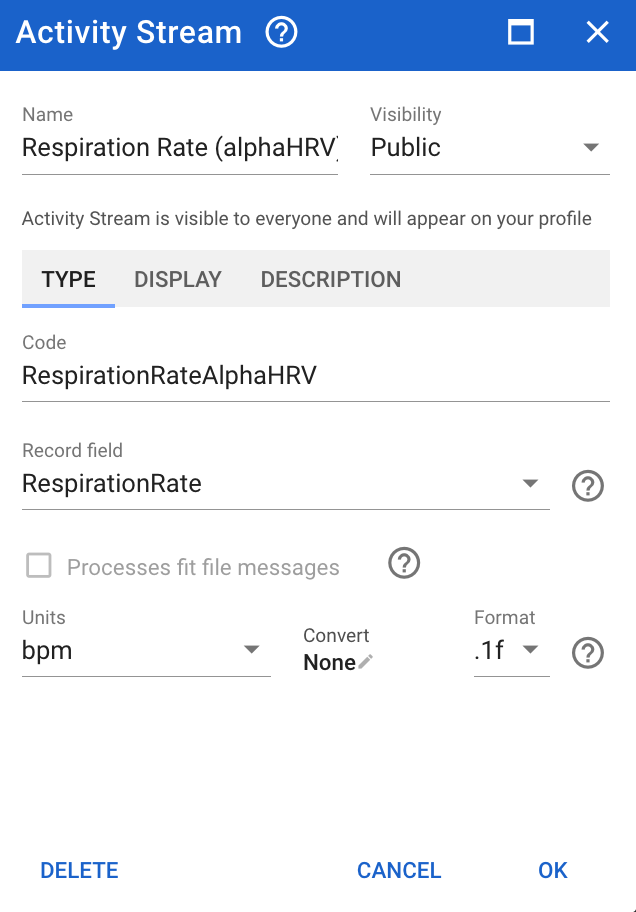
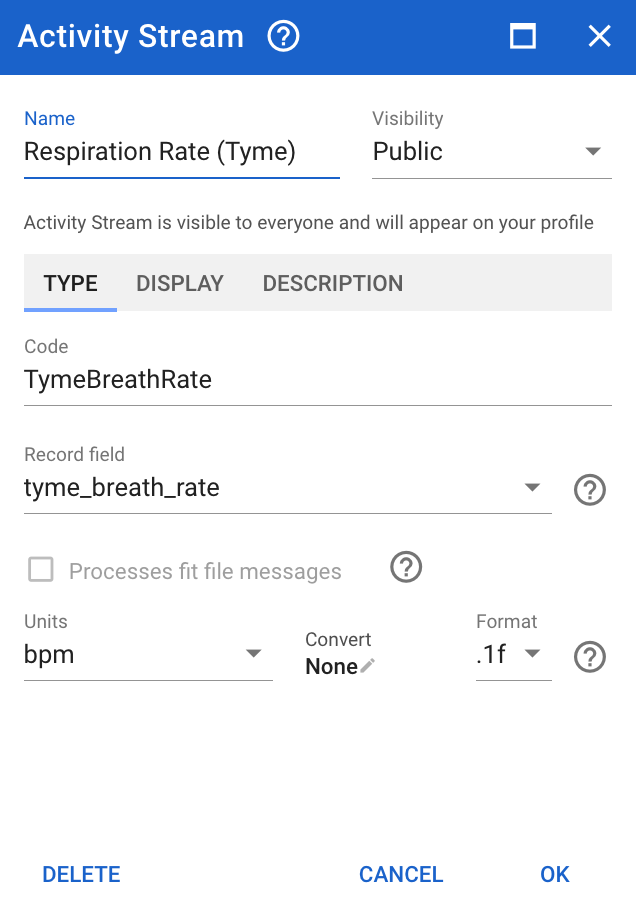
I am using following Activity Streams to assure I get alphaHRV’s and Tyme’s respirationrate
Almost. Unfortunately it depends which field first shows up in a record. Your approach of defining custom streams will work. I need to improve how this is handled.
I now have a Garmin Edge 840, before I had a 830.
I’m 100% sure that the resprate field in Intervals from both devices was/is the one from AlphaHRV.
How do these 2 methods compare?
Thanks David - I noticed that when I didn’t have the AlphaHRV field in my activity it just displays Garmin respiration rate but you can’t get both - that’s fine but a little confusing because the chart says it’s from Garmin.
Update to 0.9.950 is available for alphaHRV
Changelog:
I’ve just updated it and noticed in the settings a field for inputting the values for RR at VT1 and VT2. In yiur experience are these 2 points relatively static on a day to day basis over the short term or are they affected by things like fatigue, nutrition and temperature?
Thanks
VT1 and VT2 shouldn’t vary so much in the short term.
However, your current fitness status, fatigue or any other internal or external circumstances can modify your respiratory response under same load, so that respiratory rate can be different and you could go to different ventilatory zones from day to day for same load
VT1, VT2, FTP, VO2MAX, LT1/2, HR are all movable, even in the same session, here the important thing is to have an anchor point just as you have a wattage associated with an ftp, a heartrate associated with a threshold. Use it as an anchor point where you can see if you really have some kind of problem, for example, if one day you do a session and you see that the pace you have a high FR you can make decisions at that moment.
That’s exactly why I love AlphaHRv/dfa so much. It’s a real measure of autonomic stress so it catches brewing sickness or life stress. I can then bail on a session or finish up in low z1. It’s amazing for when you exercise for health rather than performance exclusively.
The RR is yet another point. Stephen Seiler has mentioned that when he’s fatigued RR climbs high even though HR stays regular. Im really looking forward to collecting data on this. Wish there was a way of having a deviation of normal metrics number, kinda like garmins performance condition but way more sensitive
There is still much to study, our team will soon be immersed in the behaviour of all this, working in the laboratory and indeed Seiler is right, the respiratory rate shoots up even if the pulse does not, we know that when we are fatigued the pulse does not rise well, but if we now have the ability to monitor in real time the respiratory rate and dfa tips can be given to the athlete so that he does not overtrain unnecessarily.
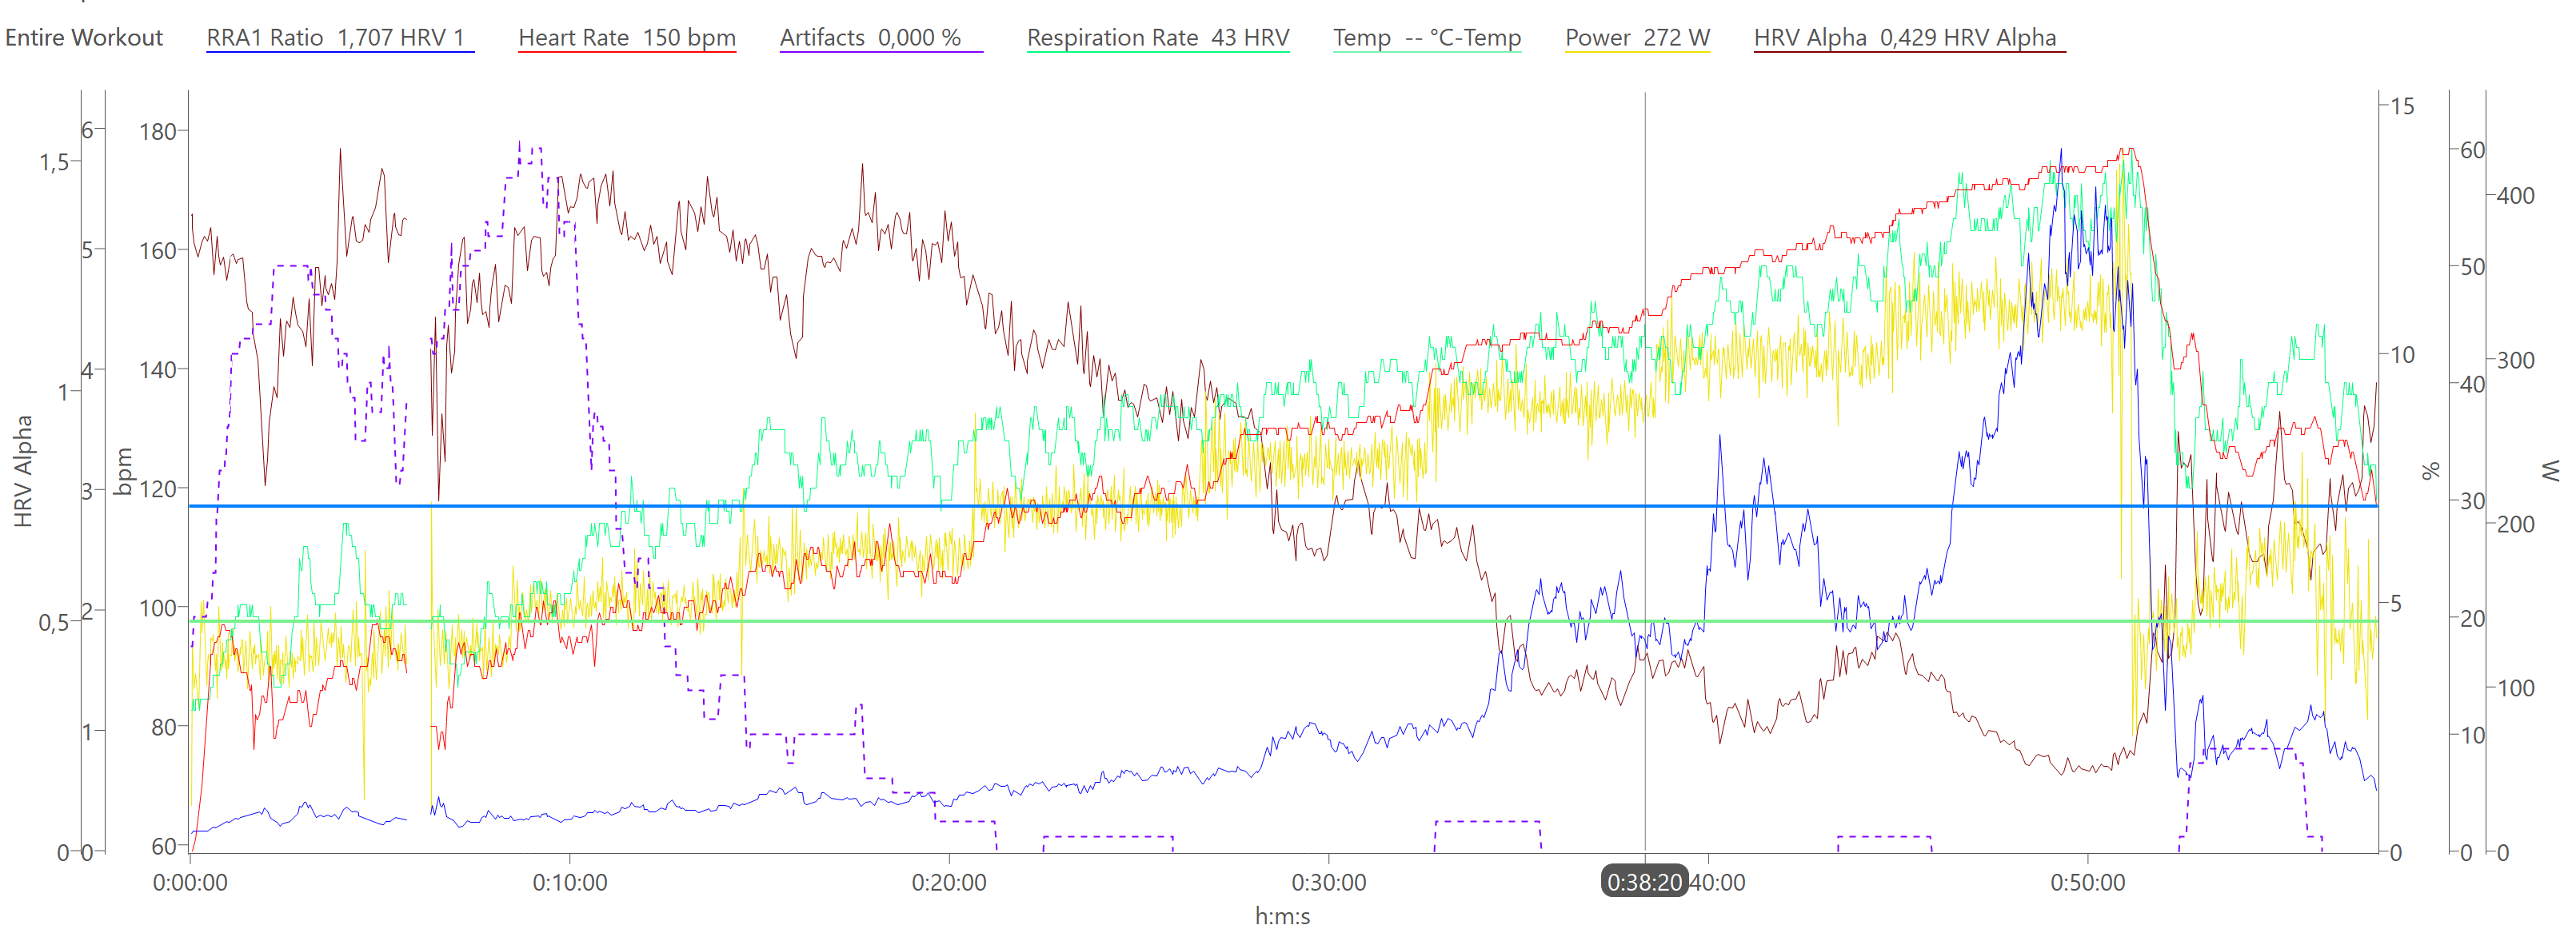
I also did the 6’ protocol (Polar H10)
I just went up to my IANS / VT2 (confirmed by lab) @ around 8.2mmol/l / 172bpm. Next time i go beyond and also will take lactate samples.
The blue horizontal line is set to 0.75 and the green one to 0.5 just to show these “standard” values.
Where would you set the metabolic turnpoints LT1 / LT2 looking at this graphs? And where would you estimate VT1 & VT2?
i wonder if it’s possible also to draw conclusions about the current substrate utilisation ![]()
The duration of this test is excessive, a test of this type cannot last 50 minutes, if you do 6 minutes you would have to look only for the first threshold. I don’t know how many watts you have climbed in each step, how much you have done of warm up, there is a lack of data to assess whether the test can be validated or not.
You seem to see something between the 25th-30th minute and between about the 38th-41st minute but I would need to have the test data to be able to verify this.