Can you add me as a coach so I can review the session?
1 Like
Ok, done!
What I see in that test is that in order to properly see what you are looking for, you should first create a baseline of both dfa and respiration rate. By making changes with so few watts we are not going to correctly detect what we are looking for. As a tip I would say do 5 or 10 minutes at 100w and then do 2m30s increasing 25w each step, you can see a clear trend change but I have to process the file with my software to make sure correctly.
As for what you say about lactate, this test is not valid to measure lactate because with such short intervals you will be measuring lactate from the previous step.
2 Likes
Ok, thank you for the insights.
I think I will do a new test then. Maybe as the previous one but larger steps in watts every 5min. Is that not better then 2m30?
Yes, when I do lactate test I take much longer intervals.
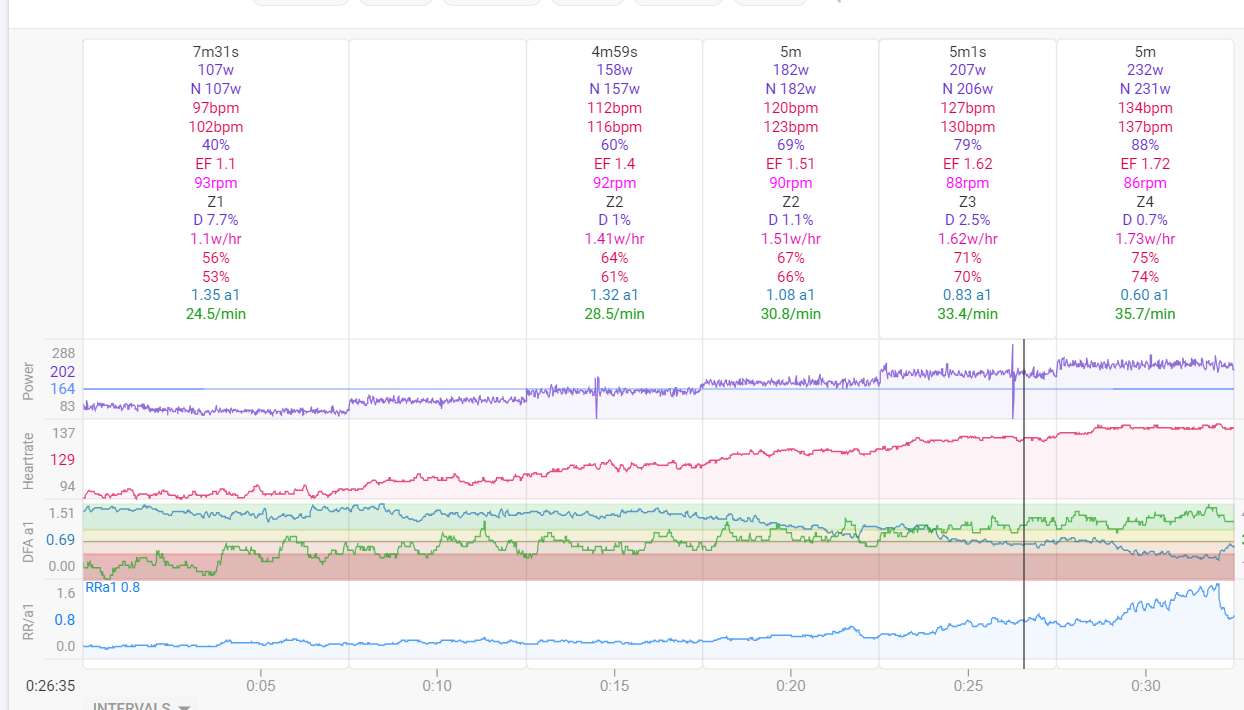
Did a new test.
10min 40%
5min 50%
5min 60%
5min 70%
5min 80%
Seems it gives the same result :-). Around 125bpm but power was now 212W.

Hi @Inigo_Tolosa,
I’m posting here because pictures are allowed.
First ride with Fenix 7x Pro.
For some reason power did not show on the watch screen during the ride.
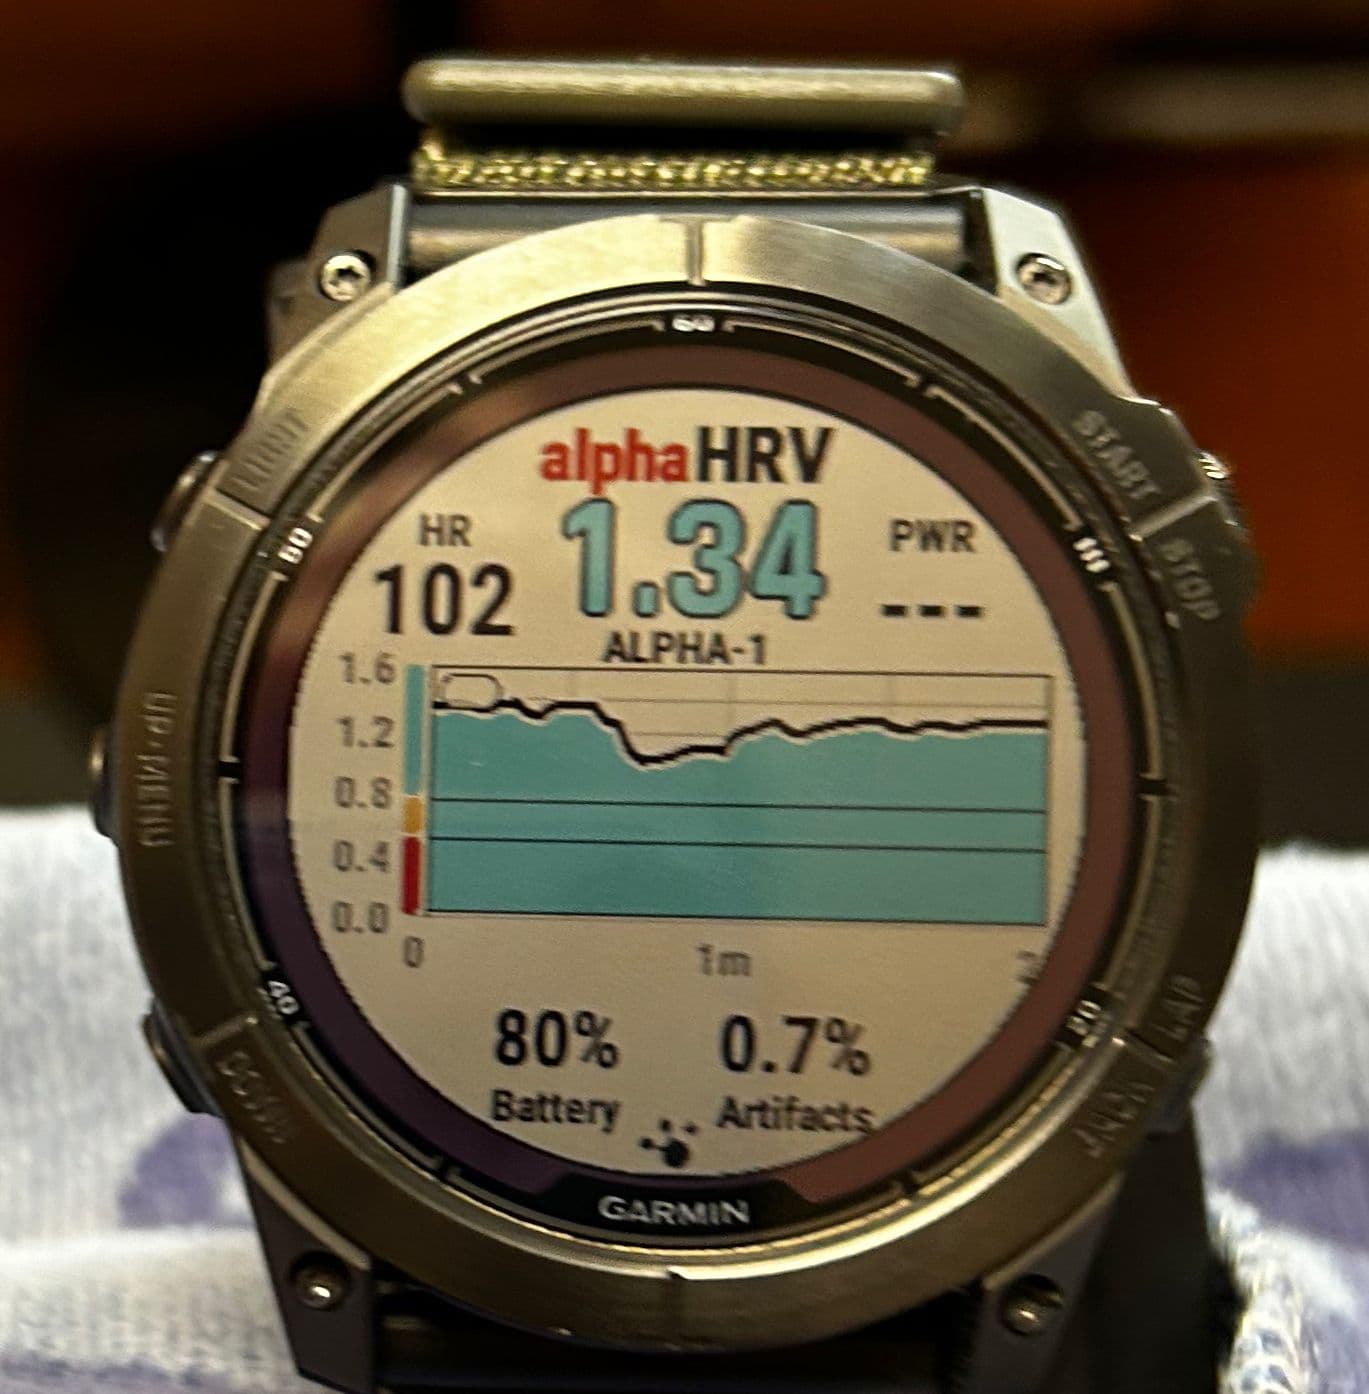
Also, please, Any idea what happened here?
Thank you,
Do you have Power in the resulting FIT file? You’re not showing a Power trace, so chances are high that your power meter was not connected to the watch. A view of all traces could confirm/exclude that.
The missing data-part is where you temporarily lost connection to your HR monitor. You might think that alpha1 was recorded during that time but it was not. There’s a straight line interpolating the last recorded point to the first one when connection was re-established.
Here to, a view of the recorded HR trace might explain. But not 100% sure because the IQ field connects in ANT+ on your watch (ANT+ icon) and then your normal HR trace from the watch should be BLE. If both dropped out, you can be sure that there was a temp problem with HR sensor.
Hi,
I have made this activity public Garmin Connect.
There is no HR drop out and power was 100% ok.
Thank you,
This is an indoor activity. I suspect you might have paired your trainer as “trainer”. In that way, Garmin has access to power values transmitted by the trainer, but they are not exposed to 3rd party IQ data fields.
If this is the case, you should set an additional sensor pairing. Search for power meters, the trainer will be listed as a power meter sensor. Pairing to it will provide power metrics to alphaHRV or any other IQ data field.
Let us know if this solves the issue.
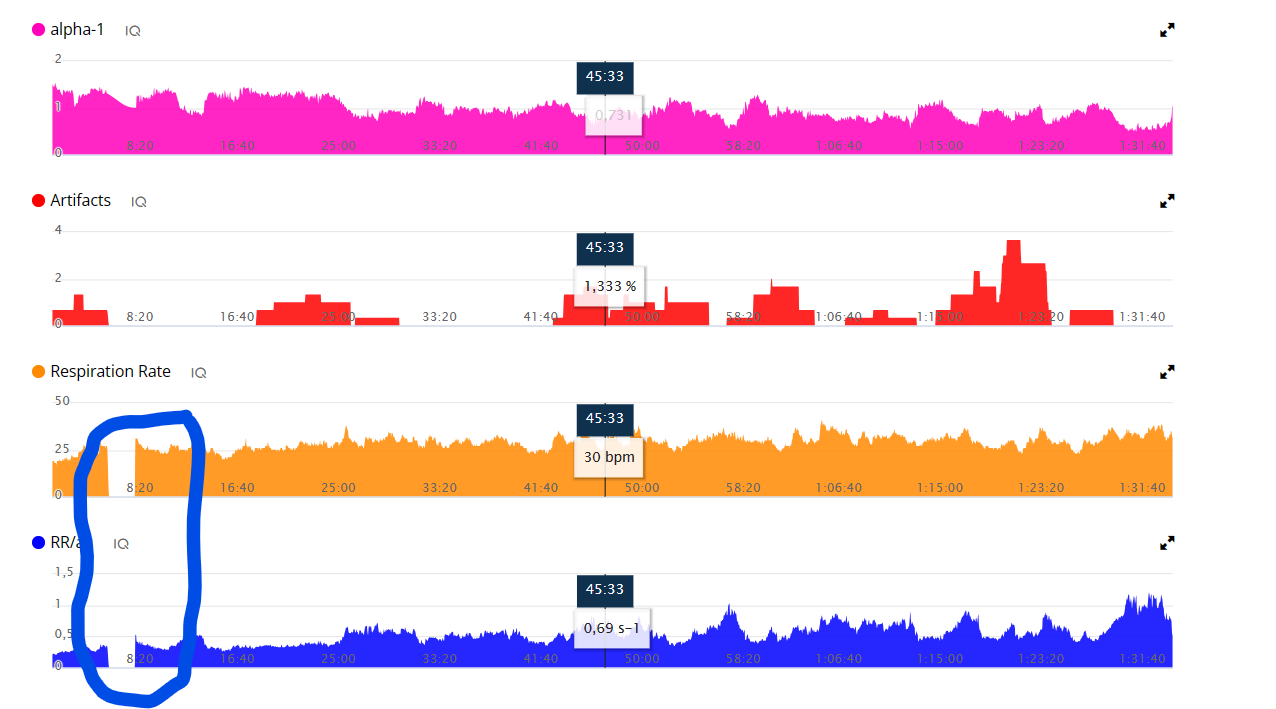
It is difficult to conclude anything about missing period within the data provided by alphaHRV, but first value after recovering is just =1. It means the data field has reinitialized. Have you seen the collecting data count up to 100% during 2 min? Did you remove alphaHRV temporaly and assign it again to the screen?
Any case, Larra Belagua is a nice climb, much better in real life ![]() . There you could continue climbing 6 km more than in La Vuelta till La Piedra de San Martín and maybe meet together.
. There you could continue climbing 6 km more than in La Vuelta till La Piedra de San Martín and maybe meet together.
Good catch!
No.
I’m eager to know Spain and it would be a honer!
Thank you for your support
PS: @MedTechCD too! always willing to help
Hi,
Today it happened again but I have realized that was because a tiny drop of sweat that triggered a change of field.
I like the touch screen to scroll pages but I think that field editing should be locked during activities for touching.
Regards
So, I was right suspecting about reinitialization.
There is no way to disable layout edition while page scroll remains active.
In case you use a di2 system, you can lock the screen (disabling any touch interaction) and set the buttons on shifter hoods for scrolling. It is a good way to avoid unexpected behavior caused by sweat or rain drops
1 Like
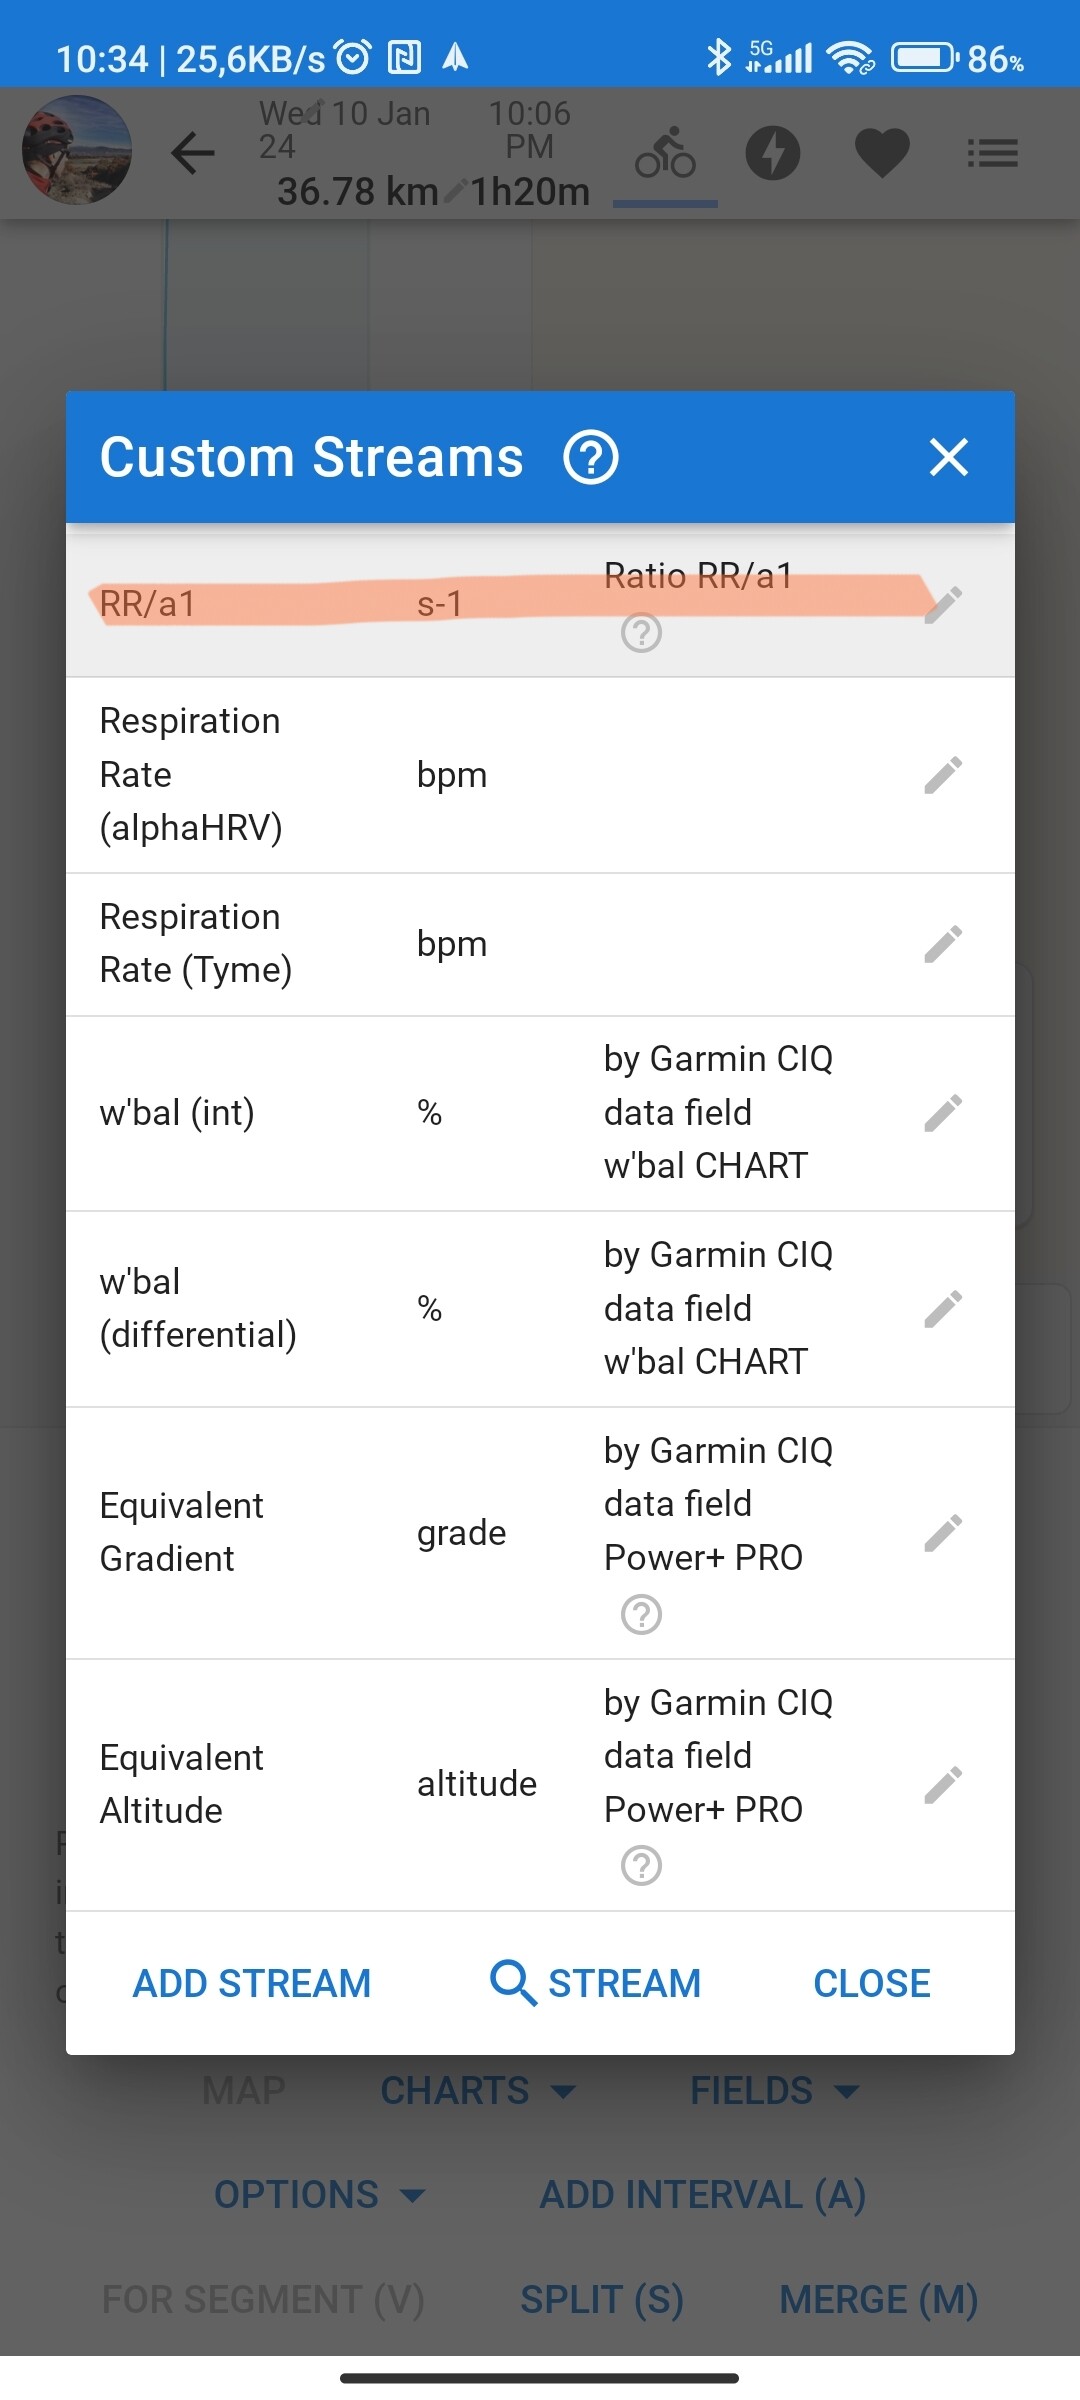
Is there anyway to plot the rr/a1 ratio in intervals? The existing chart just plots them separately rather than the calculated value.
AlphaHRV came in big use today as I’m on a calorie defect. All my usual stats like overnight HRV, resting HR are looking great as I tend to get a big uptick when in a calorie deficit & I’ve been ramping up training after illness. So the good stats are due to calorie defecit rather than being “well rested” But first 5 mins on the bike today and my dfa and dfa/a1 looked way off so I bailed the session. I keep saying it, but this tool is AMAZING for health!
Leaving a session because of the value of dfa at the start of the session does not seem to me to be the right thing to do. It would be more correct to leave based on subjective perceptions than on the value of a1. DFA is sensitive to many things and should not be used as the only indicator for quitting a training session.
Also did you check the artifacts.
I find that RR/a1 can be all over the place at the start of a ride, particularly is I’ve just had something to eat and/or I am a little stressed getting everything sorted out. (Up and down our stairs because I keep forgetting things). Normally it settles down after a thorough lowish intensity warm up, 30mins or so
1 Like
Hi Cary.
How do you create these graphs with 3 axis? It is 3 axis right? I seem to struggle with both Excel and Google sheets to achieve this. I have some data from a test ride I did which I didn’t stick to full protocol (I am planning to do hat tomorrow) so it contains slightly less data points but I struggle to create the right chart. I am hoping to achieve clearly visible LT1/VT1.
I’m not sure which graphs you are talking about but the ones I create in google sheets have different metrics in each of the vertical axis, Is that what you meant by 3 axis.
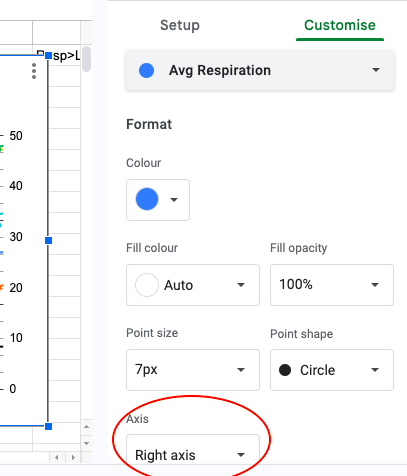
Hi sorry. Yes I couldn’t put the second vertical axis on the graph.
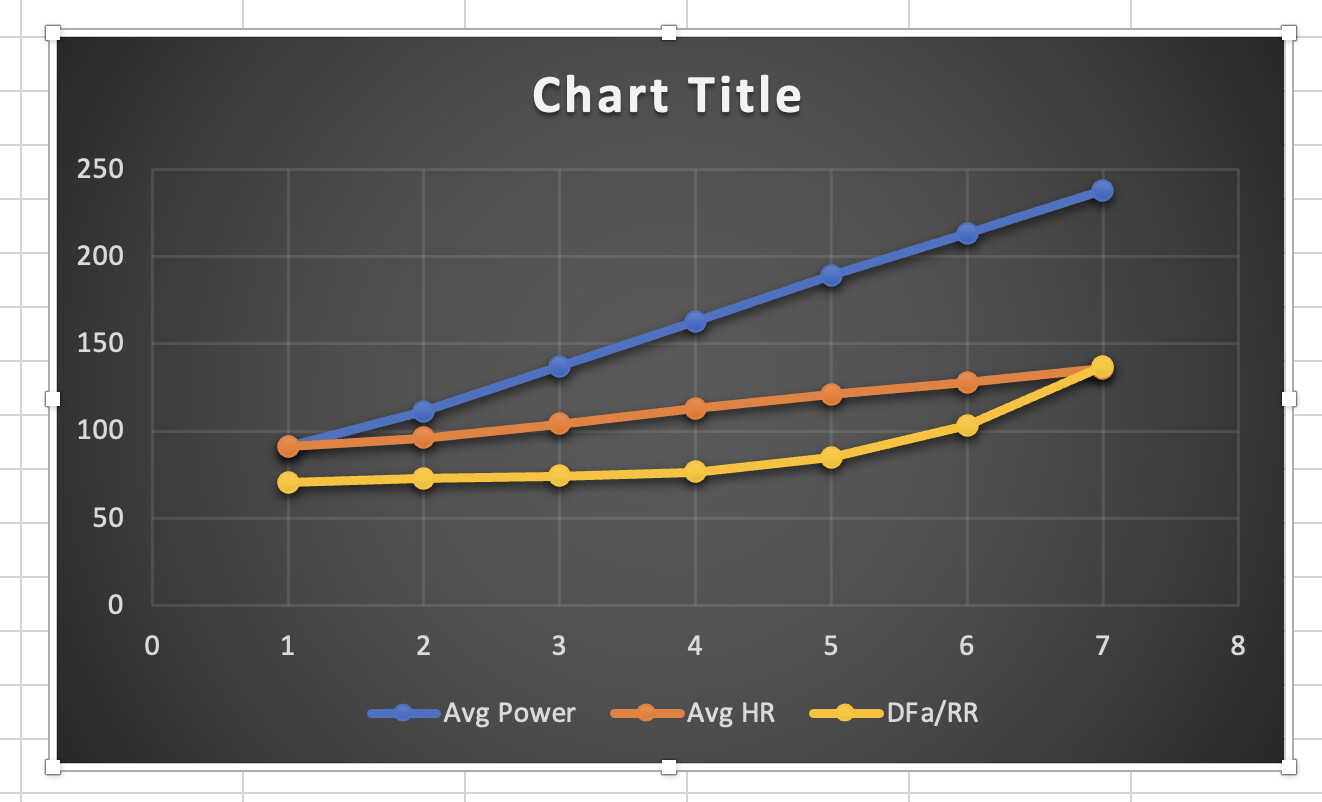
I have repeated my test but this time the whole test until exhaustion. I capture 3 laps on each step. But I must say that I had sometimes odd values where on higher power the RR/DFAa1 value would suddenly drop etc. But when I tidied everything up manually I manage to get below this graph… I think it is quite true to my state of fitness. I have done a talk test and according to that my zone 2 would be in a range of 160-180W power. My FTP/Critical Power test would suggest my LT2 would be around 290-310W last time I did it. What do you think guys?
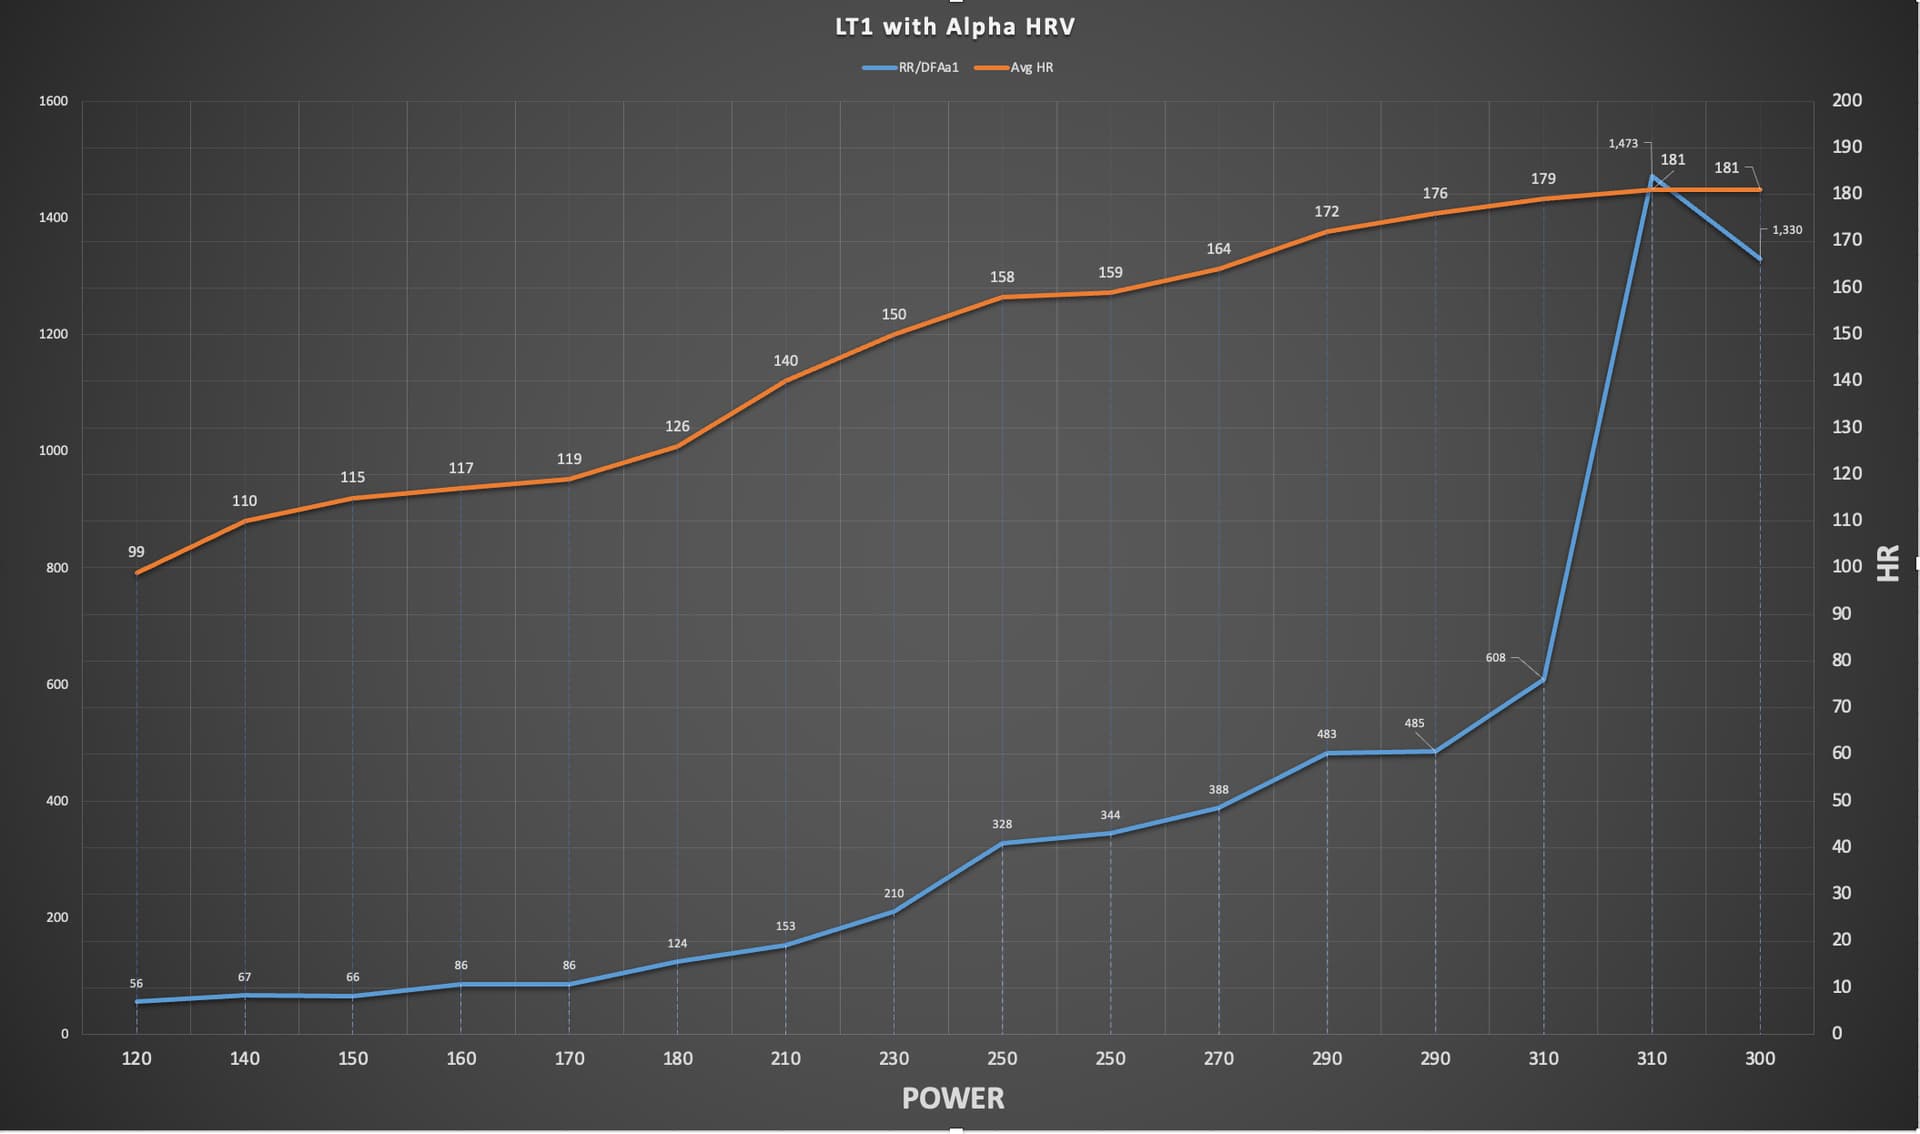
Looks like a good test. I recall reading on here from eithr @Inigo_Tolosa or @Luisma_Gallego_Soy_P said hat the RR/a1 is not very good at identifying LT2.
If that was my graph 160-180 is where I would put my Z2