They are not the same
Good comparison, thanks for everything
They are not the same. Fitness dashboard uses the 2 min window, while AlphaHRV uses a 200 beat window. At higher HR, the window is shorter and this means that changes show faster because the average is taken over a shorter time period. It’s not up to me too judge what is best, I don’t know. And the preprocessing of the signal is also different because the ‘smoothing priors’ algorithm takes too much processing power to be used on the head unit.
The important thing here is that the trend for both metrics is very similar in the region where AeT can be expected. We are no longer looking for a threshold value, but for a deflection point. And the fact that there is a desktop app (be it not released yet), means that things can be double checked from the original RR stream.
Regarding that deflection point, it is not clear to me were we should judge the Aet. Is it when the linear trend for lower intensity starts to break? Or is it at the point were the curve has its maximum slope change???
The first option would be were the second derivative of the curve reaches a first peak. The second option is more like the crosspoint of the 2 linear regression lines. Difference is easily 3-7 bpm…
Then again, if you consider AeT as a limit were you should stay 5-10 beats below for LIT, the difference becomes less important.
Still a lot of things that are not clear yet, but my primary goal here was to check that the BreathingRate calculated from HRV had enough credibility. And that check was positive.
Another thing is that the exact timing of the value of a1 returned by Fitness Dashboard is not 100% clear to me. The csv data as interpreted by me, shows an a1 value that is the avg of a window around the point in time, meaning 1 min before and 1 min after. A data line shows:
time x, a1, start=x-1m, end=x+1m
I find this very confusing so my interpretation of the timing could be off by 1 minute.
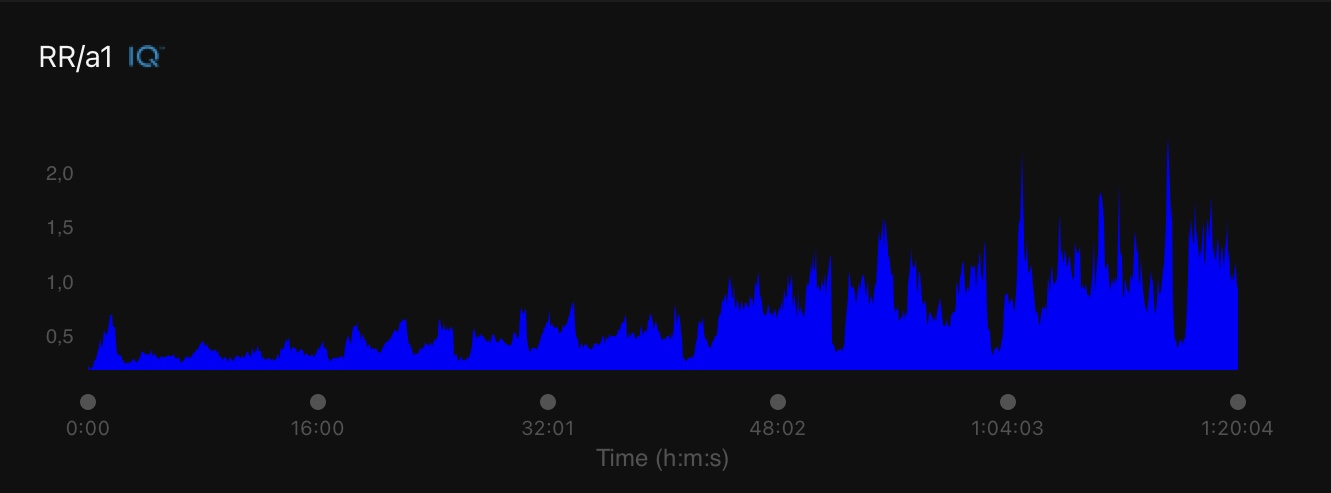
I still want to run the RR-stream recorded on the Garmin through Fatmaxxer to have a third comparison for a1. And what I can tell at this moment: the RR stream from the Garmin has only one artifact, and that is the early beat I had during this workout. The sensor itself was able to filter and correct the 2 missed beats that I noted from the ECG. While the RR stream from Fitness dashboard had 7 artifacts that needed manual correction.
2 Likes
Comparing two signals can be done with rolling window correlation: you decide of that window size. Good tutorial on that processing, with examples, is available here:
Signal processing tutorial on FFT, instantaneous phase synchrony, and rolling window correlations
I did a quick test of that method using one of the NeuralKit2 signal processing routines " signal_synchrony()". On two sets of 1000 points accelerator’s data from different moments of my jumping session I applied 100 points rolling window. Here is the result:
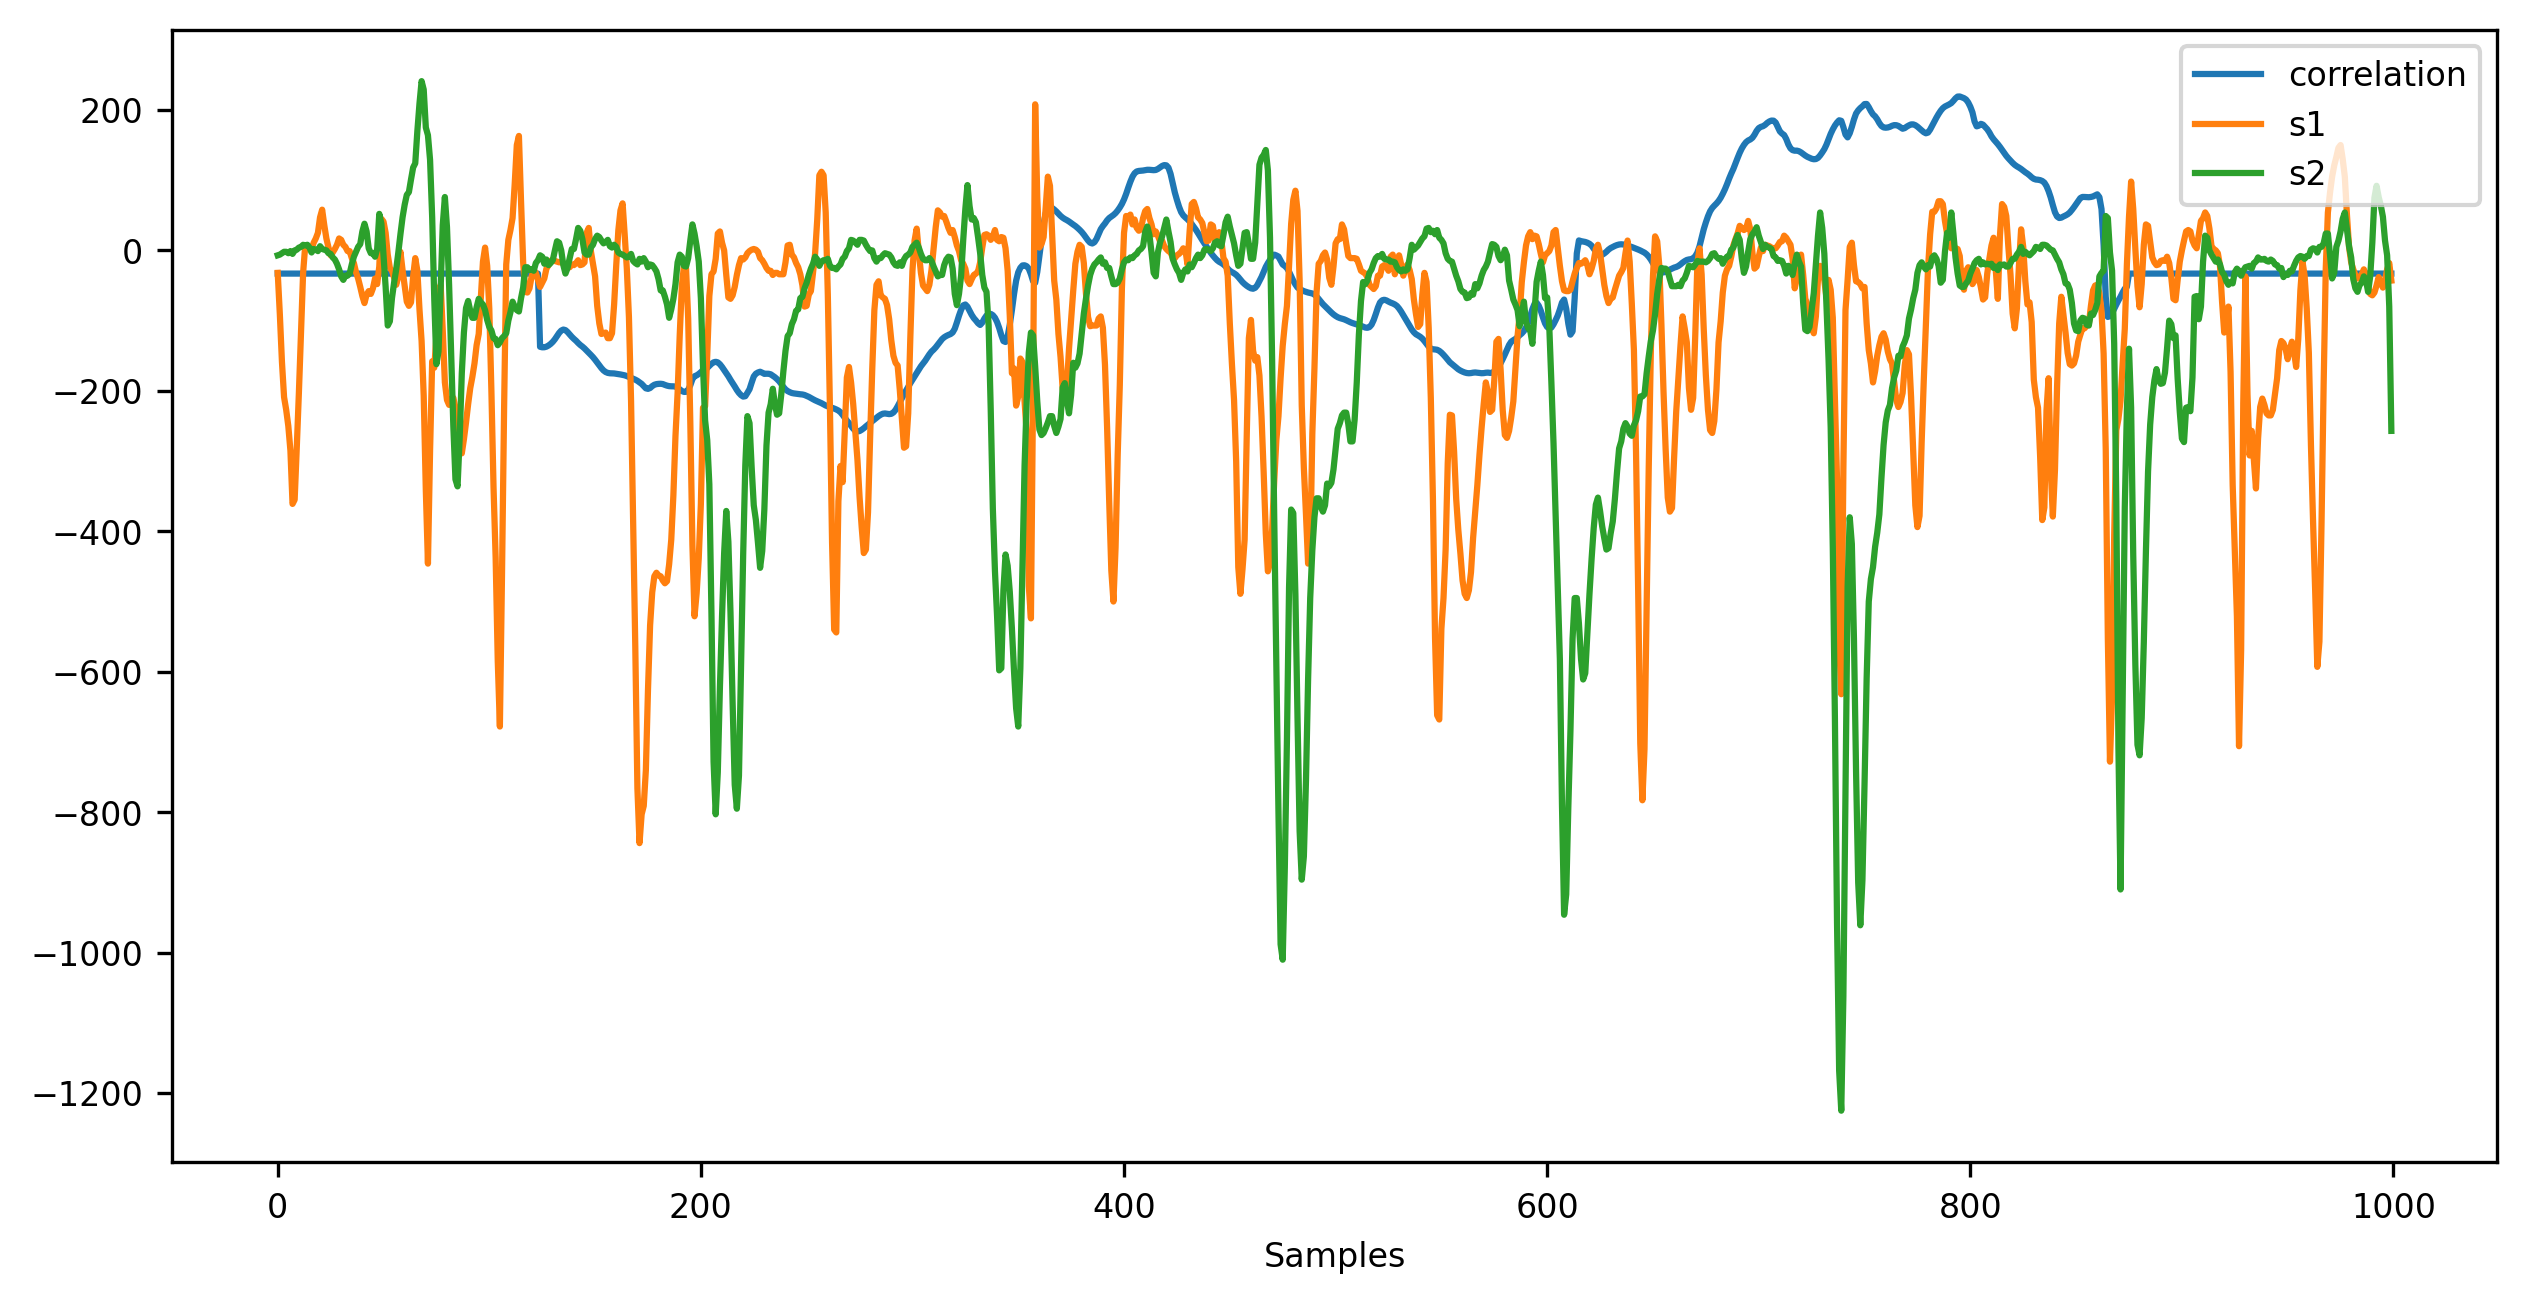
That way you will discover if correlation is always > 0, if signals are shifted or are not in phase. Of course signals can be also very well correlated but only vertically shifted, which is a different story.
The reference to the algorithm used for Detrended Fluctuation Analysis is here: Detrended Fluctuation Analysis.
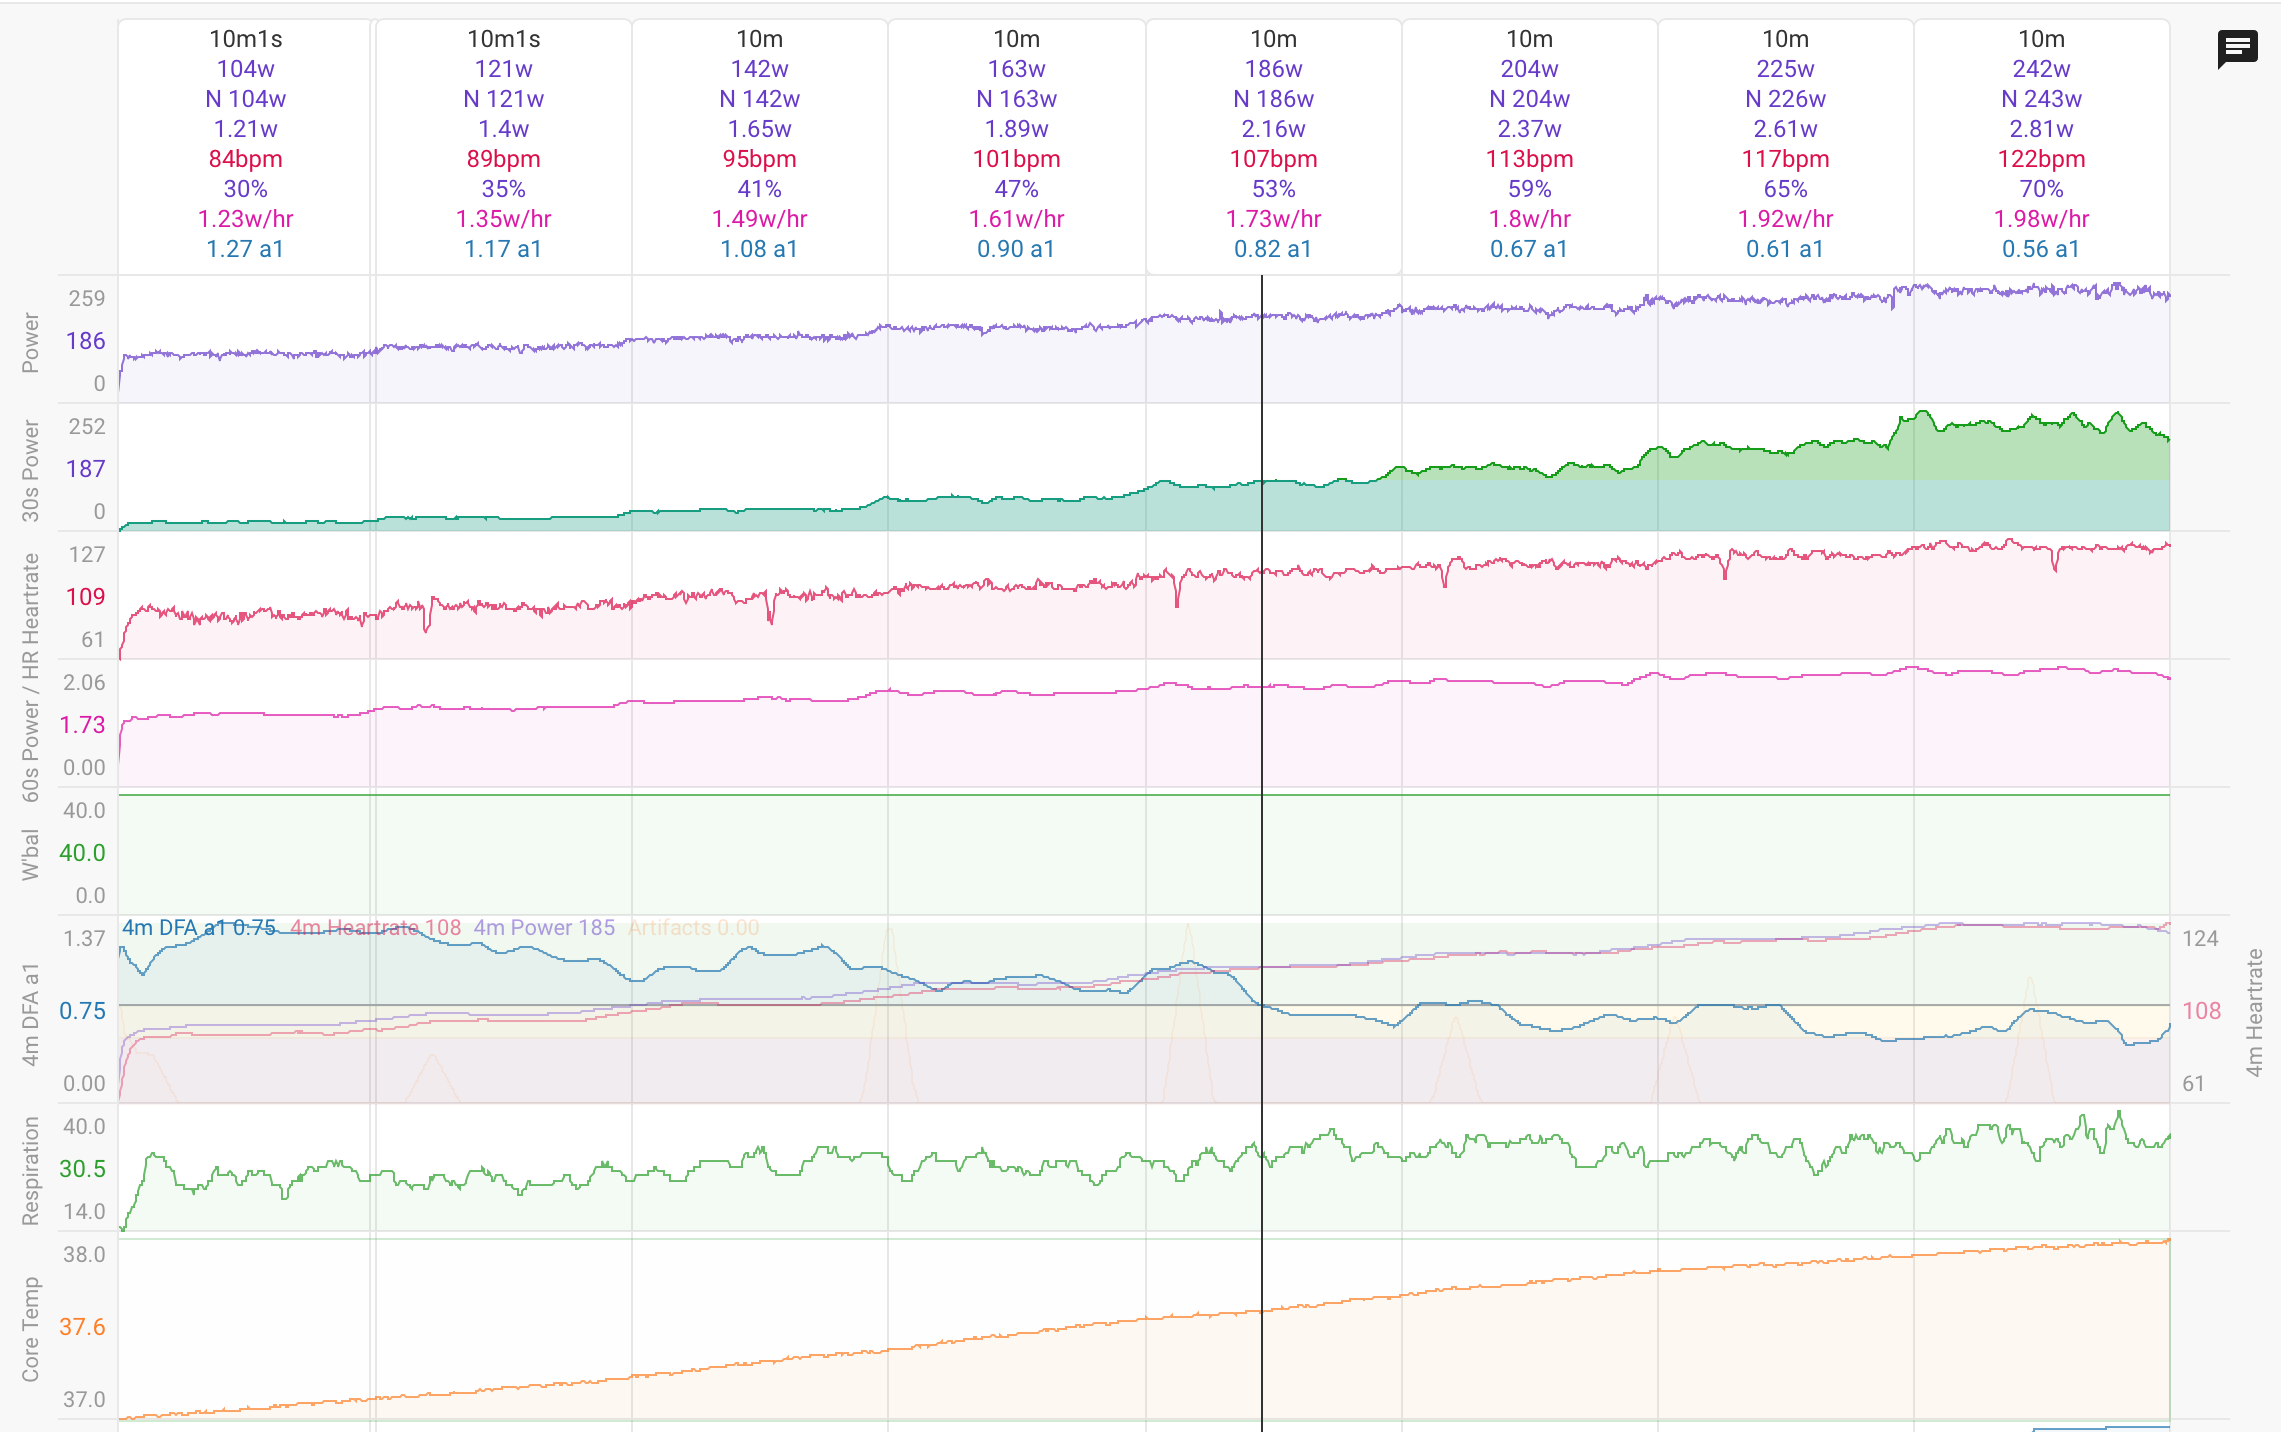
So today I took some time to do a proper ramp test of 10 min/step with steps of 20 watts starting at 100 watts.
I didn’t go past 240 watts as I felt that was already to much effort to be very easy riding.
I expect my FTP to be somewhere in the 340-360 range, but haven’t really tested it recently.
I’m mainly interested in my LT1/VT1 to make sure I don’t do to much on the easy rides.
From the following results; would I be right concluding my LT1/VT1 is around 110 bpm?
If that’s the case, what would be your suggestion to raise it?
Did you do a warm up before starting the test?
I didn’t. I figured the steps would be long enough and start low enough to not need it.
I’m having doubts on the validity of this test.
The dfa stream shows signs of ‘uncorrected errors’ (errors that were not detected/corrected by the tool). Uncorrected errors typically show as jumps over the width of the calculating window.
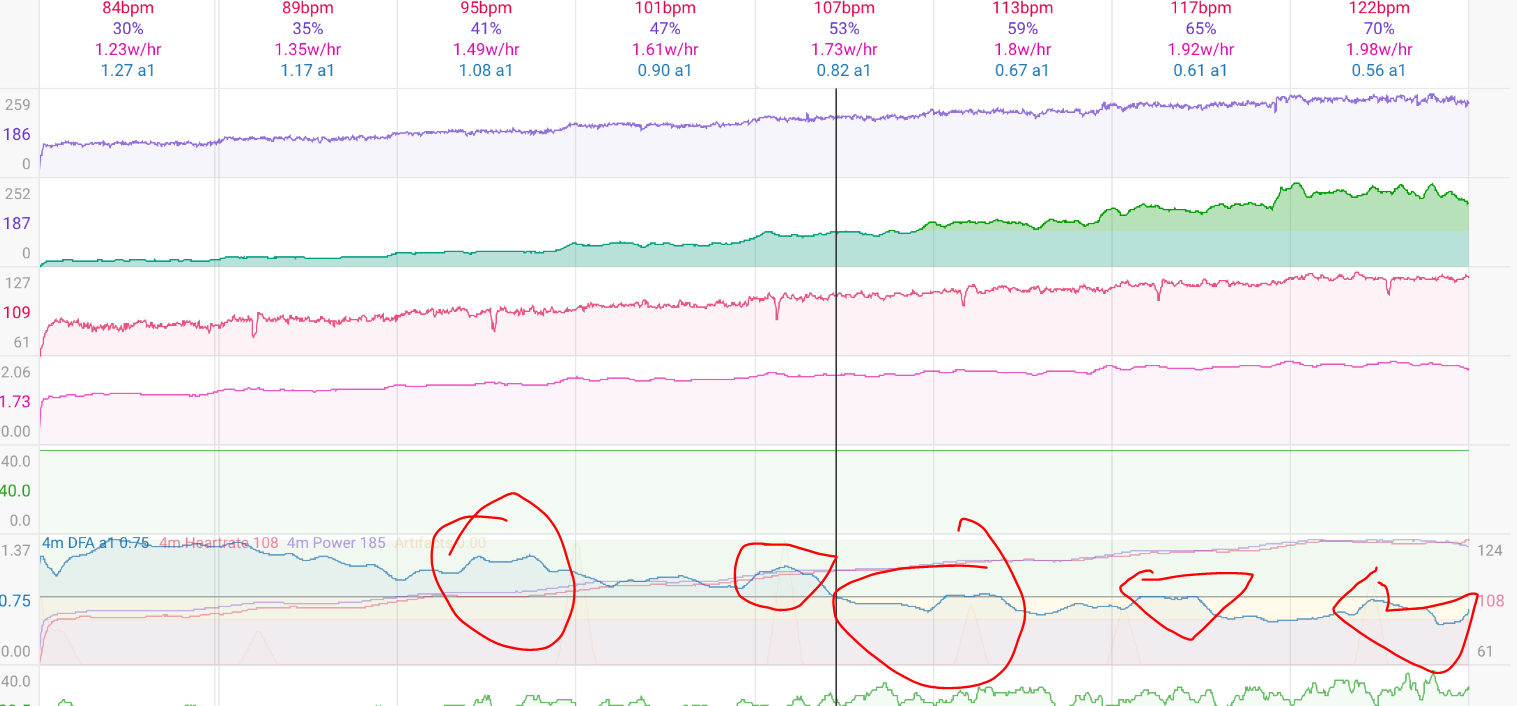
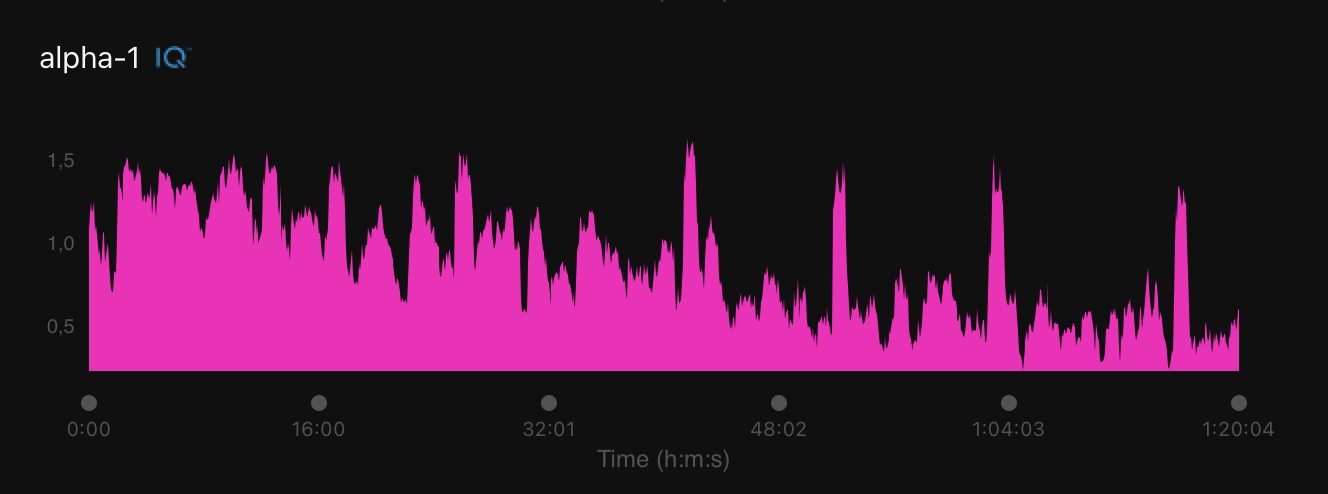
You do seem to have a recalculation of the dfa in this trace. Can you post a screenshot with the dfa and Artifacts trace as they come from the AlphaHRV field?
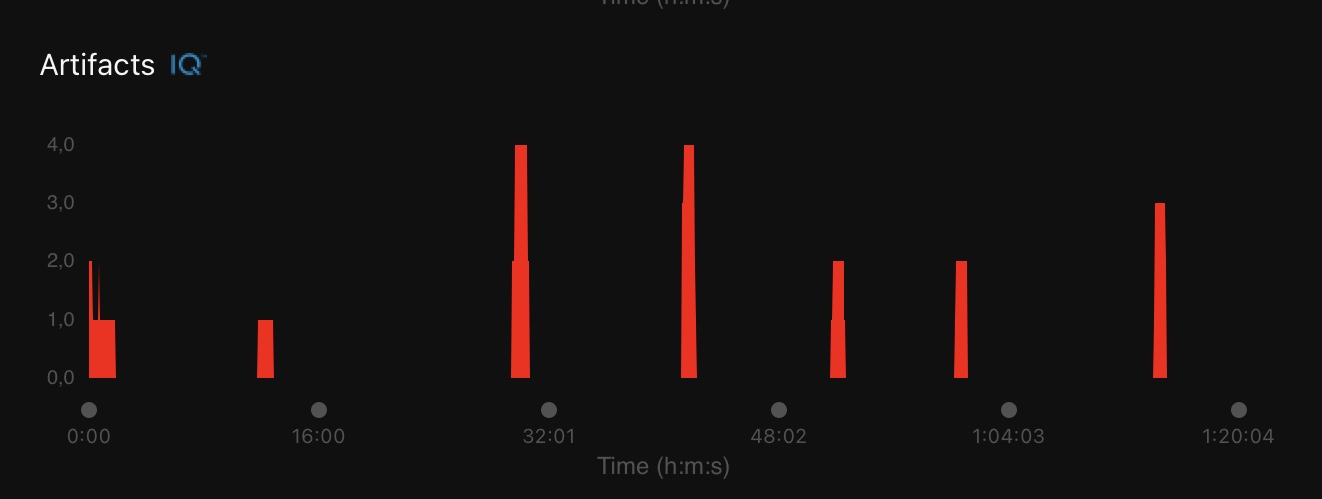
I wonder if there are lots of corrected errors, which show up in the artifacts stream.
The test as proposed by the dev of AlphaHRV is 6 min steps of 10%. Test preceeded by 15-30 min very low intensity (~40-50%) to eliminate any possible lactate remainders. And you should go a little higher then what you did here. 90% usually gives a better view on where the curve is heading above AeT.
Thanks for giving some insights around the proposed protocol. I figured, the longer the steps, the better. I guess by 10% you mean 10% of FTP?
Concerning the artifacts/errors, I think I know where the are coming from.
Those were following burps. Sometimes they occur after drinking, but not always. I always noticed my heart rate dropping quite a bit following a burp and now they show up in de HRV/DFA alpha-1 as well. Makes sense, but didn’t figure it out myself. The artifacts/errors occur after a drop in heart rate that can only be explained by a burp, also shown in the screenshot  . Also I remember to make a mental note of them and I now I remember it was roughly once per step.
Otherwise the recording looks pretty clean, as far as I can see.
That doubt is always with me.
Should we go with no water during the whole test?
Drinking water should not affect or create artifacts, although it is possible for the heart rate to be affected and increase a few beats. My advice is that if you are experiencing many artifacts, move the Polar H10 to the left. Many of us have a shifted respiratory axis, and the signal loses intensity. You can try this with Fatmaxxer and Polar H10
1 Like
I can clearly seer that my hr goes up a bit when drinking water.
i didn’t know this would not affect or create artifacts.
tks
With me it’s not about drinking the water per se, but more about some gases coming up after. That, in fact, makes the heart rate drop a few beats. As shown in the earlier screenshot.
Sometimes this even happens without drinking involved.
Will try move the strap a bit, though.
that also happens.
You won’t solve anything moving the strap or the sensor in this case.
Artifacts caused by light burps or similar are very difficult to be corrected in real time, even offline platforms have difficulties to deal with them.
I have tried some strong correction approaches for this specific condition in alphaHRV, but I want to be sure I’m not affecting any other normal behaviour before releasing an update that includes this feature.
2 Likes
Applying stronger corrections doesn’t seem like the way to go to me either.
But what are the practical implications of this.
Do the artifacts of this origin make the test invalid, like @MedTechCD earlier suggested, or is it possible to look around them one way or another?
Hi Guys,
I’ve just bought and installed FatMaxxer app looking after the “peak R voltage” in attempt to find the right place for the H10 but I could not find a way to have this on the screen.
Any one?
Appreciate any help.
Tks,
Fatmaxxer needs both BLE channels to display ECG Peaks. Nothing else can be connected in BLE to the H10 if you want to see it.
If you use Kubios app to display the ECG in real time, it is much easier to position the strap.
Kubios app is free.
Fatmaxxer can be installed for free by downloading the apk from Github.
3 Likes
Thank you very much.
I haven’t read this on any place else! What a waist o time.
I really appreciate your knowledge and support.
Best regards,