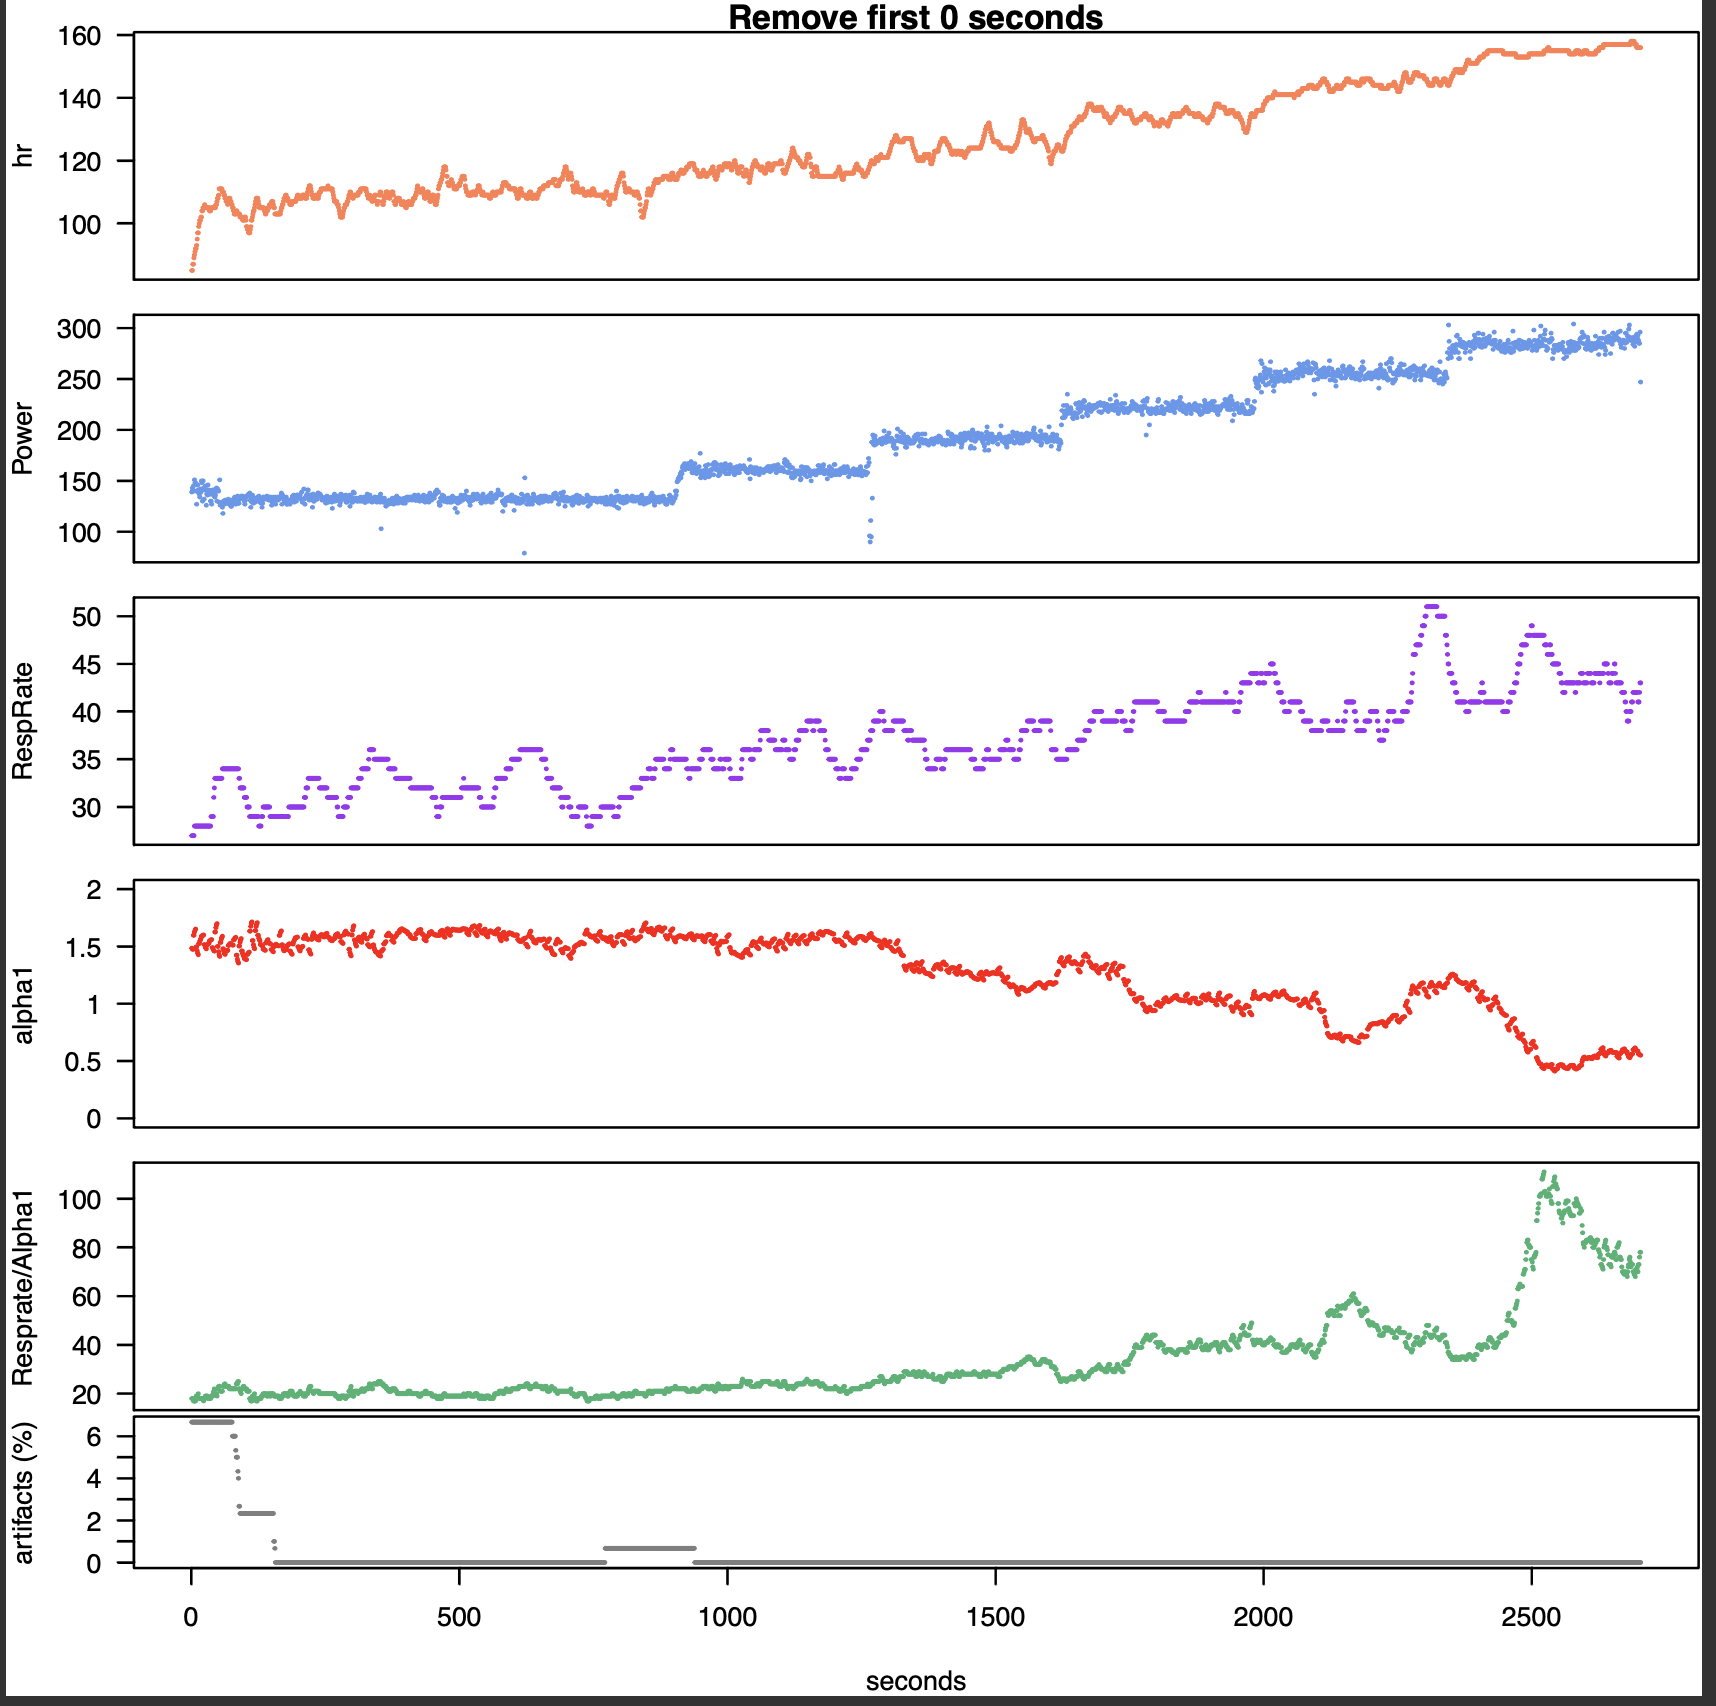
I am mathematically oriented as it is my job, I can’t make some many points about philology. However, what I am just trying to say with the above is that data does not look good in the last two stages, the bilinear model is just something on top to analyse data and provide the estimate of LT1/2. Let’s put it this way: does the trend of the data in the last two stages look good to you or does it meet your expectations?
I would be curious to see how the time series of the data used by @Tito looked like (as he has also lactate test to back up).
Sometimes sh*t happens and it is likely to be the case of my ramp test: if that’s the case, it is fine as I can redo the ramp next month. It is just to be aware about the quality of data and make the right calls.
Threshold estimation is perhaps one way of using it, hence we don’t normally test if we don’t have lactate or ventilatory tests. We are in a process of continuous improvement, we are only two people and with limited resources, fortunately thanks to specific collaborations we can continue with the improvements, it is possible that in a while there will be a significant improvement, we are working on it. We appreciate your comments and we take note of everything to improve the process. The rr/a1 ratio is being used as an internal load control and even assimilation of external loads vs internal loads, at the moment the results are good in a small n, all this needs a period of analysis along with a specific period of training so everything takes a little longer in time.
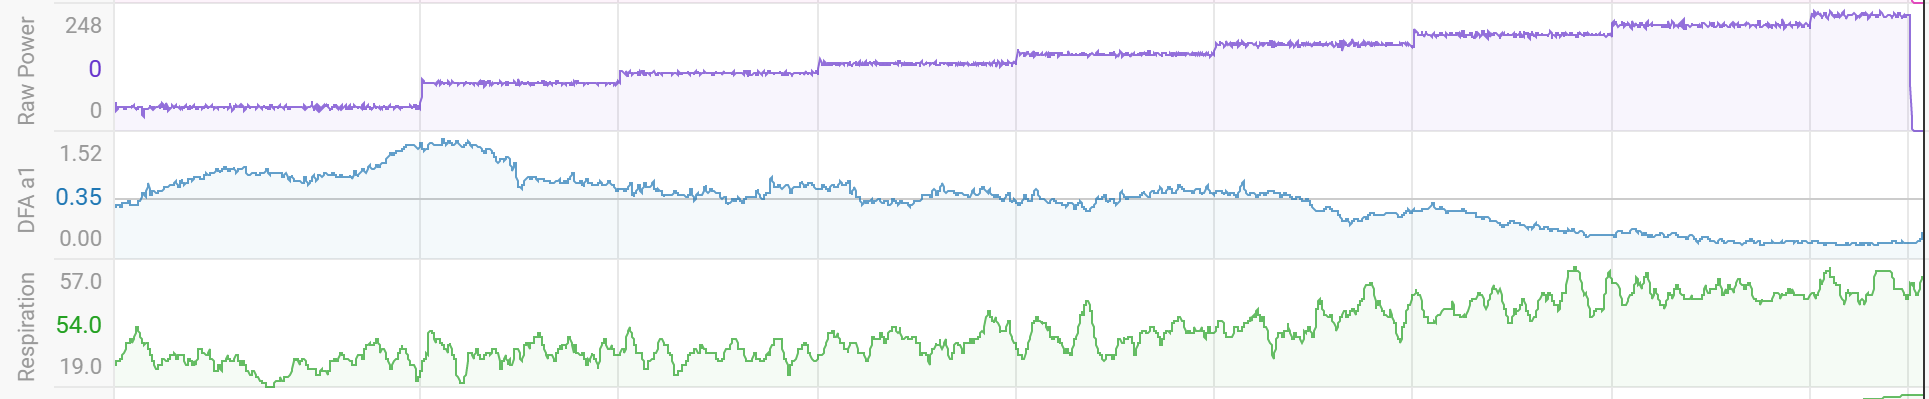
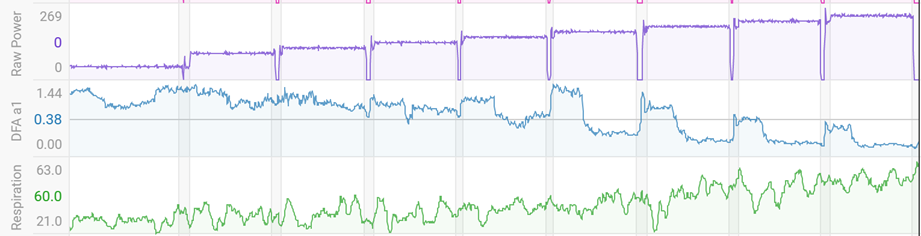
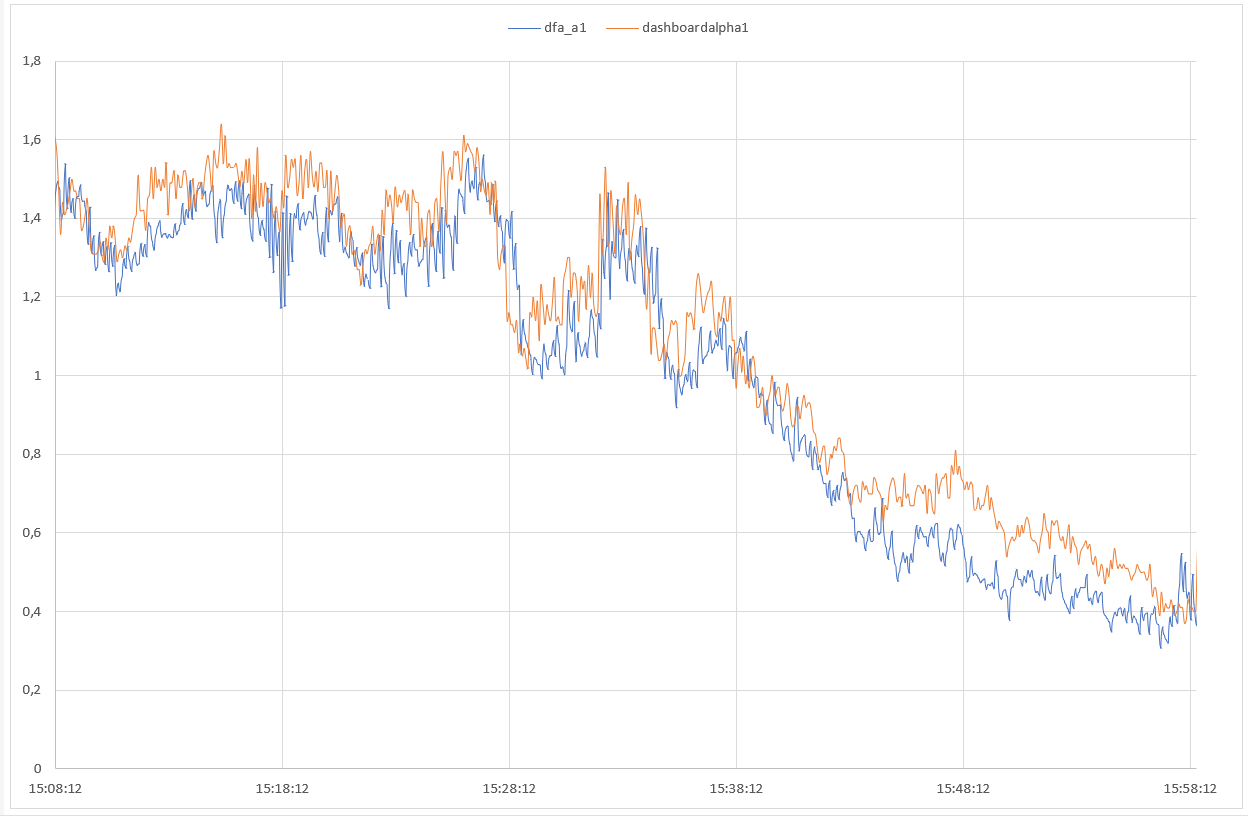
My apologies @Tito, I just found out that you had already attached the data I was curious to look at. I am attaching below the time series from the first and second test @Tito did, respectively
In the second test @Tito stopped at the end of each stage to take blood samples for lactate, but the trend of alpha1 and RespRate are good, meaning that they are meeting, at least, my expectations. @Tito 's ramps and mine (attached below for convenience) have different duration, but the comparison of the trend of Alpha1 and RespRate is quite striking and clearly highlights that in my ramp something went wrong; I am assuming that there is no artifacts that went undetected as the data has been also processed in Matlab by @Luisma_Gallego_Soy_P
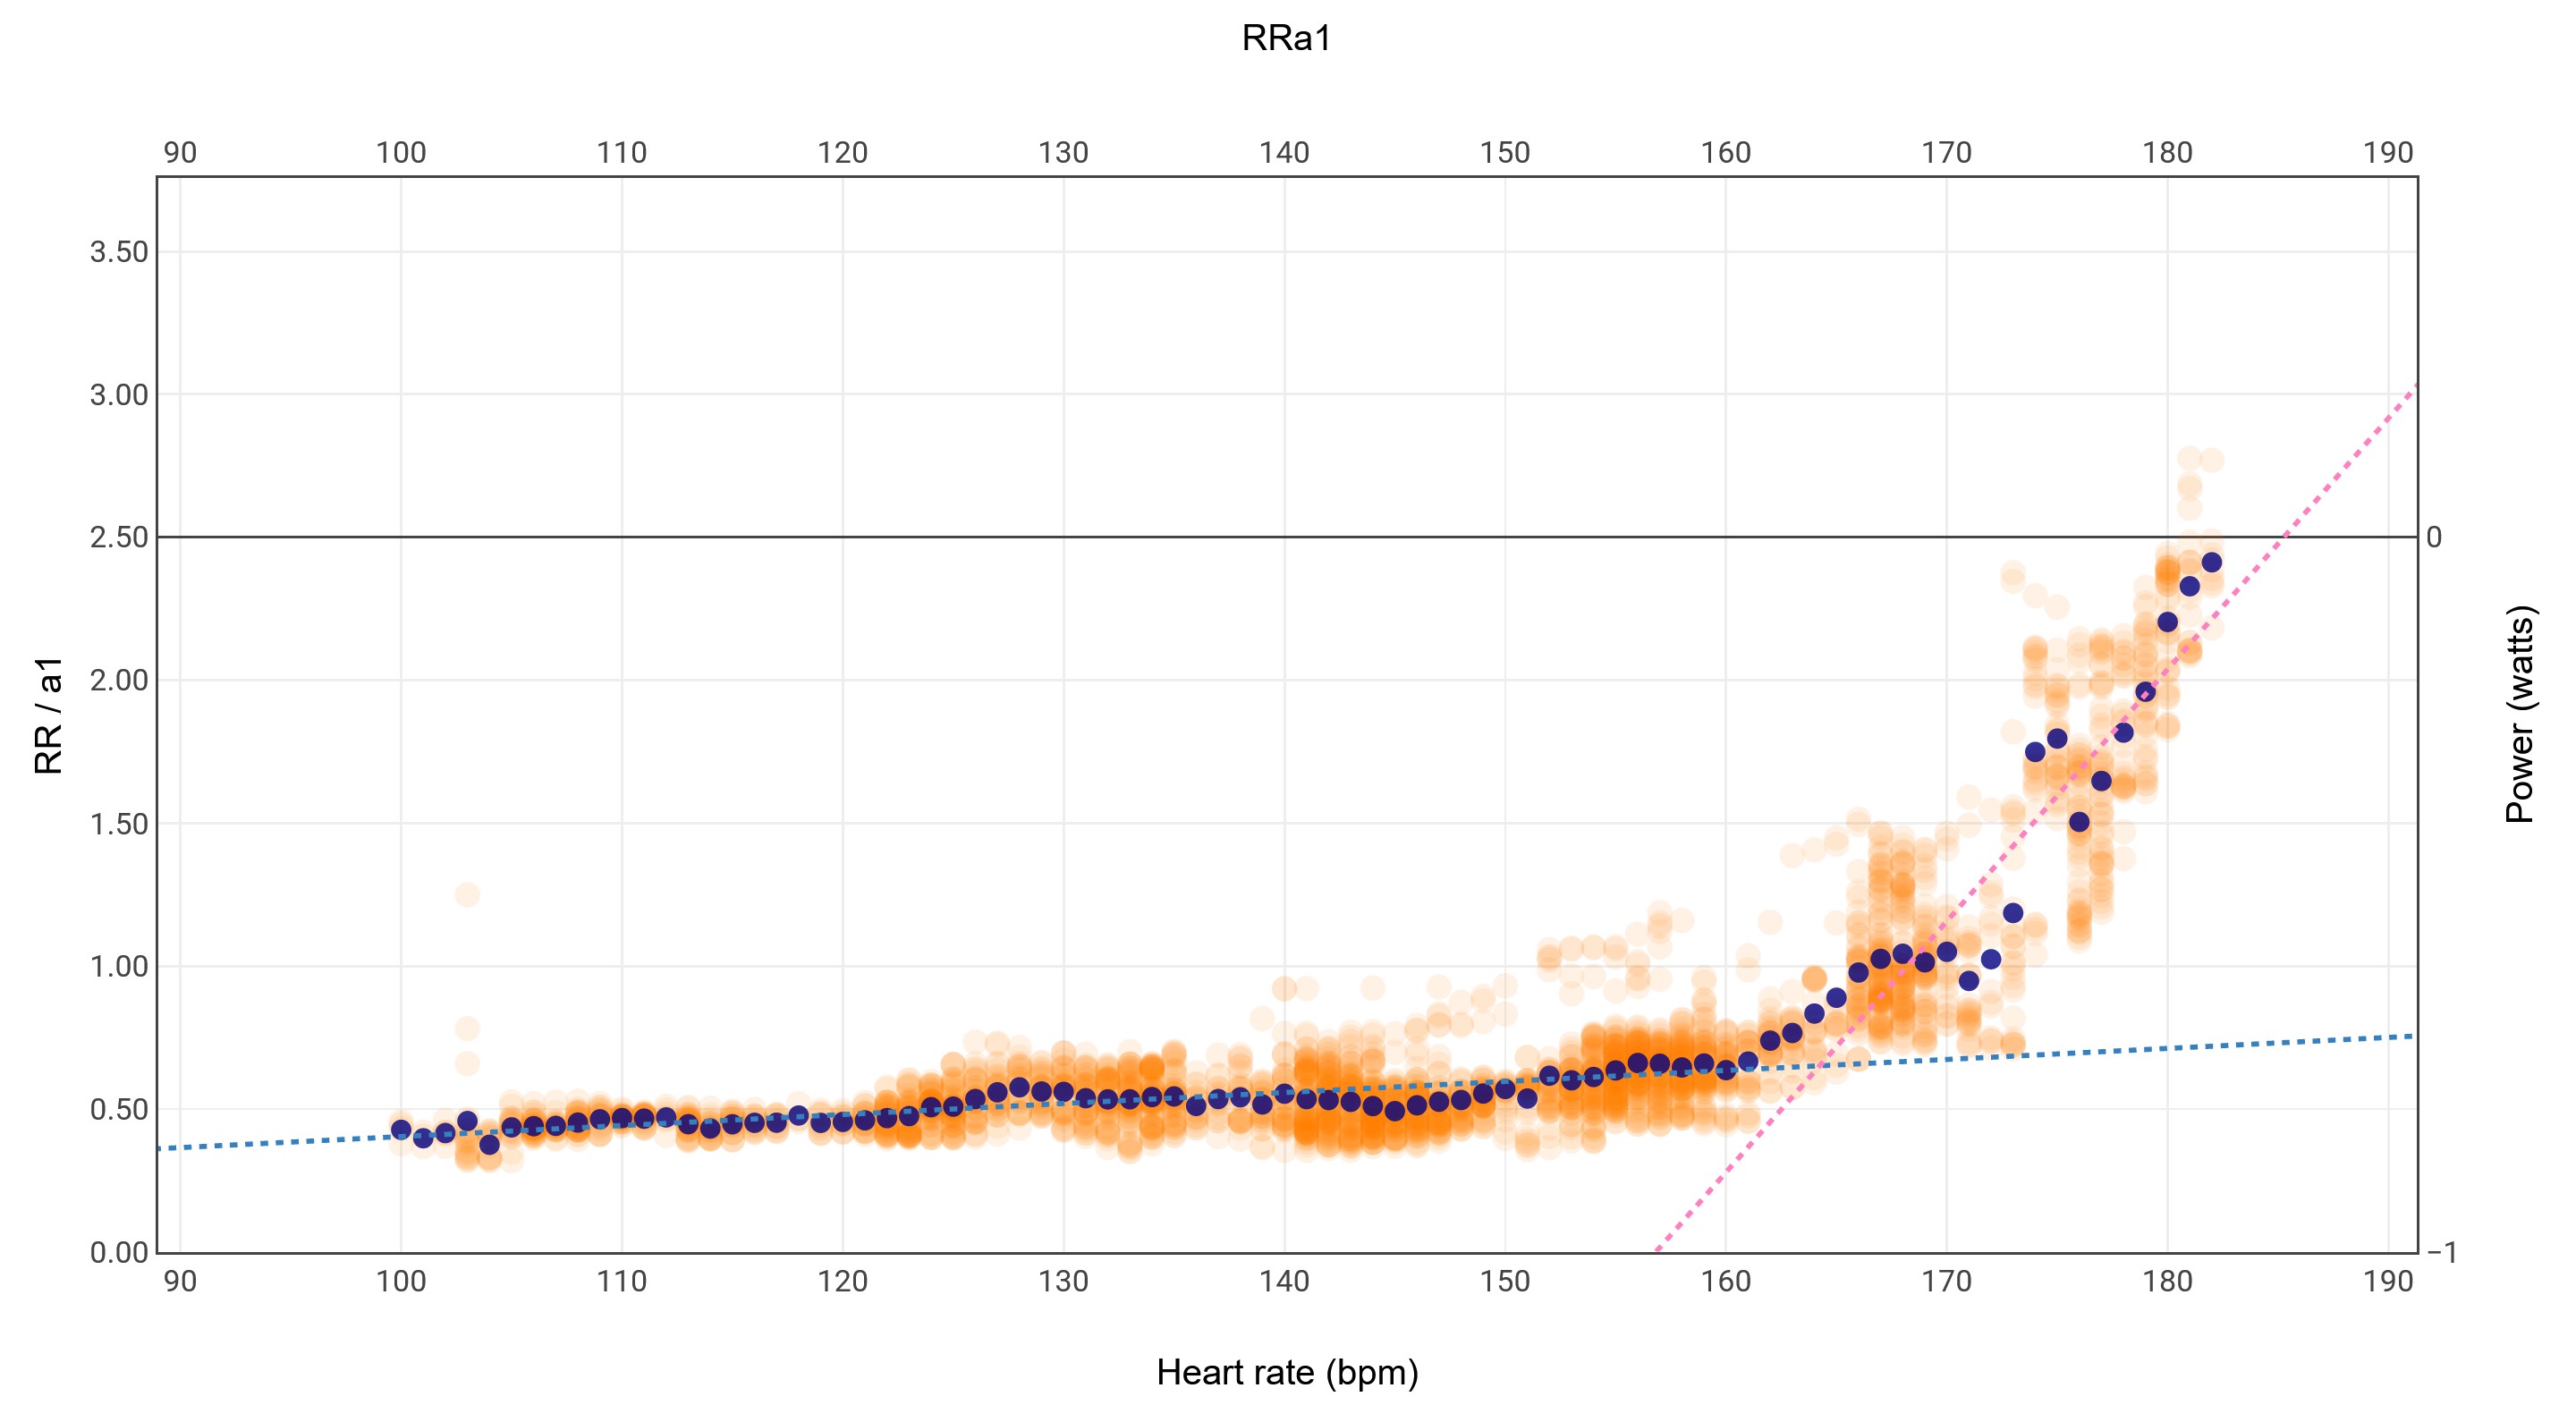
Colleagues, I can ask you to take a look at the test chart (according to the protocol, 15min 40%, 6min 50%, etc.).
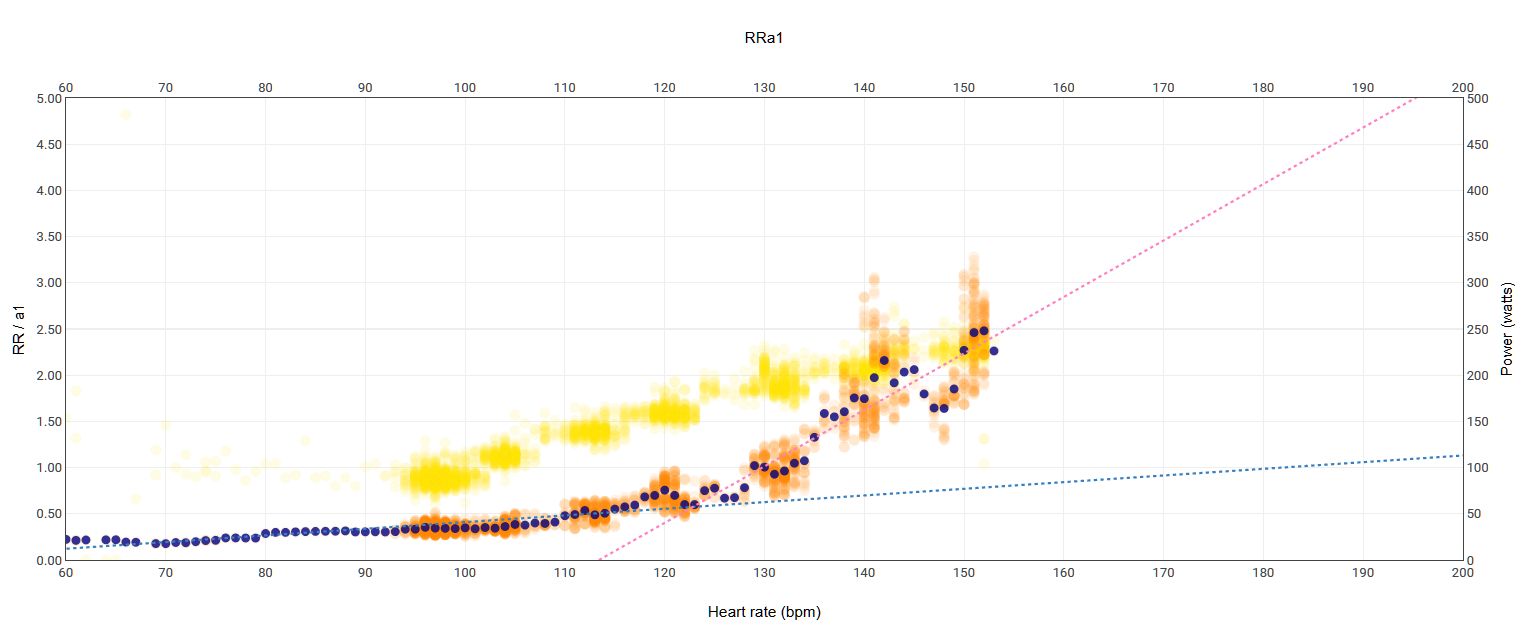
Do I read well that the collapse occurs at 123BPM?
Is this the intersection of two lines of trend, blue and pink?
If I am right, is HR correlated with power?
Is this read after hovering with “123BPM” and reading in pride what was the power at that time?!
Thank you very much for the answer!
You wrote that 123-125bpm is the end of the upper zone “Z2”.
“Z2” Do you mean the power zone?
And if I can still ask for an answer, where does such a margin “110-125bpm”?
125BPM I understand this (break point, cutting two trend lines), but I am interested in the beginning of this range, i.e. 110bpm.
Mathematically, it is 88% with 125bpm.
How do we estimate this beginning and is it important at all?
For low intensity riding I tend to use HeartRate zones and just monitor the power. Ideally your HR and Power Zones should align but quite often mine don’t.
As regards the 110- 125 range, that is the range I would try to keep my heart rate in when doing a zone 2 ride 110bpm seems to be where you are getting a slight rise in your respiration rate before it kicks up properly at about 123/125. I pick the middle of the range to make sure I don’t go above it. Everything I’ve read about this type of training says you are better to be a bit on the low side rather than on the high side.
Other people though have different ideas. It’s not a simple subject.
Thank you very much!
After your entry, I looked at the chart and you are right, at 110BPM there is a slight increase in RRa1.
This is not a mathematical percentage, as I thought before.
Thanks to you now I know how to look at such a fragment of the chart.
Once after performing a “full test” let me come here with a request for help in reading the LT2 place
EDIT:
Oh, I analyze my HR zones and now I noticed something interesting.
From the recent “race on Zwift” Interval.icu, he signaled LTHR growth to 160bpm (from 20 minutes). I made a change in the interval.ic settings and after this change my “Z2 zone for HR” is in the range of 117-134bpm.
My previous LTHR was 153bpm from the “4DP full frontal” test, or 20 minutes. For such LTHR, the “Z2” zone was in the range … 112-128bpm!
This was the first test after “break” in regular training.
I’m using a Keiser m5 cross trainer that can’t log power over bluetooth. Is there anyway I can use the RRa1 chart without power data in intervals.icu? I’ve made sure the activity has HRV data but the chart isn’t showing via “add chart”.
Edit: Ignore I read the entire thread again and after playing around I understand how to plot the chart. This has convinced me to become a paid contributor. The bleeding edge functionality in intervals.icu is unrivalled!
After your last edit, I assume you are now being able to see RRa1 even if power is not plotted as it doesn’t exist in the fit file. Can you confirm it? This is the way this chart should work. If not, let me know it
Did a ramp test today on the cross trainer. Seeing some nice deflection points at 162 and 172. Garmin estimated my aerobic zone/zone 2 to be between 159 and 169 based off a running test i did months ago which I didn’t trust but now do.
I’ve been training at 150bpm assuming that was the top end of my Zone 2 (max HR 200) so this is going to be a big change for me I hope.
While running (not sprints), respiration rate matches the rhythm of steps. It is 3 then 2 steps with higher running pace. I suppose the same relation to RPM will develop while cycling. Do you know about any study related to that correlation, please?
I have noticed impact from cadence but I’m not quite sure how to interpret.
Higher cadence, within my comfortable range, raises breathing rate and HR but RPE is lower in my case. When cadence raises above my comfortable range, RPE is also higher.
My comfortable range for cadence is 75 - 95 rpm. Riding the same power on both low and high cadence reveal totally different numbers for HR and breathing Rate but RPE within that range is very similar, maybe somewhat lower when spinning faster. If I do the low cadence range for longer periods of time, I do feel it in the legs the next days. Once above 80-85, I don’t notice any difference.
I tend to spin a bit faster (>90) for easy recovery or endurance sessions and a bit slower (<85) for longer sustained efforts.
This might be a complicated relationship…
I suspect that spontaneous entrainment of Respiration rate by Cadence cannot be avoided. However, that should left traces in ECG / RR. Something to consider in future HRV parameters investigations.
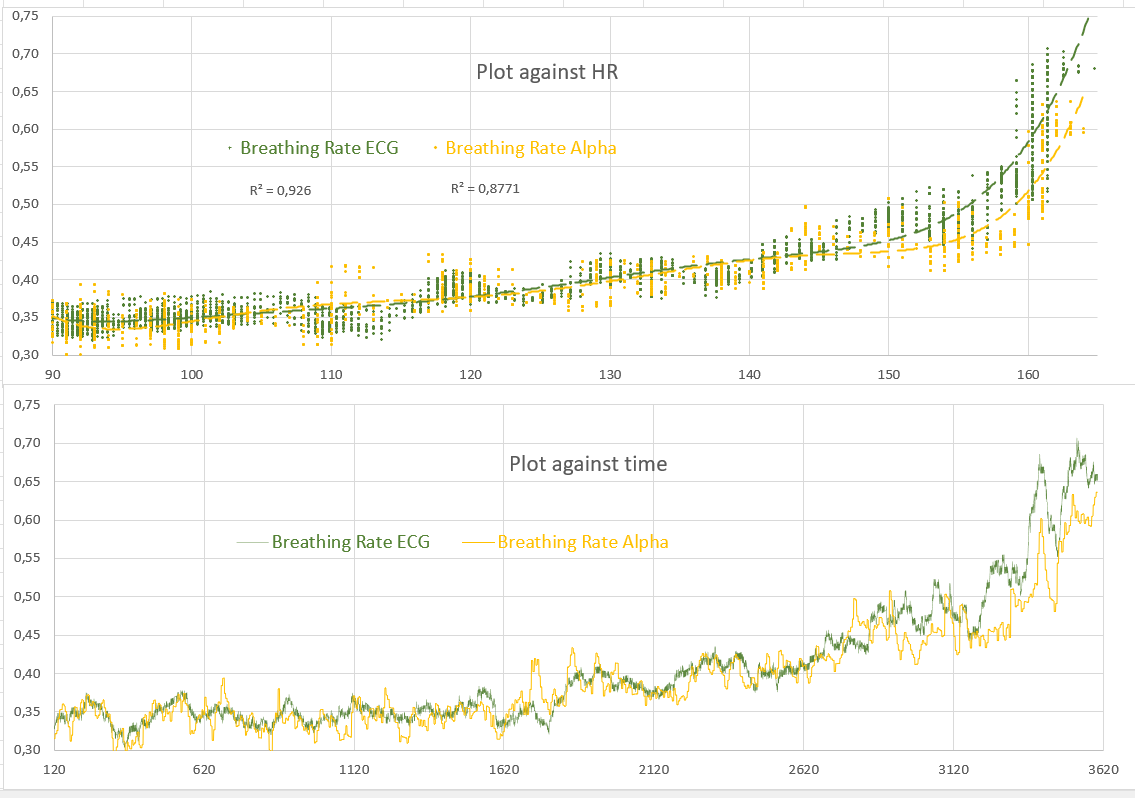
Here’s a comparison of the AlphaHRV breathing rate calculated from HRV and a calculation I did myself from the amplitude modulation of the polar ECG trace. This is from my last test with 6min steps at 10% FTP increase.
If this method for determining AeT would not work, AlphaHRV will not be the cause…
Both metrics RRate and a1 are matching very well. Considering that this was achieved on the limited processing power of a head unit, it is quite amazing.
I once again have to stress that signal quality is utmost important. The above test-file only had 3 artifacts on a total recording time of 60 min!