Thank you @canserbero and @MedTechCD for your last posts: we are gaining knowledge quicker now, as some bases are established.
Polar H10 uses signal processing sampling voltage 1024 times per second (if I had to design one I will do just that, so it is a bold statement from me). RR peaks are discovered by a simple internal routine (R peek is rather easy to spot). ECG sampling is possibly done with 128 Hz frequency, but who bother? They state in documentation that ECG may drift += 3% due to temperature. In NeuroKit2 I tested sampling of data using 130 Hz and 128 Hz: results are the same.
So my next step was to take an ‘easy’ session without activity (except different respiration tests) for about 9 minutes. From Polar data logger, I’ve got separate RR and ECG files. After some gymnastic with python data format (mind that I do not program in Python), I manage to provide correct data to display nasty (to ECG) charts related to Kubios peaks correction method.
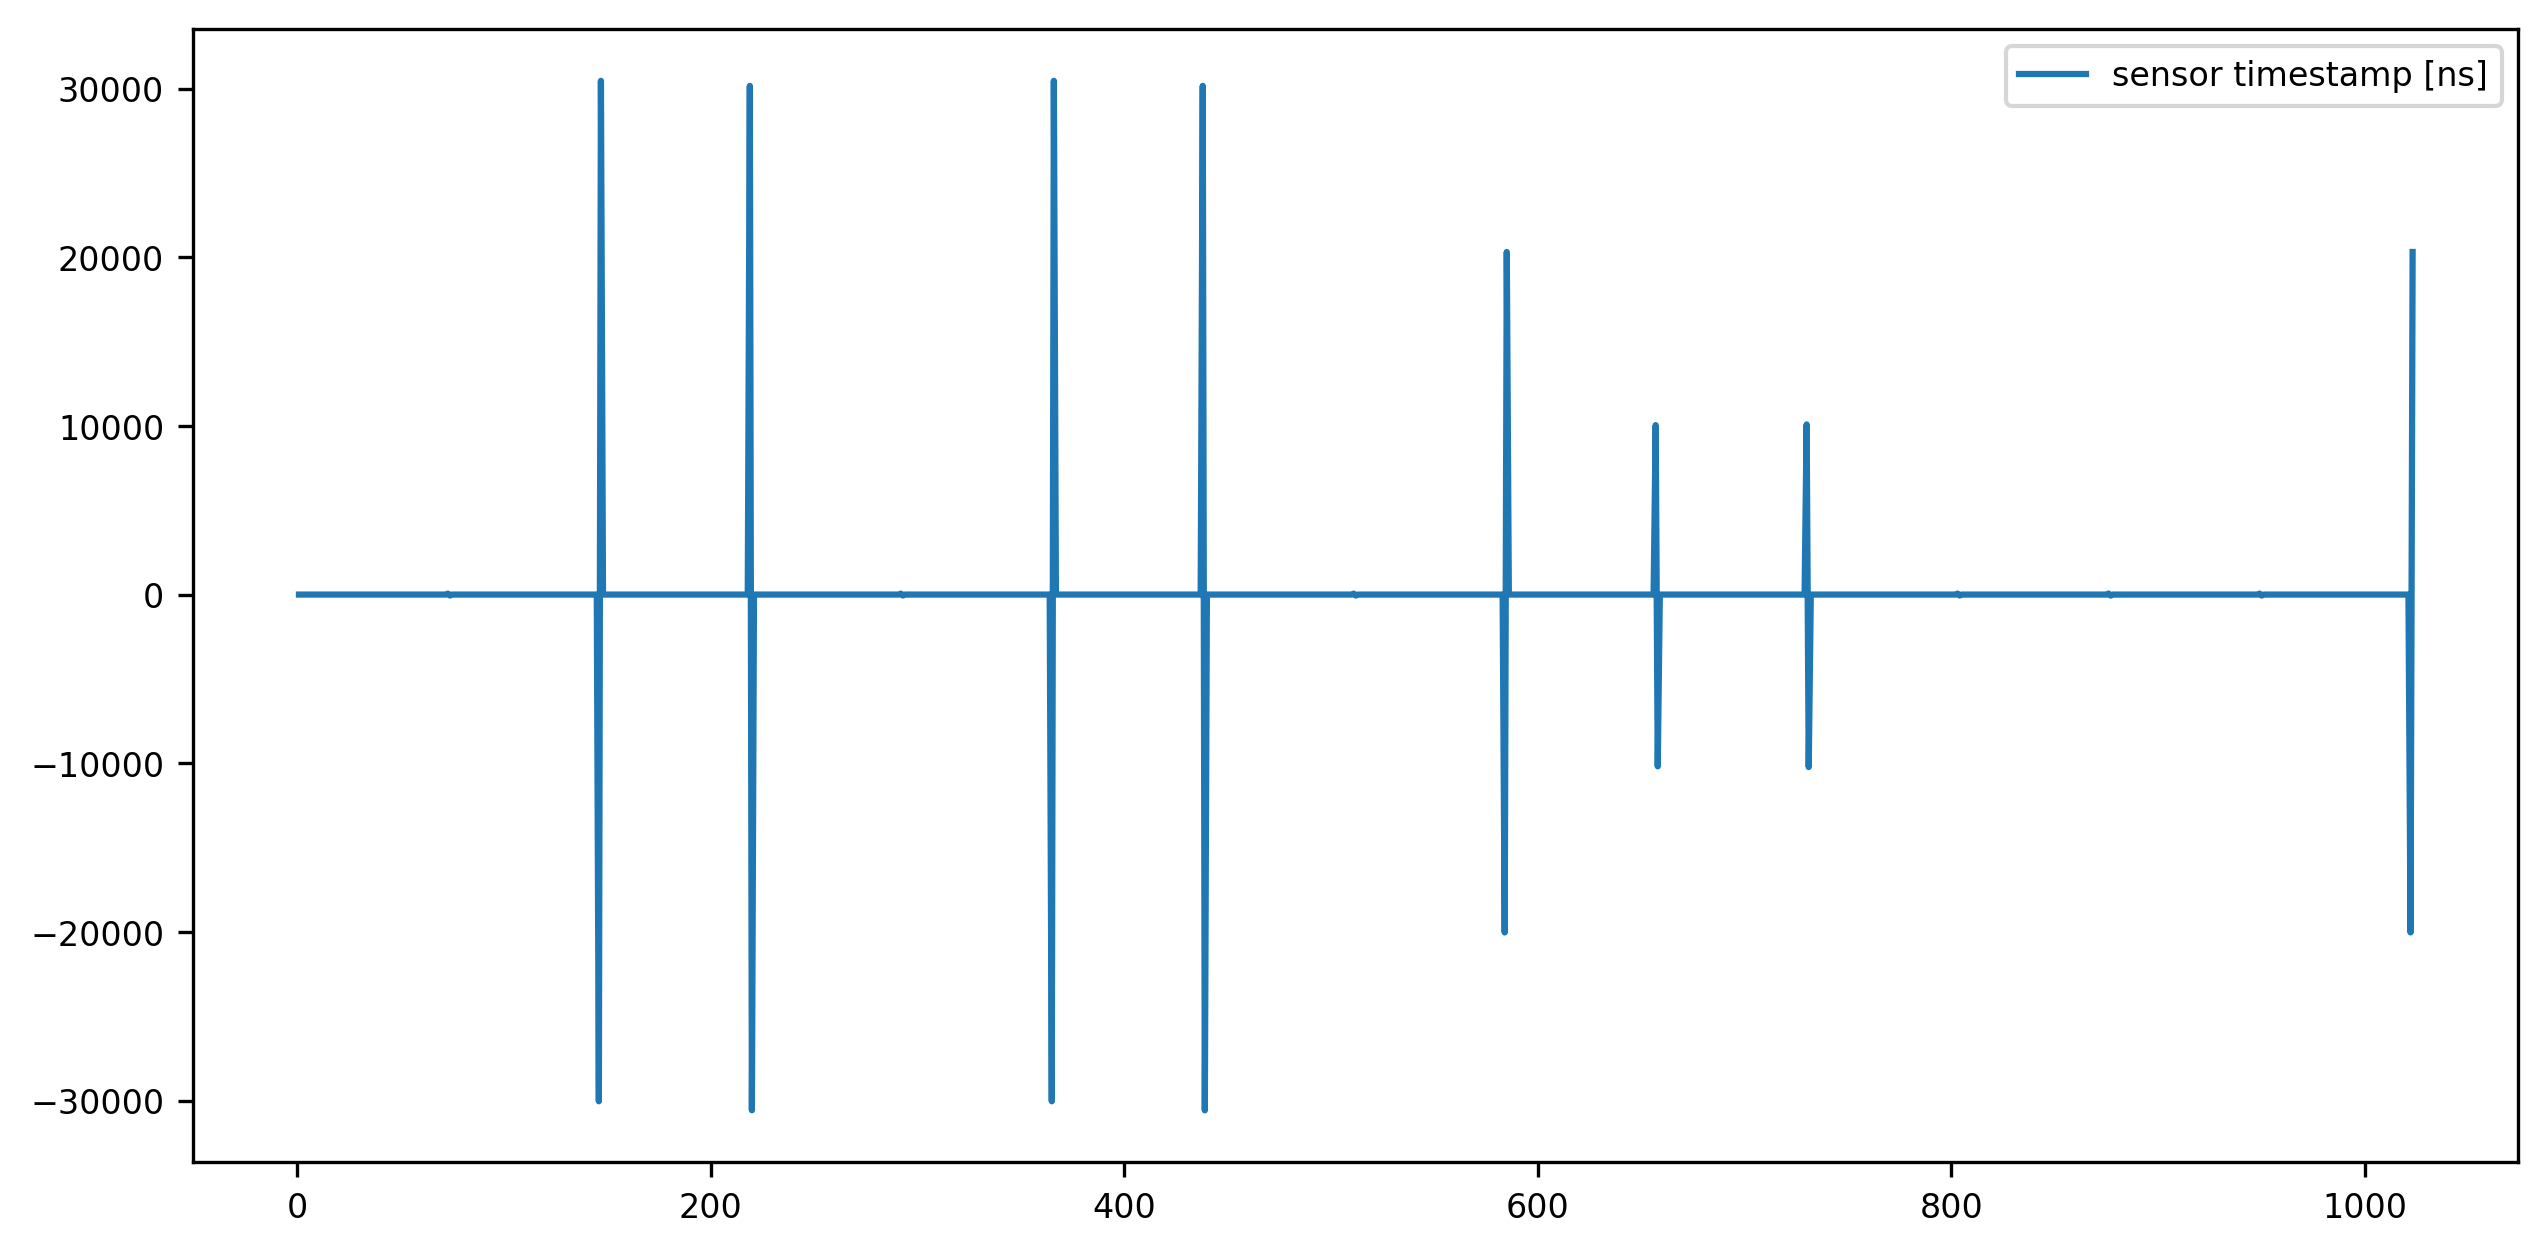
This one is based on ECG csv file:
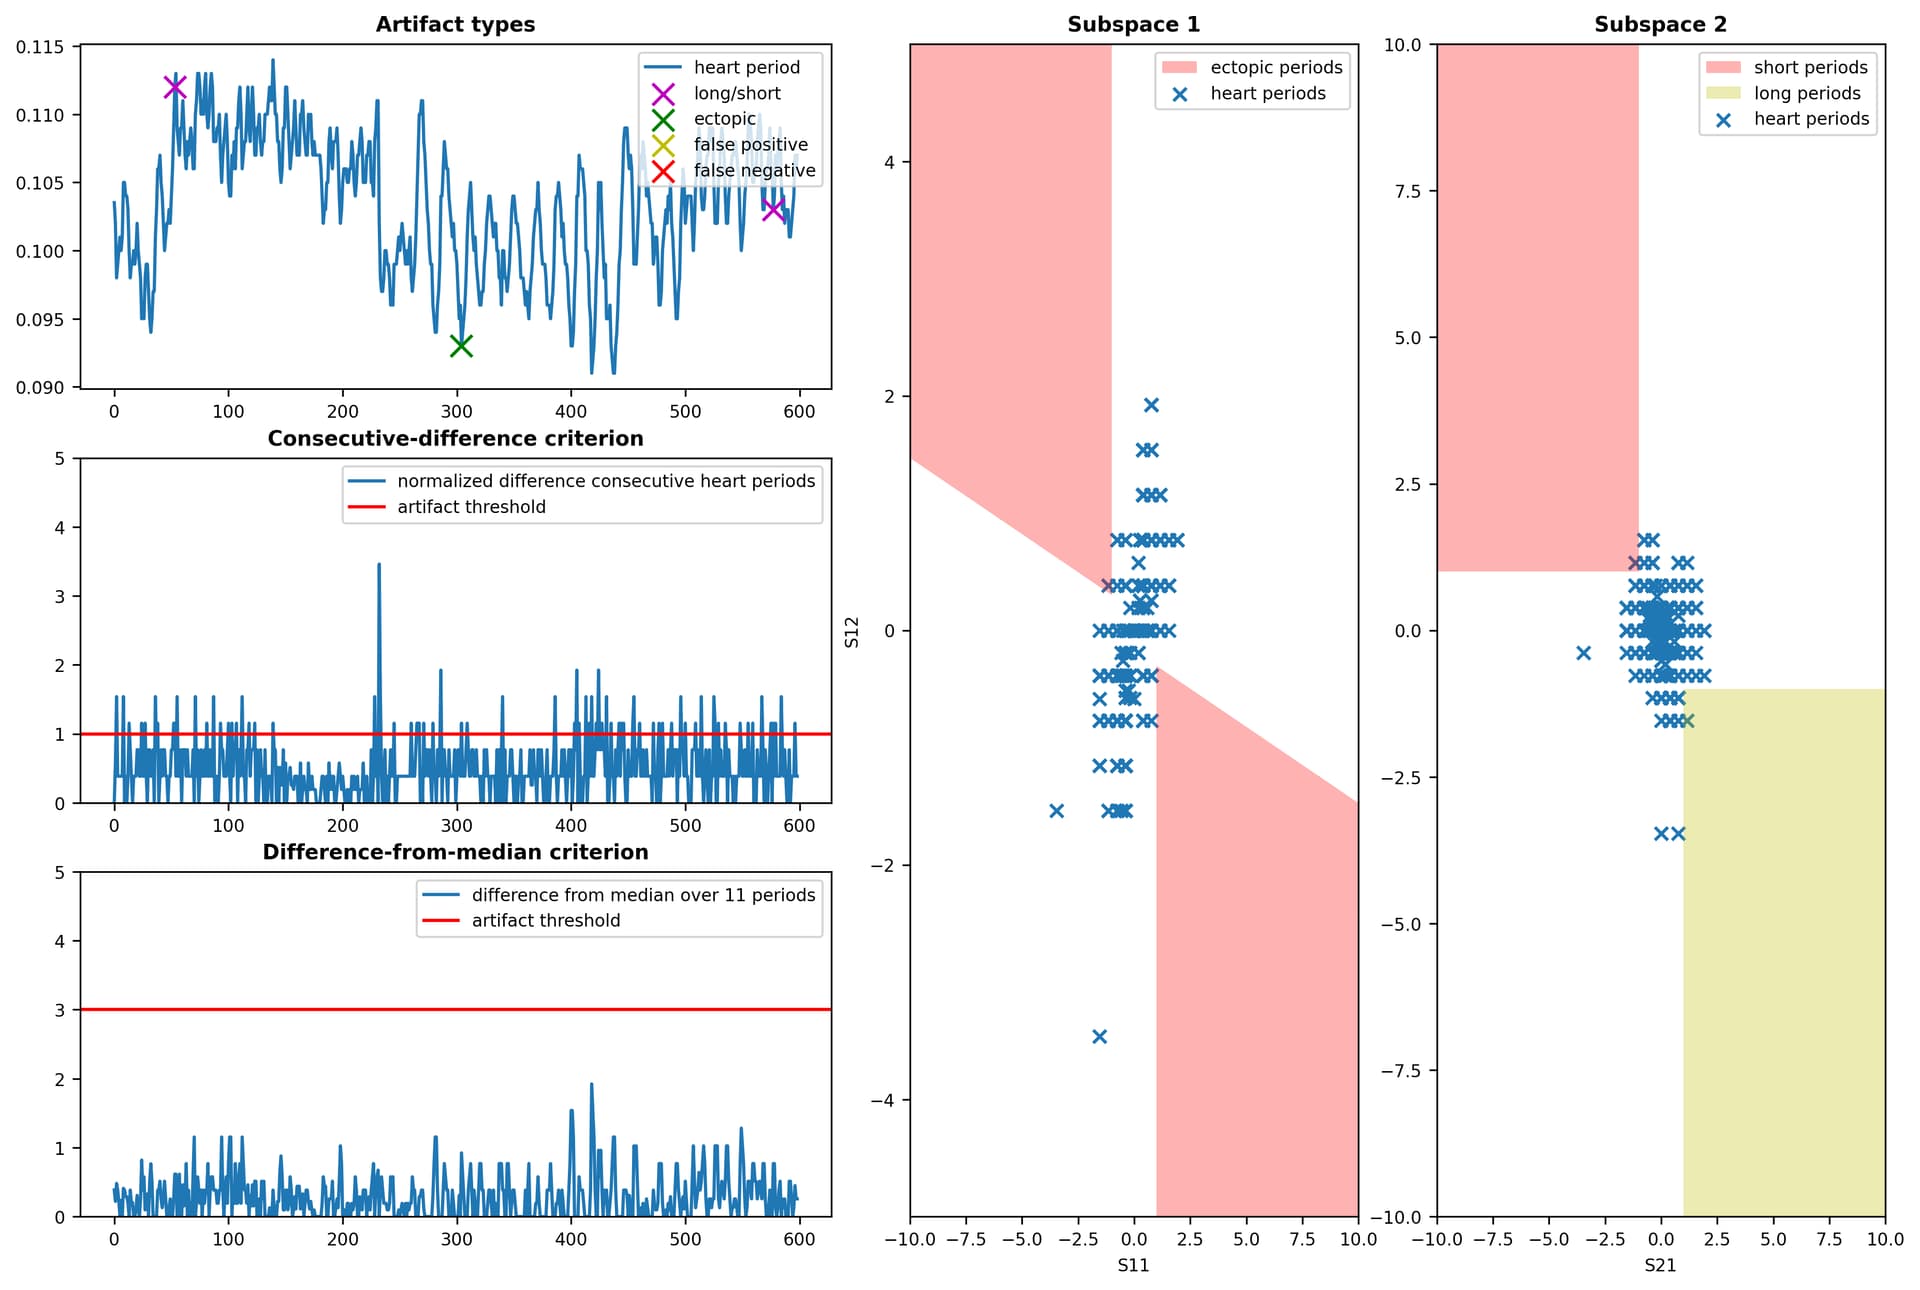
nk.signal_fixpeaks() reported following errors: {‘ectopic’: [304], ‘missed’: [], ‘extra’: [], ‘longshort’: [53, 577]}
The second chart is from RR csv file:
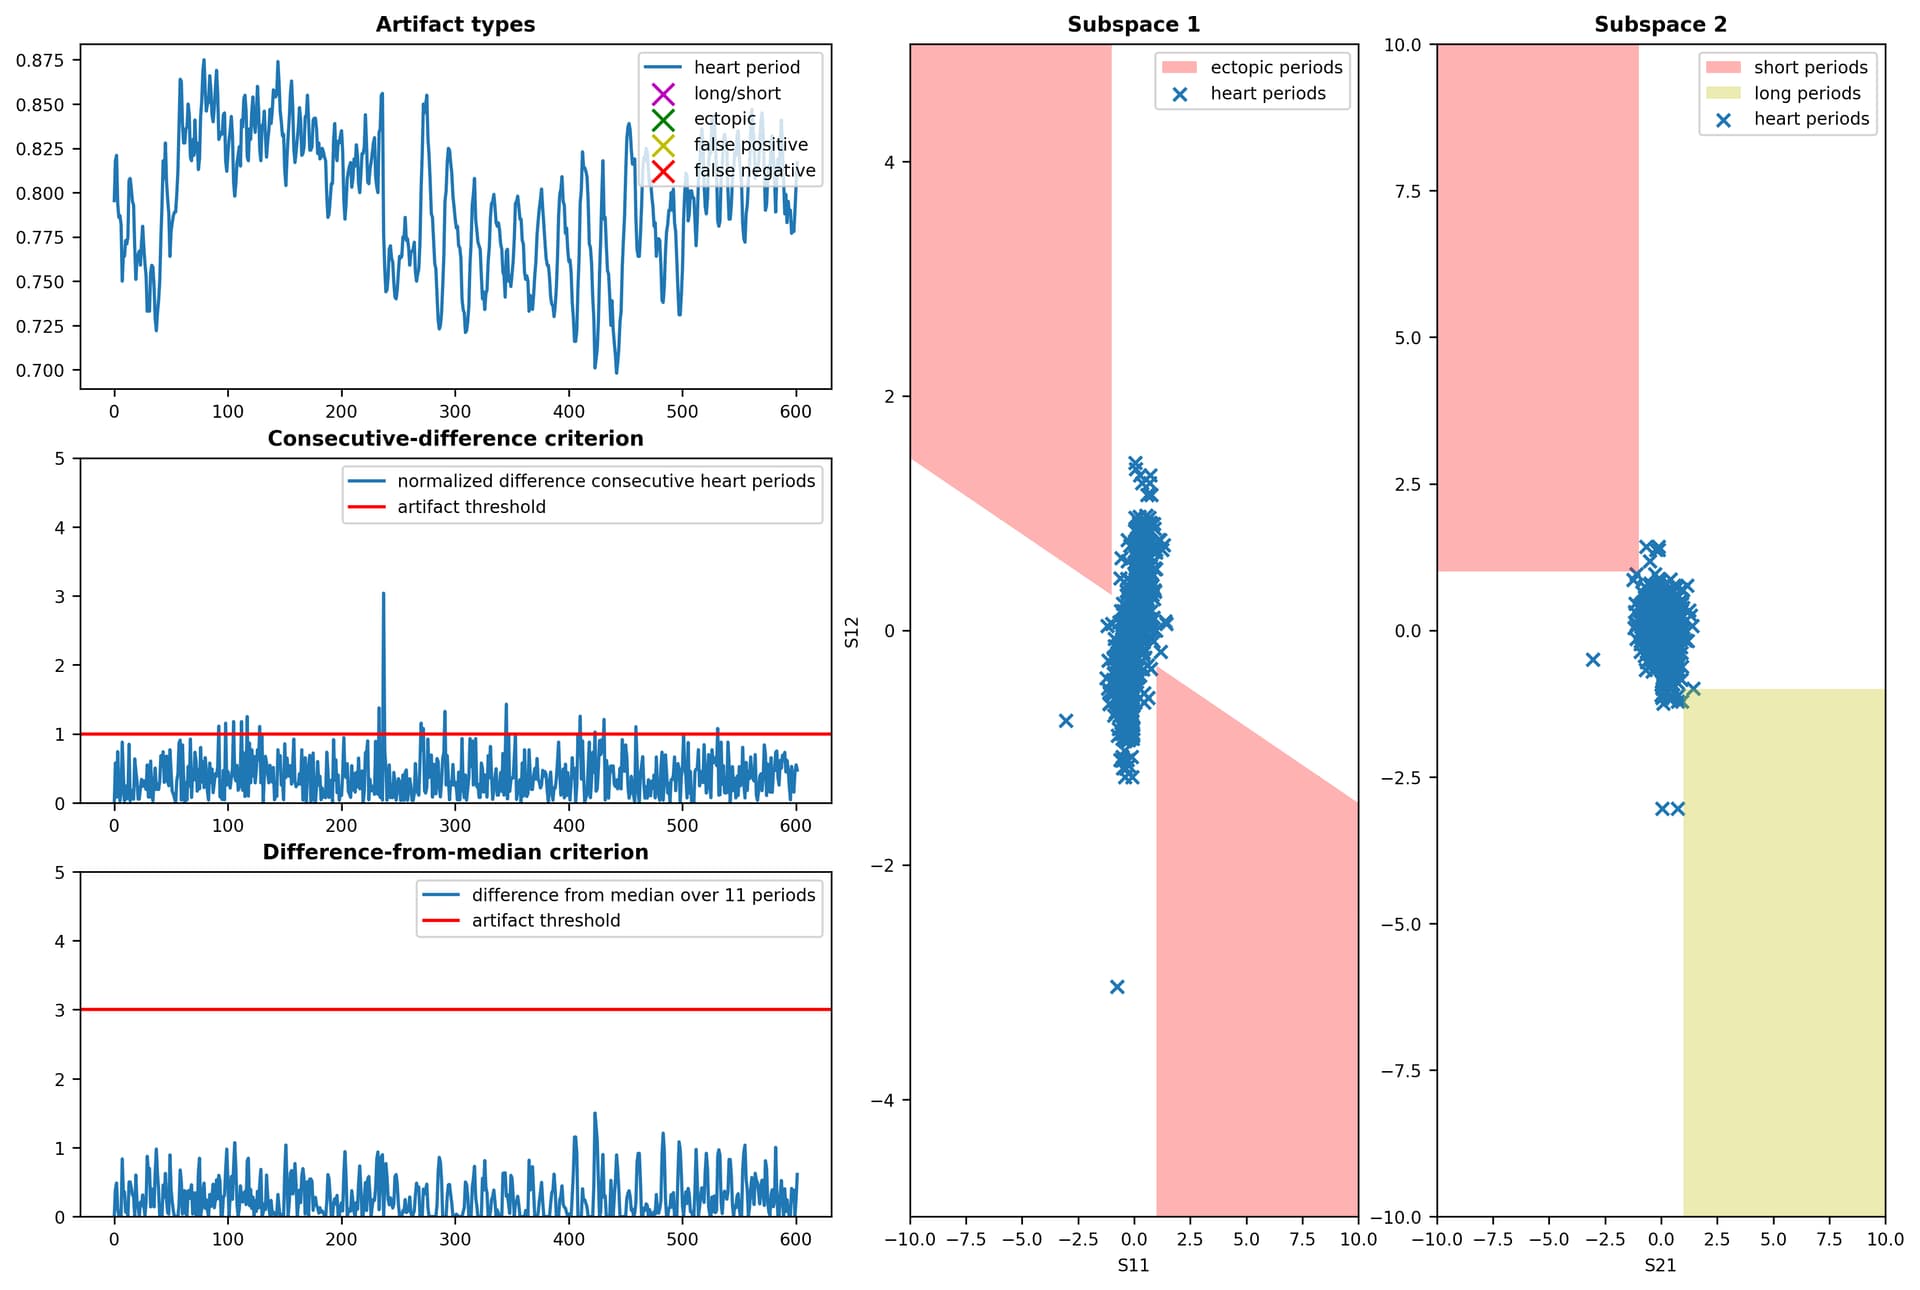
nk.signal_fixpeaks() reported no errors (I spotted 8 I would correct, but something special could be necessary, like modifying array size for ‘filling’ missing beats).
Comment next day: There is already patented method of reconstructing missing / distorted ECG and other physiological signals with CNN (convolutional neural networks). Link to patent is here: Systems and methods for imputing real-time physiological signals
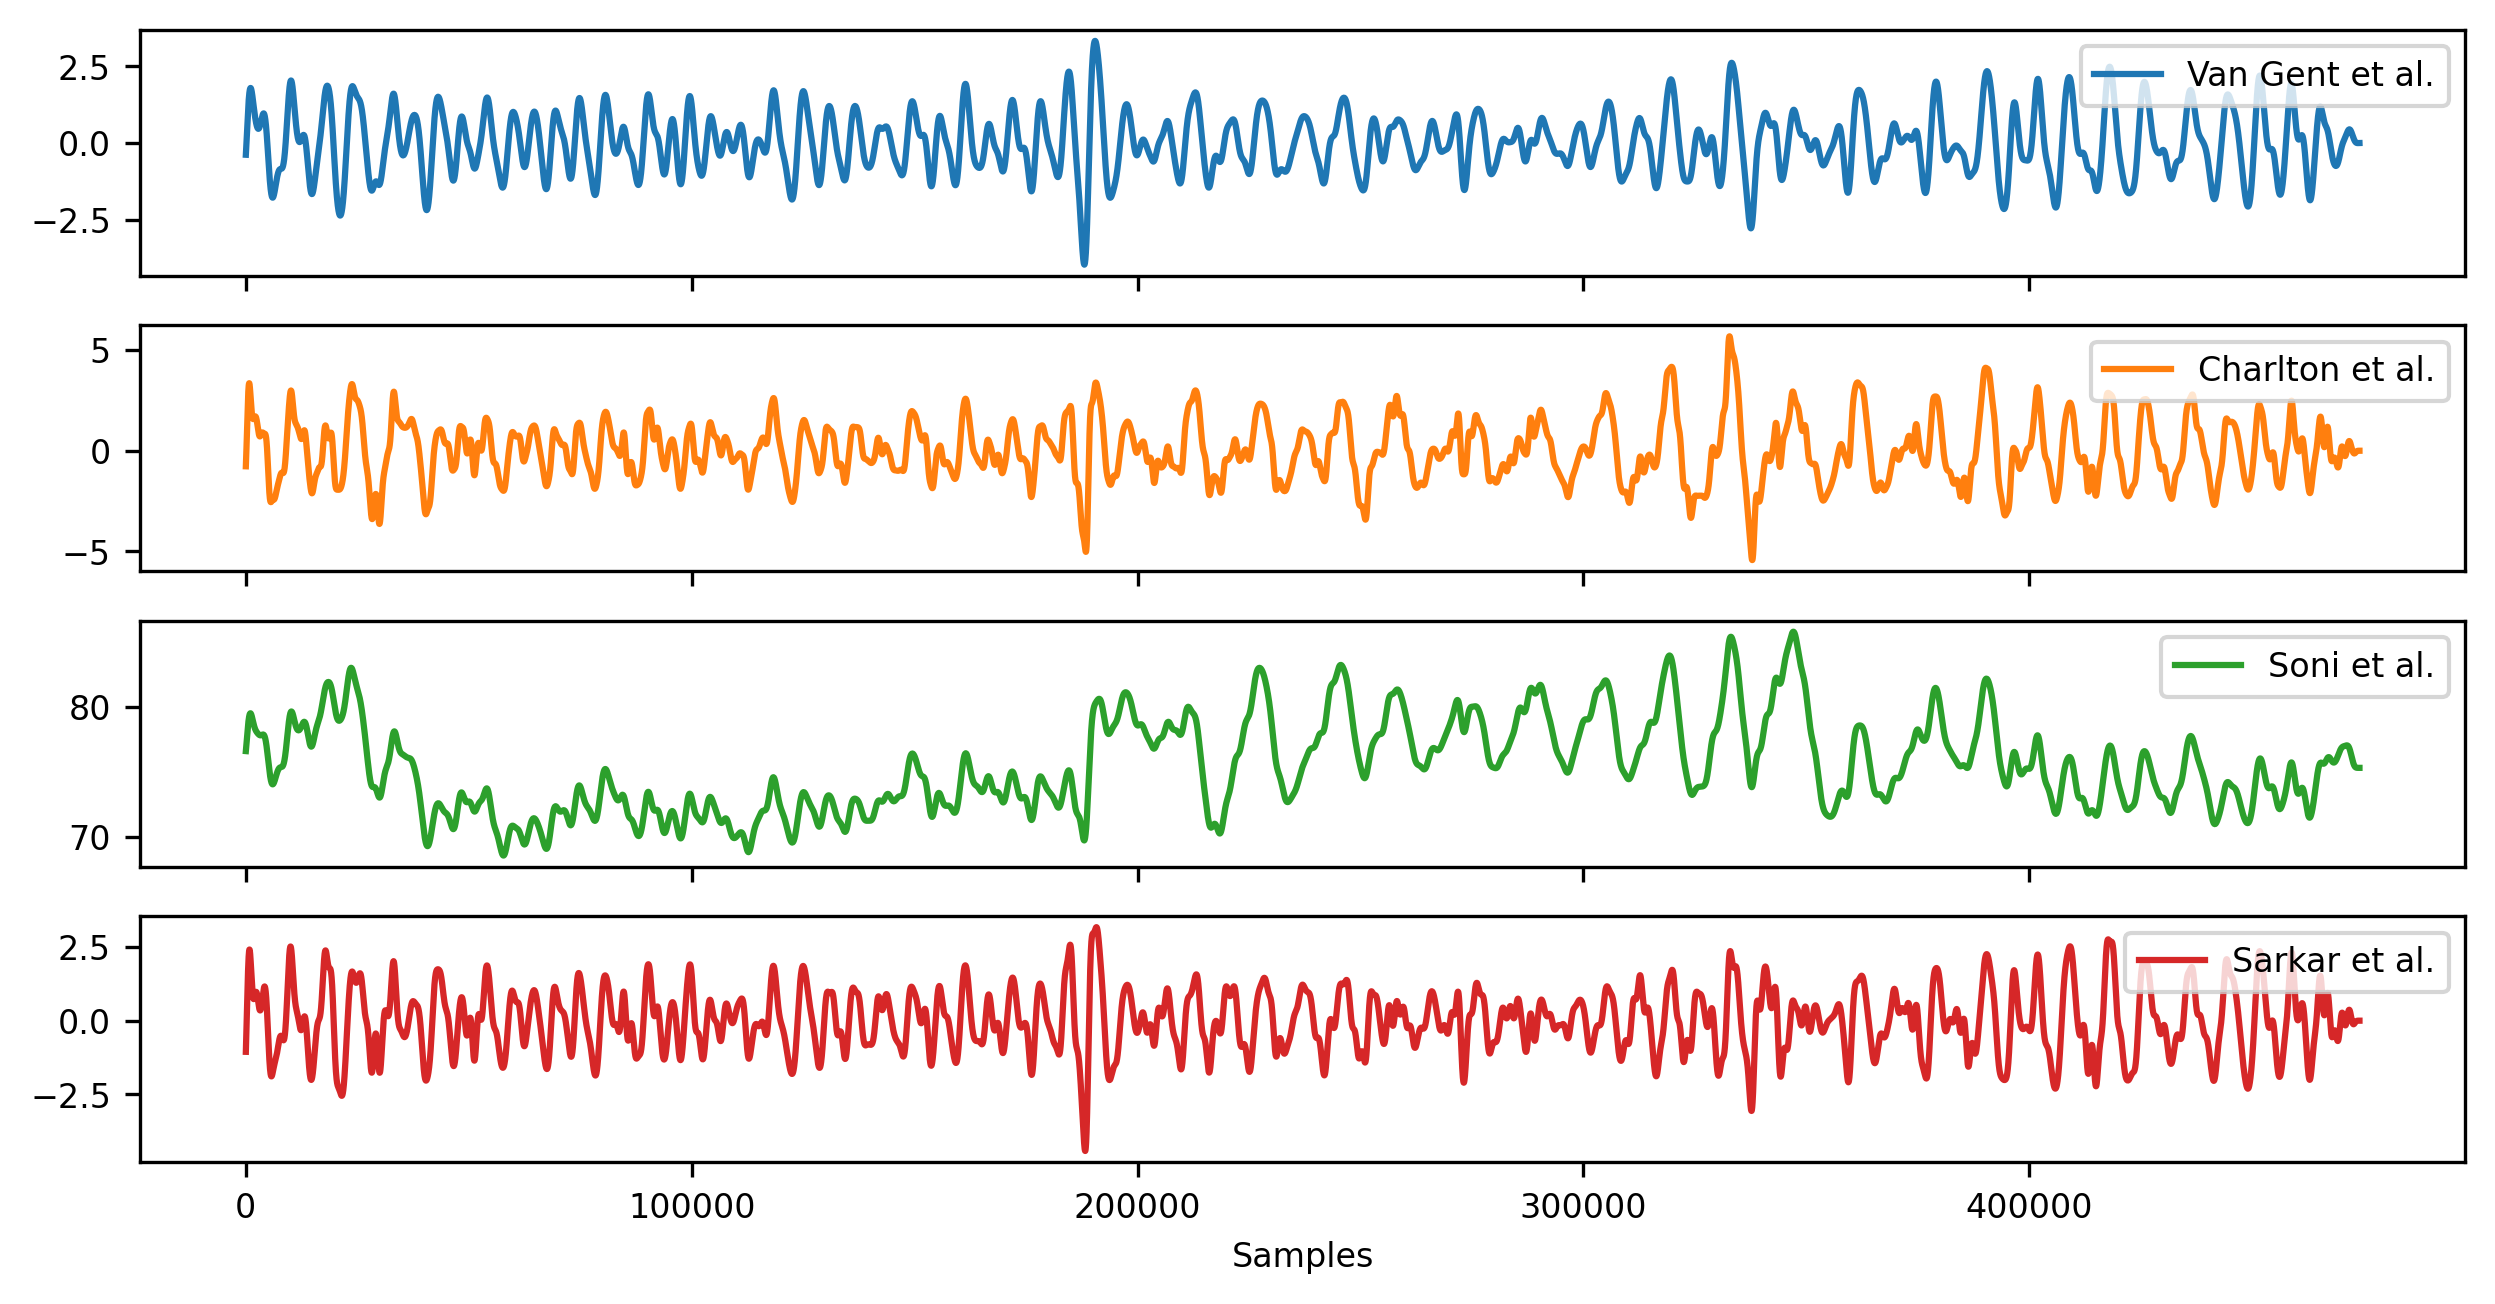
Conclusion: do not use ECG for HRV. Respiration rate from HRV can spotted with one of 4 methods I mentioned.
 Tell me when I’m doing the same!