More then 3% artifacts should be rejected. You are always below 1% and the chart is showing a consistent trend with very little outliers. Looks good to me.
How does the initial data collection work? Is it only for the first time setup, or each time starting an activity? Can I wear the HRM and let it reaching 100%?
I setup AlphaHRV for the first time today then went out for a 40mins run. When finishing the run, the progress is just at 40%.
Data collection starts when you load the activity profile just after pairing the HRM. It should take around 2 min.
If after 40 min data collection has only reached 40%, it means transmission from HRM has been stopped or connection has been lost before completing this process.
1 Like
Would you be kind enough to explain what makes you think that breathing is something completely different from sinus respiratory rate (RSA), please?
I experiment with NeuroKit2 and tested RSP rate retrieval from ECG data [’ ECG-Derived Respiration (EDR)’ : they offer 4 different methods and I checked them on my own data from Polar H10 device]. In my case, there is obvious correlation to ‘real’ respiration and effort makes it even stronger.
I mean that you can’t count breaths and verify at the same time that the value given by Garmin matches the breaths you’re counting, maybe I’m explaining myself badly.
Nice to see you here and taking part in the conversation. On your advice I took the plunge and am now taking my first steps in Python and Neurokit.
A couple of things regarding resp frequency that I’m intrigued about:
- Alpha HRV uses HRV (beat to beat time variation) to detect periods of inhalation/exhalation. Full ECG is not an option because the head units have not enough computing power.
- EDR possibly uses HRV combined with amplitude modulation of the R-peaks. May also be amplitude
modulation only depending on the algo. Kubios premium has a solution that seems to give reasonable results. NeuroKit has multiple algo’s that I would like to see comparisons on.
Regarding HRV, it seems clear that the results will be better with better signal quality. Overall, the method has quite some ‘uncertainty’.
When it comes to amplitude modulation, a cleaned signal will yield a much more stable signal. But, the resolution of the signal is inherently low. Low efforts will produce a better signal because there are more R-peaks per breath cycle. For me, 100bpm HR combined with 15brpm resp rate would result in 6-8 R-peaks per breath. It is enough to make the variation clearly visible but nothing more then that. On harder efforts, let’s say 160bpm and 50brpm, there will be only 3-4 R-peaks per breath. That is very little to define a sinus wave…
Some thoughts:
- I was thinking of using not only the resp rate derived from ECG R-peaks but also taking in account a factor that correlates to the amplitude delta of the R-peaks, because theoretically this factor would also correlate to the depth of breathing and thus combined with resp rate, give a better indication of ‘ventilation’.
- Given the fact that AlphaHRV already has the exact timing of the R-peaks, to calculate a1 and RR, would it be feasible to include R-peak amplitude? Since EDR uses R-peaks to derive resp rate, a full ECG trace is not really needed, just R-peak position and amplitude is enough.
- Several people already mentioned that the RR from AlphaHRV does not correspond to the number of breath counts. First thing to acknowledge is that RR in Alpha HRV has a lag because it is the average of the last 60 sec. Another thought is that the absolute value isn’t really important, as long as the RR number correlates to a resp rate signal behaving like the real RR.
Looking forward to any comments on this.
1 Like
IMHO there are too many difficulties in making progress as almost everyone has it’s own way to process the data and routines are not available. I get why even though I do not find fair that some take advantage of freely available research papers to improve on their software, e.g. Kubios.
Even at a more primitive level, there is much going under the carpet and it becomes more a data processing challenge than using the data to do something meaningful. For instance, I have both R-R and ECG data from my polar H10 and I cannot get back from ECG to the R-R intervals provided by the monitor (using ECGLogger).
That being said, the best thing would be to have some quantity that correlates with tidal volume: together with resp rate we could have a clearer picture of what’s going on. It would be great to find out that a1 is (strongly) inversely correlated with tidal volume: in this way the RR/a1 plot would be a a proxy of the oxygen uptake.
Getting the R-R intervals from a good quality ECG signal is not that difficult. First a HighPass filter for detrending the baseline, then a peak detection. I was able to get good results in Excell using the slope function and detecting a sign change after applying a filter like this:
https://excelunusual.com/basic-filters-2/
The more difficult part is artifact detection and rejection. NeuroKit seems to do that quite well.
That’s what I would like to try with amplitude delta. By no means will this be an indication of the absolute value, but together with resp rate, it might result in a variable that correlates with Tidal Volume.
The more people trying out different ideas, the more chance we have to one day find something usable. I kind of like this ‘science’ trials, although it’s very amateuristic…
I mentioned this previously as well. It takes an hour or more for mine to reach 100% since some time in January. But it does get there eventually. It had previously been fairly quick.
It’s possible I changed a setting, or the placement of the strap on me, but everything else about the strap works (HRM Pro+). And I’ve not been able to figure out how to get it there faster.
The only thing I can imagine is that you have a lot of artifacts/rejects. When it finally connects, what does the artifact chart on Garmin Connect tells you?
I have a Polar H10 and reaching 100% after 2-3min. There is a window of 200 beats by default, so if all beats are accepted 2-3min is what you should expect.
Any chance you can test with another strap? (same sensor but other strap)
I had artifact problems related to the strap. You could try moving the sensor a bit to the left or right but HRM pro has no ECG function so you can’t check ECG signal quality like you can with Polar H10.
I have already found the peaks, the point is that not even the first RR interval matches. It is clear to me that the H10 monitor is already processing the signal in some way and it is a wild goose chase to try to find out or even asking polar what are they doing.
In principle it is beneficial if many people try, but the point here is that no one is playing face cards up. This is how business is done, not research.
From Neurokit2 EDR discovery method, even if it is based on ECG data, it only relates to HR (ecg_rate). Quick preparation steps are for RR detection (RR means R peak to R peak, I would prefer to not abuse of "RR’ name as it was long enough used for it, not for ‘respiration rate’, please.
Once it is done, you use just:
edr = nk.ecg_rsp(ecg_rate, sampling_rate=1000)
[130 is necessary for Polar H10 ECG file handling]. Mind that from RR file you can get immediately ecg_rate (or BMP), however the array needs to be properly re-scaled.
An ECG file from Polar Logger app is ~ 125 times bigger then RR file, so there is no enthusiasm to deal with it: also only Kubios Professional allows that format.
As Polar delivers RR file strait on, one assumes that nothing more is necessary for further processing of data. And this is the big problem.
Three lines from ECG file, after 10 seconds of measure:
Phone timestamp;sensor timestamp [ns];timestamp [ms];ecg [uV]

2023-02-01T17:32:42.597;599616057611716560;10830.099;1903

2023-02-01T17:32:42.604;599616057619402845;10837.784;2155

2023-02-01T17:32:42.612;599616057627089130;10845.472;1801
One line from RR file, please try to spot the RR peak timestamp in ECG file:
Phone timestamp;RR-interval [ms]

2023-02-01T17:32:42.608;802
If internal H10 sampling rate is not 130 Hz, but 1000 Hz, we will always have a discrepancy between those files. For that reason it would be interesting to compare stats using Kubios Professional and the ECG and RR files from the same, easy session of few minuts.
I also see that in many places RR file is ‘maked up’ , but how? Some processing power is within Polar data logger (phone or tablet) and some corrections are already applied by that app.
Anyway, interesting enough. But ‘shit in, shit out’ and that is the current problem.
1 Like
So you agree with me that going from H10 ECG to the RR intervals the monitor is supplying is not straightforward due to some internal processing. I have not investigated so much, but at this point I don’t get how the H10 has sampling rate 130Hz for ECG and 1000Hz for RR as I am assuming that the RR intervals are derived right away from the ECG. Anyways, this is, at least to me, reassuring as I am not even using Python, so should not be software related.
If it is relevant, I contacted the developer of ECGLogger (IOS only) and confirmed that the app isn’t processing the data at all: just writes in a csv file what the H10 monitor provides. So the processing is within the H10 monitor.
I seem to have trouble connecting as well.
- remove previous HRM Pro Plus pairing with watch
- set up AlphaHRV app with closest BLE connection
- change from closest connection to last connection
- pair HRM Pro Plus through ANT+
- AlphaHRV app crashes (Garmin IQ Connect icon showing instead of chart)
What am I doing wrong?
I have to thank you for making me realize that the R-peaks can’t be extracted from the 130Hz ECG. The sampling rate limits accuracy to +/- 7.7ms. At a resting HR of 60 or lower that makes ~1.5% error margin and might be more or less acceptable. At high intensity efforts around 180bpm, that would be 5% error. Unacceptable for this kind of metric. And I failed to notice that untill your remark.
So there must be a more precise internal sampling rate to make up the R-R interval stream.
What we do know is that the Polar uses one channel (BLE or ANT+) to broadcast the 130Hz ECG and a second channel to broadcast the HR in some way/format. When used with Fatmaxxer, you can only get the ECG amplitude on screen if both BLE channels are free. If one BLE channel is already connected to your head unit for HR, Fatmaxxer uses the second BLE channel to collect R-R intervals but is unable to display ECG amplitude.
Another thing that I was able to find an explanation on is the sensor timestamp as noted by @Retsam:
That is the number of nanoseconds from the sensors internal date/time. That internal time is reset to a default value every time the sensor is deactivated and the default for a Polar H10 is 2019-01-01T00:00:00Z.
There is a command to set the Polar H10 date/time stamp but I don’t think many apps use that.
The source of this info is here:
Absolutely. That’s why i used R-R interbeat intervals to make sure that it got through correctly. Just like I don’t like the use of bpm for breathing rate, please use brpm to avoid confusion with HR signals!
Do you mean that all 4 algo’s are based on R-R intervals (HRV) only? I saw different techniques while researching. R-S wave differences, Amplitude modulation caused by ‘capacitance’ change when the chest expands/contracts, HRV…
Sampling Rate for R-R intervals is 1024 Hz. Found here:
Yes, here is the chunk you call for all of them, ‘ecg_rate’ is used, no doubt. NeuroKit2 is alive and possibly other method will pop up in the future:
edr_df = pd.DataFrame({

    "Van Gent et al.": nk.ecg_rsp(ecg_rate, sampling_rate=1000),

    "Charlton et al." : nk.ecg_rsp(ecg_rate, sampling_rate=1000, method="charlton2016"),

    "Soni et al.": nk.ecg_rsp(ecg_rate, sampling_rate=1000, method="soni2019"),

    "Sarkar et al.": nk.ecg_rsp(ecg_rate, sampling_rate=1000, method="sarkar2015")
    })
Next day edit: There is another function in the NeuroKit2, HRV: hrv_rsa(). That one uses ECG (RR cannot be used) and proposes two method. Details are here: https://neuropsychology.github.io/NeuroKit/functions/hrv.html
Thank you for GitHub links to Polar business: I will visit it soon to better understand BLE broadcast.
for me it’s only working the other way round: you need to connect BLE to the watch and Ant+ with AlphaHRV.
1 Like
Let’s try to highlight some points with the help of solid data/evidence.
The data/analysis I am going to show are portions of a 120’ steady state zone 2 session. Data has been gathered with the following setting
- Polar H10 monitor + polar pro strap
- Connection via ant+ to alphaHRV
- BLE connection to head unit
- BLE connection to the phone running ECGLogger
I recall that the H10 can connect via BLE to two devices and that ECGLogger just pulls R-R and ECG from the H10 monitor and writes the output to a csv file.
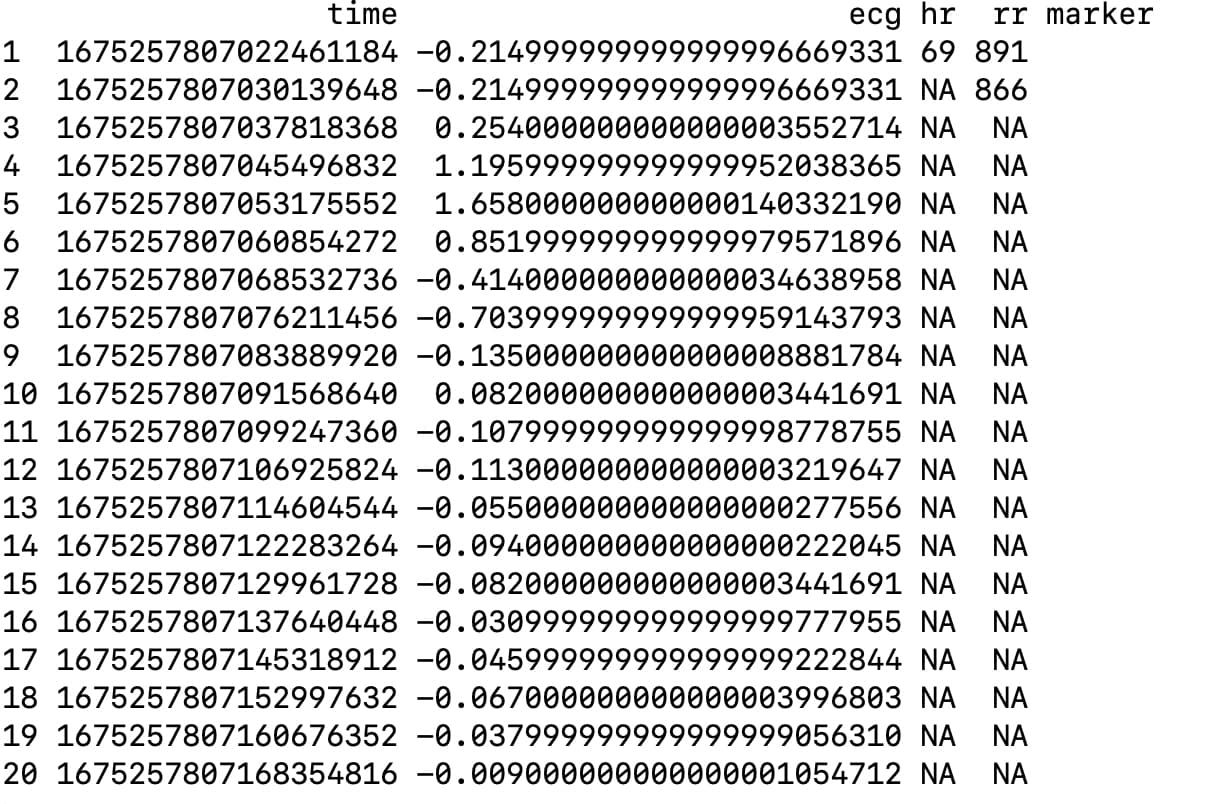
In the first figure I show the first 20 lines of the file, worth of ~1.4 seconds of recording. In the first column is UNIX timestamp in nanoseconds, in the second the ECG in millivolts, in the third heart rate, in the fourth the R-R intervals in milliseconds and in the fifth an additional user added marker while recording. Some considerations
- at least with ECGLogger, it seems that with one BLE channel you get the ECG and the R-R intervals
- I cannot find any correspondence between the rows containing non blank R-R intervals entries and ECG; most probably due to differences in sampling frequency, but still puzzled to see two R-R entries in the first two rows.
The annoying bit of the story is when we come to the comparison of the R-R series provided by the H10 and the one computed from the ECG, after some artifact correction and some additional black magic. In the second figure I am showing the comparison of a small portion of R-R intervals: the red line is for the R-R series provided by the H10 while the black for the one derived from ECG. Bottom line: the R-R intervals computed from ECG exhibit way more variability and are basically useless to do something meaningful; for instance, alpha1 tends to by smaller when computed from that series due to the unrealistic high variability induced by a low frequency sampling of ECG. One can consider a smoothed version of the R-R series obtained from ECG, but this entails adding an additional, and perhaps unnecessary, layer of subjectivity/complexity in the data analysis process.
To wrap up
- It seems to me that even different app that gather ECG data provide different output
- I have no idea on how the H10 monitor is processing the ECG prior to provide an R-R interval; all I know is that sampling frequency for R-R intervals is 1000Hz
- Even if we can think outside from the 0.75/0.5 alpha1 paradigm, as it seems the direction alphaHRV is heading, we need to be 100% aware about the data specs and what we are putting together. Honestly, if my analysis is not completely wrong, I would be more comfortable in computing the R-R series from the ECG as well as EDR and then combine them together.

My setup is similar but there are some details that may be important.
- Polar H10 monitor + Garmin Dual strap (should not make a difference, I switched the strap because the original Polar one was broken)
- ANT+ connection to AlphaHRV
- BLE to head unit for HR and with HRV activated. This means that RR intervals are stored by the head unit in the FIT.
- BLE to phone with Fatmaxxer or to desktop with Fitness ECG app
When using the Fitness ECG app, this is fully functional. ECG over 1 BLE channel to the app. The Fitness dashboard connects with ANT+ to get HR and RR intervals.
The second BLE channel sends HR and RR to my Garmin.
When using Fatmaxxer, I’m unable to get ecg amplitude indication and 10sec ecg-strips around detected artifacts. Unless I deactivate the HRV function in my Garmin. That’s because Fatmaxxer needs both BLE channels to get HR and RR in one, and ecg in the second.
When you are using ECG logger, is the HRV option in the head unit activated?
The first 2 data rows do indeed look puzzling. There are 2 RR markers for a timeline difference around 7.7ms (130Hz sampling rate on ECG) and the ecg amplitude. For me these are all results extracted from the 130Hz ECG stream! The nanosec timestamps confirm that.
There should be a second RR-stream with a 1024hz sampling rate, only collecting R-peaks and with a much higher precision. Those are needed for a correct HRV and a1 calculation because the 130Hz stream is not precise enough.
I think that internally the ECG is recorded at 1024Hz sampling rate and RR’s are identified. Then, to reduce data amount, a downsampling is done to send out an ECG stream that can fit in the BLE data bandwidth. The RR’s are then send as individual delta’s referring to the former one.
EDIT: here is some discussion that seems to support my idea
At this moment I think ECG logger totally ignores the RR stream and calculates the RR from the low resolution ECG stream. Hence the difference with the results from the RR stream recorded on the head unit.