That was one of my points. The other one is that the misleading info is still there. Considering that the average time people spend in gathering info is limited, it is crucial to make crystal clear how things work. That has been done here several times. Repetita iuvant
Hello @Luisma_Gallego_Soy_P
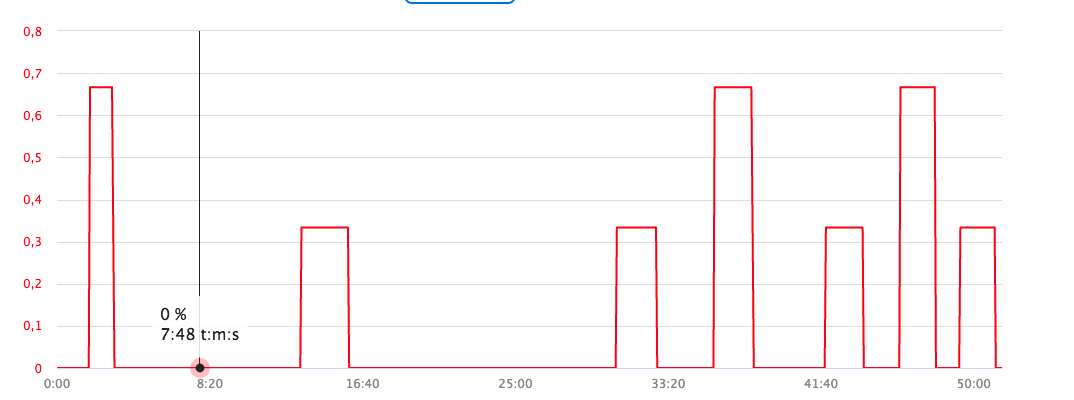
I have made the Ramp Test with Lactate but measured by me, so I had to pause every 6 minutes for less than 1 minute and take the lactate samples as we talked before…
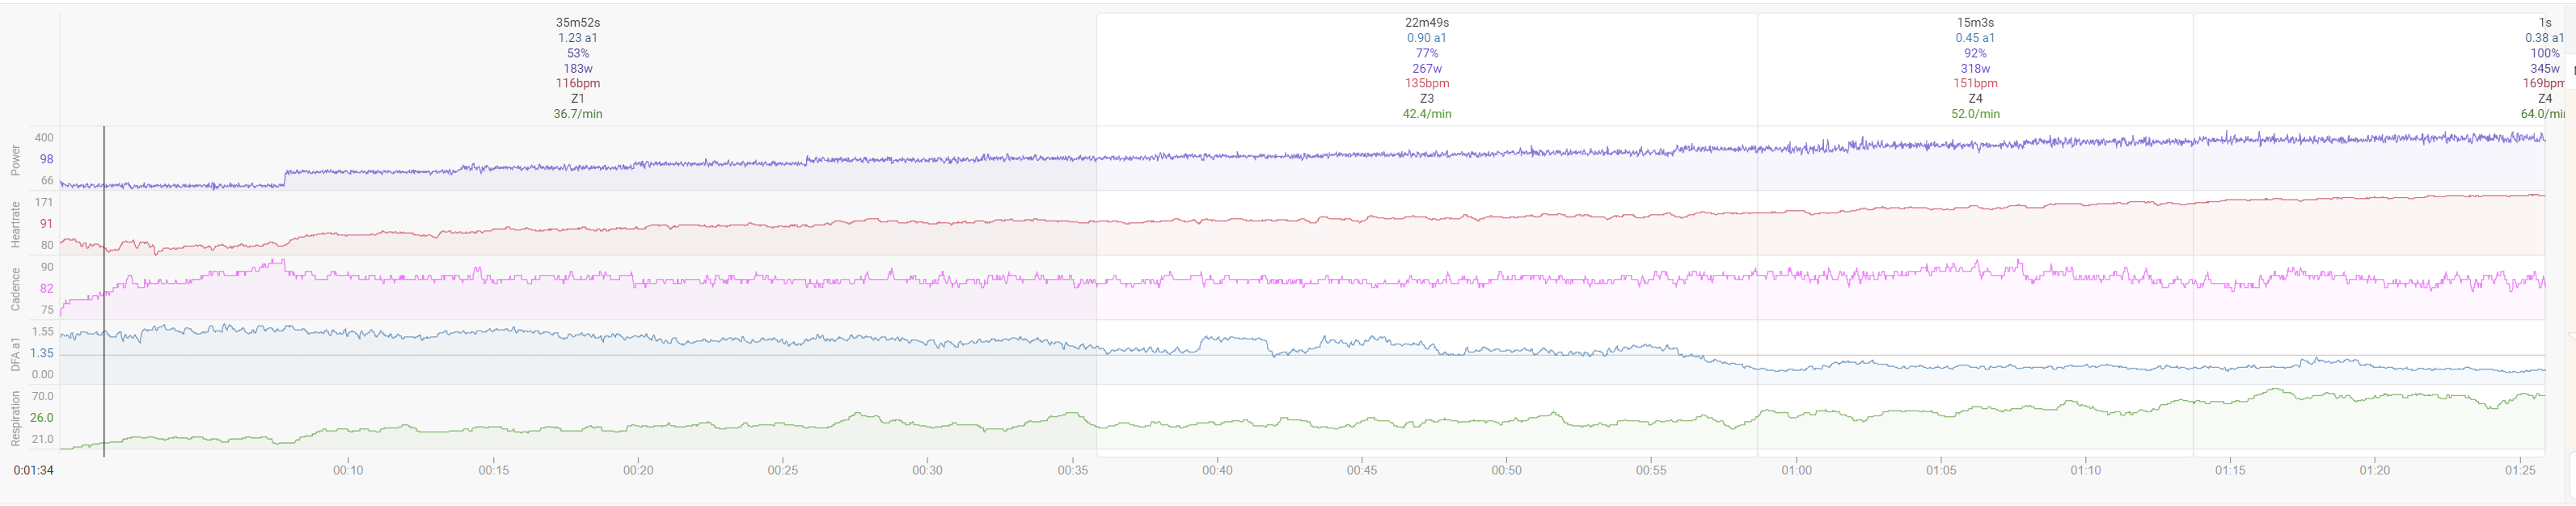
You were right, it is clear how does RR and a1 change when I pause for take blood sample:
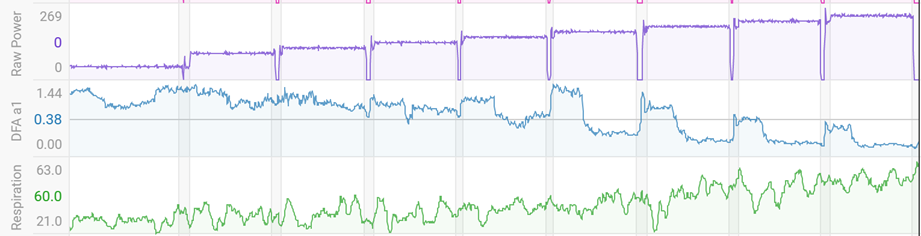
But at the same time, I think the alpha and RR “comes back” to similar previous values like 1 min after begin the new step again… So maybe is useful if we graph the test using just the last part of every step, e.g last 2 minutes?.
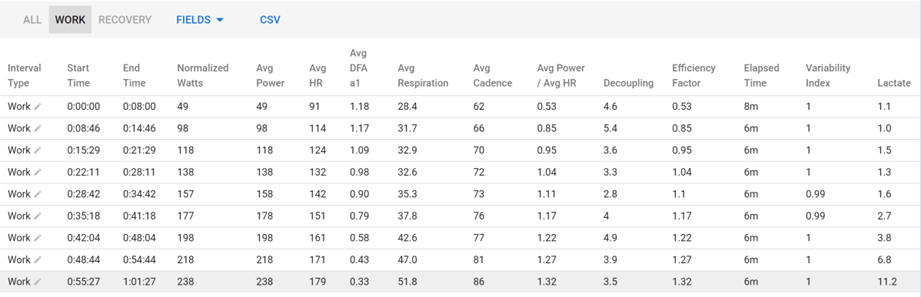
This is the table with all data including Lactate:
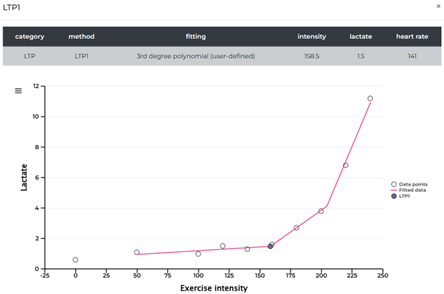
As for Lactate Readings, visually I consider my Thresholds should be between:
LT1: 160w-170w | 142bpm-152bpm

LT2: 200w-210w | 162bpm-172bpm
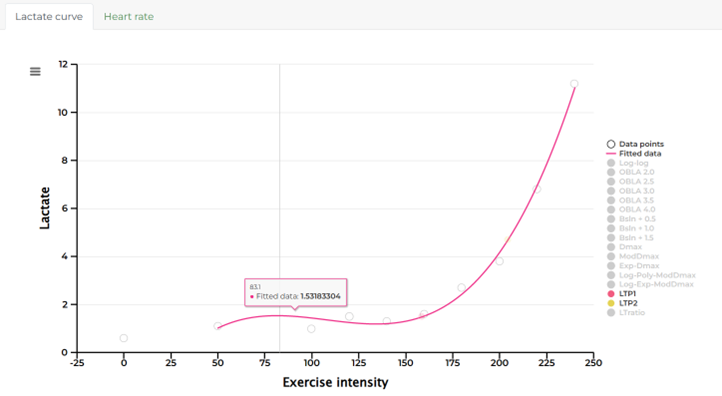
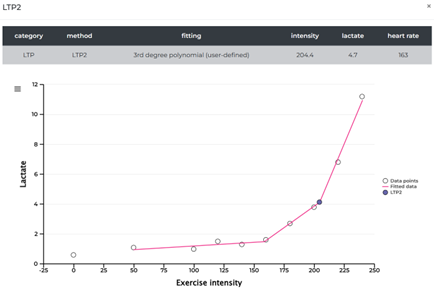
With 3rd degree polynomial (rounded up):
LT1: 159w/141bpm

LT2: 205w/163bpm
It is clear than my Aerobic Training during this Base moves “to the right” my LT1 closer to LT2. Nice!
Now the important… How does RR/a1 correlates?
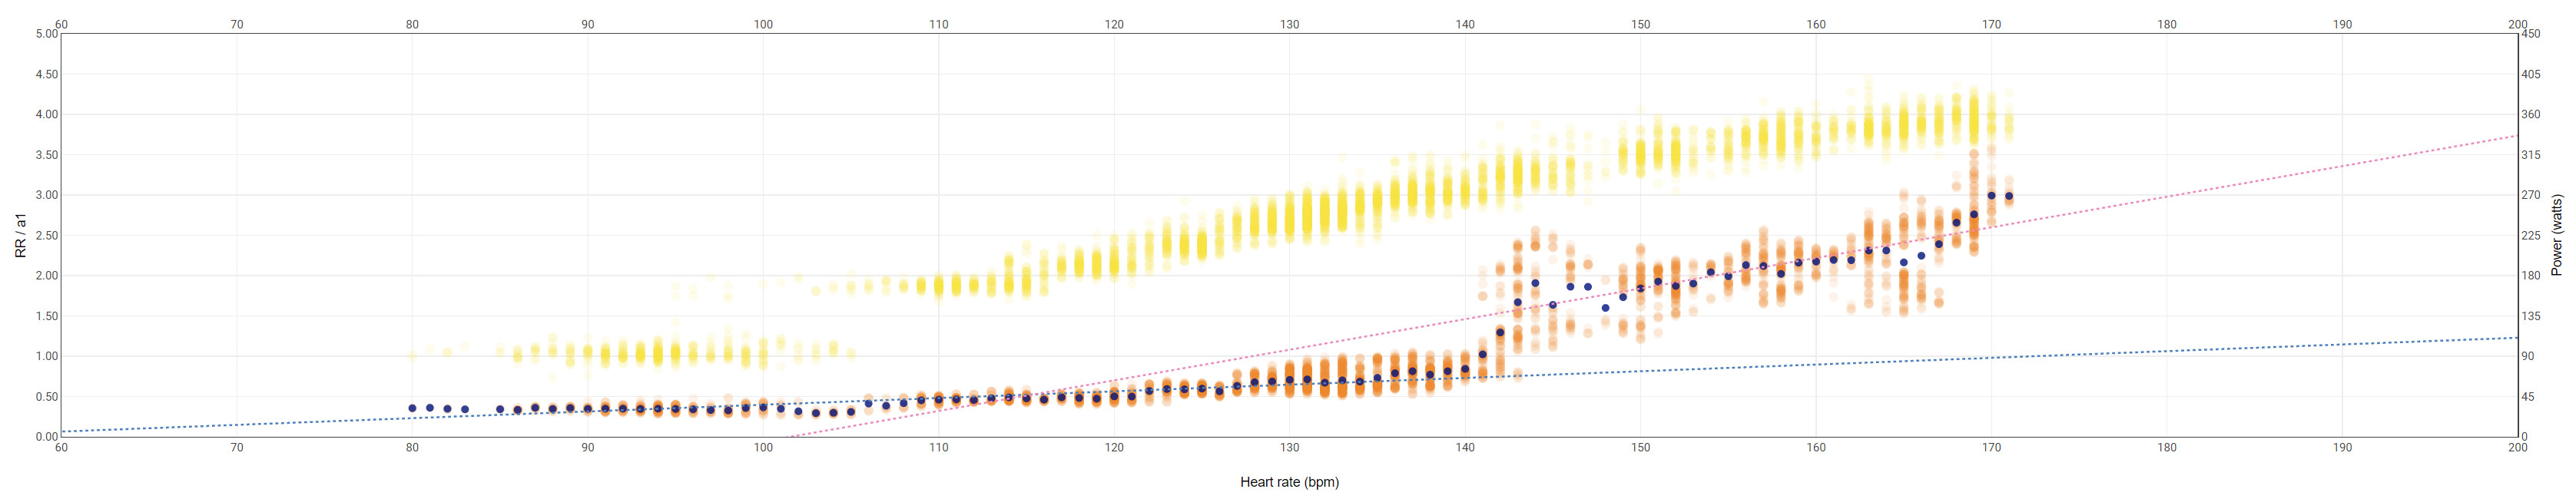
If I take the last 2 minutes of every step (removing the pauses) and make the graph with trend lines in excel, give me the following chart:
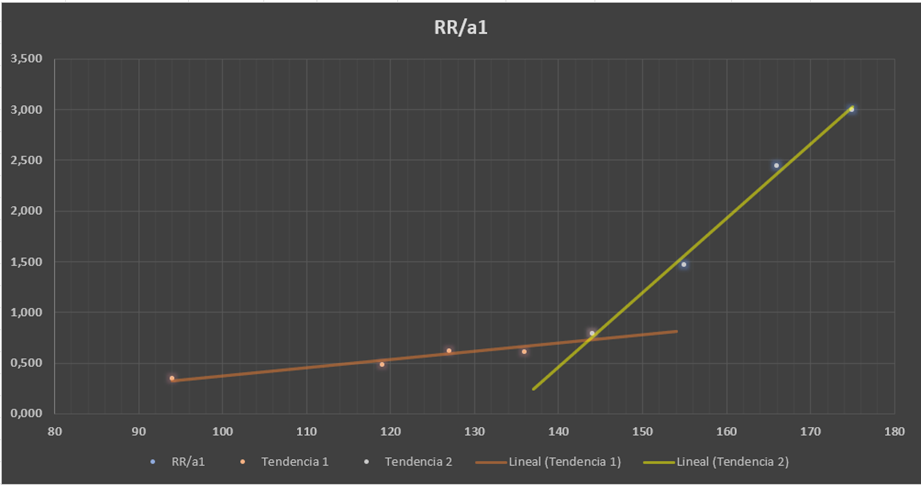
First Threshold: 143 bpm (aprox) --- only 2 bpm of difference compared with LT1,
Awesome!!!
Congratulations @Inigo_Tolosa and @Luisma_Gallego_Soy_P , at least for me RR/a1 correlates very well guys!!!
Note: If I did some bad calculations, please let me know! Thank you!
2 Likes
Nice to see these interesting results correlating lactate and RRa1. Do not hesitate to share any future test or concerns.
Regarding the a1 evolution when you stop for lactate test, it is a clear behavior related to artifact present in the RRints measured by your HRM. It is easy to detect this issue because both initial increase and come back to previous values happen suddenly in a step up-step down way. I am quite sure it happens due to movement or activity related to lactate test.
If you check how a1 behaves when you simply stop riding, you will see that a1 raises que notre softly.
If you cannot avoid this as you are alone for riding and taking samples for lactate, using RRa1 values from last part of each interval as you are doing is a good practice.
More over, now that you have lactate results, you could reply the test focusing only on RRa1. So, no need for stopping at the end of each interval. Ìt wild be good to see how lactate curve and raw RRa1 from the second test fit
1 Like
Hello Tito, thank you for sharing your tests. I also see the similarity between the lactate test and rr/a1, and it seems like the calculations are correct. I think it’s very accurate to use the last 2 minutes of rr/a1. Congratulations, and we’re glad it matched. If you give me your permission, I would like to post the results on Twitter for our haters, hahaha.
1 Like
Thank you @Luisma_Gallego_Soy_P !
Sure, post it please! At least people should try it and test it knowing their scope, limitations and how to interpret the results… If this can help, would be nice! You guys are doing a very good job trying to explain to us how to use it the right way.
For me, it is becoming a very important tool for my training, specially at base cycle.
Sure @Inigo_Tolosa , it makes total sense!
I’ll let you know future tests as my season progress and my fitness change…
Thank you!
Thank you Tito. That’s exactly as you say, every system, every model has its limitations, the most important thing is to know those limitations in order to act correctly. TSS have limitations, critical power has limitations, the FTP of WKO has limitations, if we know them we will be able to work better.
1 Like
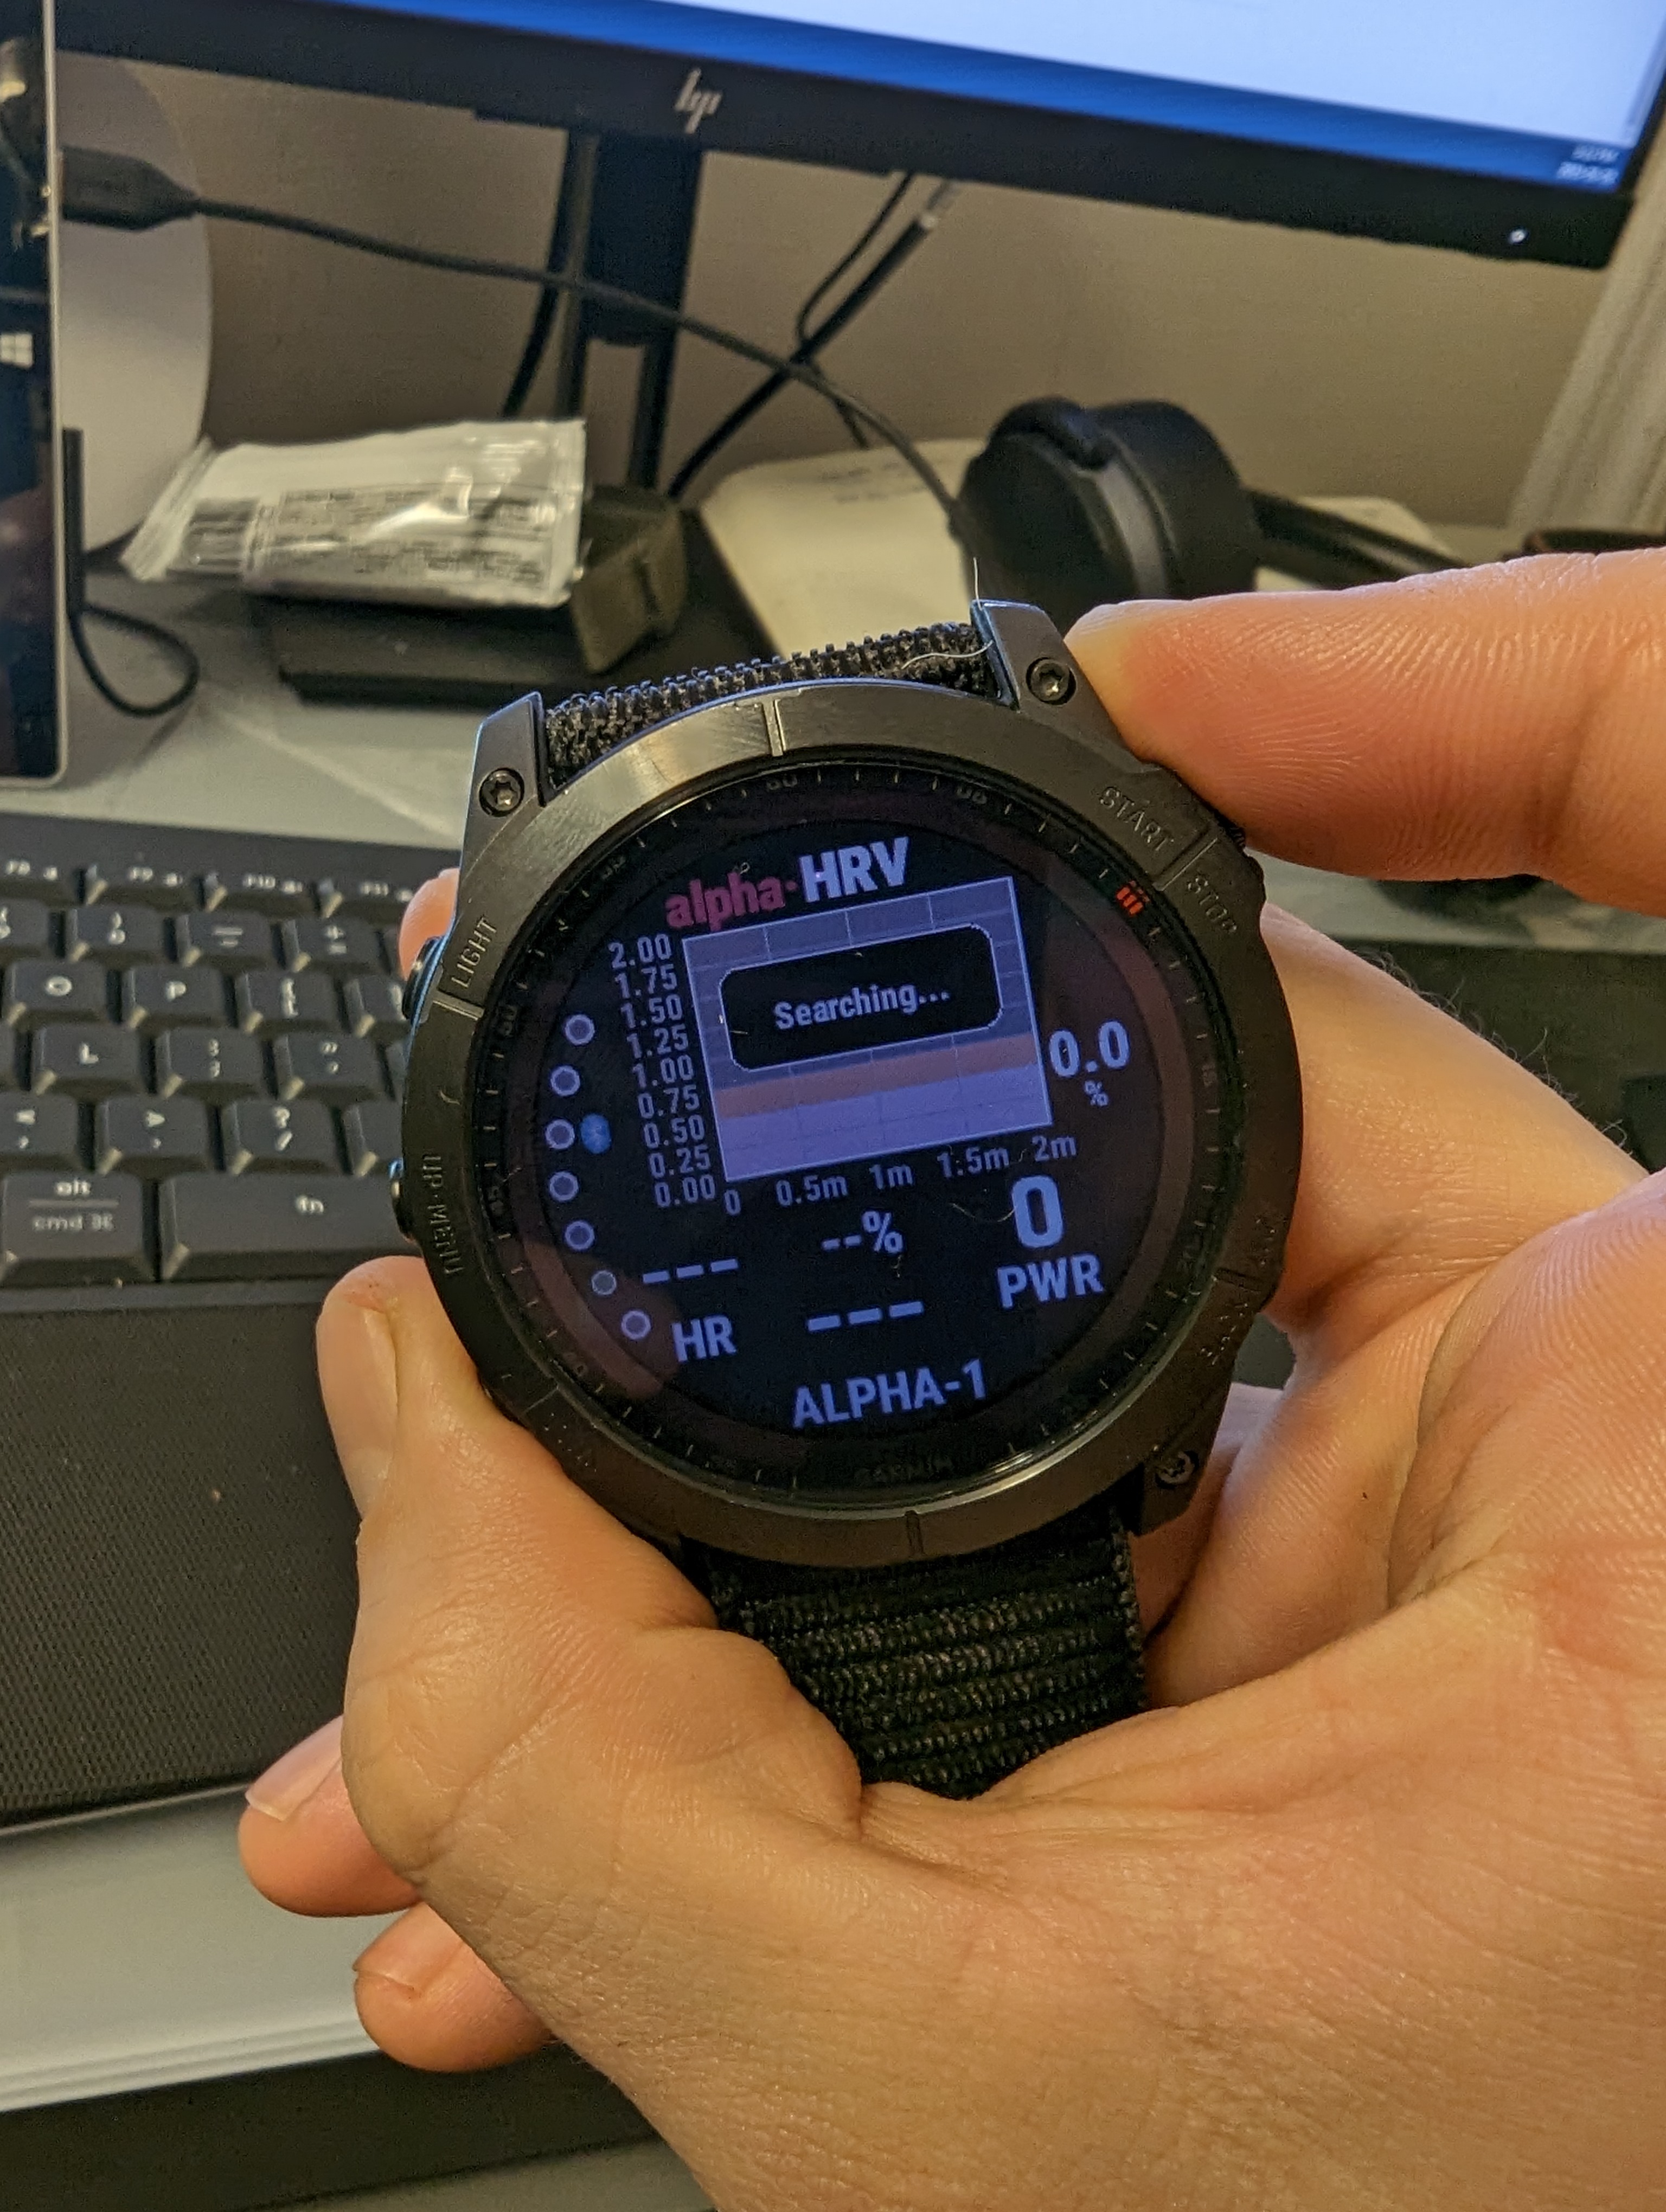
Can anyone help with the initial set up of the alphaHRV app on a Garmin Fenix 7x? I have the app installed, and going into the alphaHRV settings within the Connect IQ app on my phone, I set to use BLE communication and set to use the Closest. However, I don’t see a way to actually search and connect to the BLE heart rate monitor. I see BLE Configuration which says “Enter config for BLE communication” but it’s not an editable or actionable field.
Any help is appreciated.
alphaHRV will search and pair by itself.
Sentence you are referring to is the title of that section in the app settings, so no editable.
Be sure you have not paired the HRM with your f7x in BLE mode and that the HRM is not paired with any other device at the same time.
By the way, if your HRM supports ant+, I strongly recommend you use this protocol for alphaHRV. It’s easier and most reliable
Tried doing BLE again with all my other devices Bluetooth turned off and stuck on searching.
Ideally I don’t want to use ANT+ as I like getting running dynamics on my runs and would be a pain to have to swap back and forth between BLE and ant+.
I’ll try ant+ later though to see if I can get a connection that way.
2 Likes
Same issue with my fenix 6 and garmin HRM Pro+ in BLE
And recently, in ANT+ it takes an hour or longer to count up to 100% on the graph and actually start recording anything. Worked fine on Jan 12, but not since (jan 14 was first where it took long). I don’t know if there was an update around then, or if I’ve changed something.
1 Like
Long time lurker, first time poster.
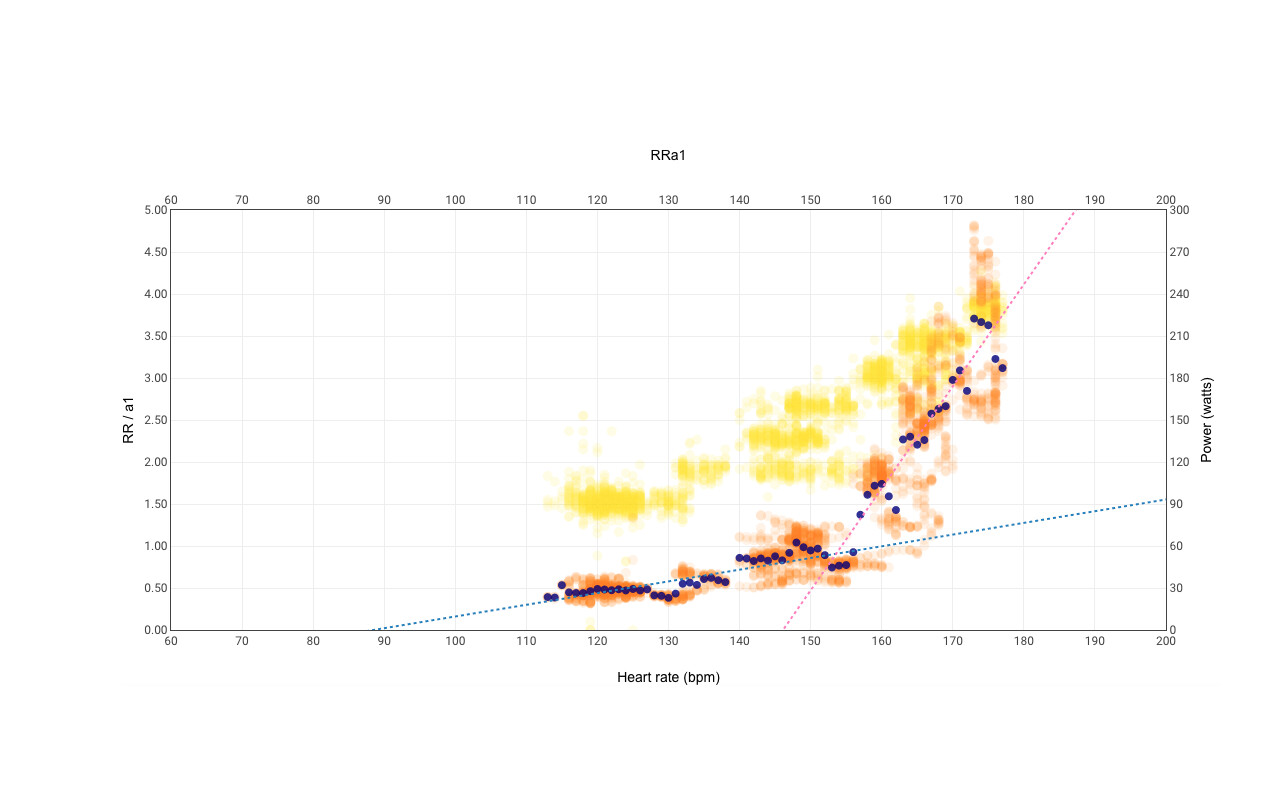
I did the test and my results and chart look a bit weird.
Protocol:
100w 8mins
170w 6min
192w 6min
215w 6min
235w 6min
245w 6min
255w 6min
265w 6min
275w 6min
295w 6min
315w 6min
335w 6min
345w 6min (LT2 must be around here)
355w 6min
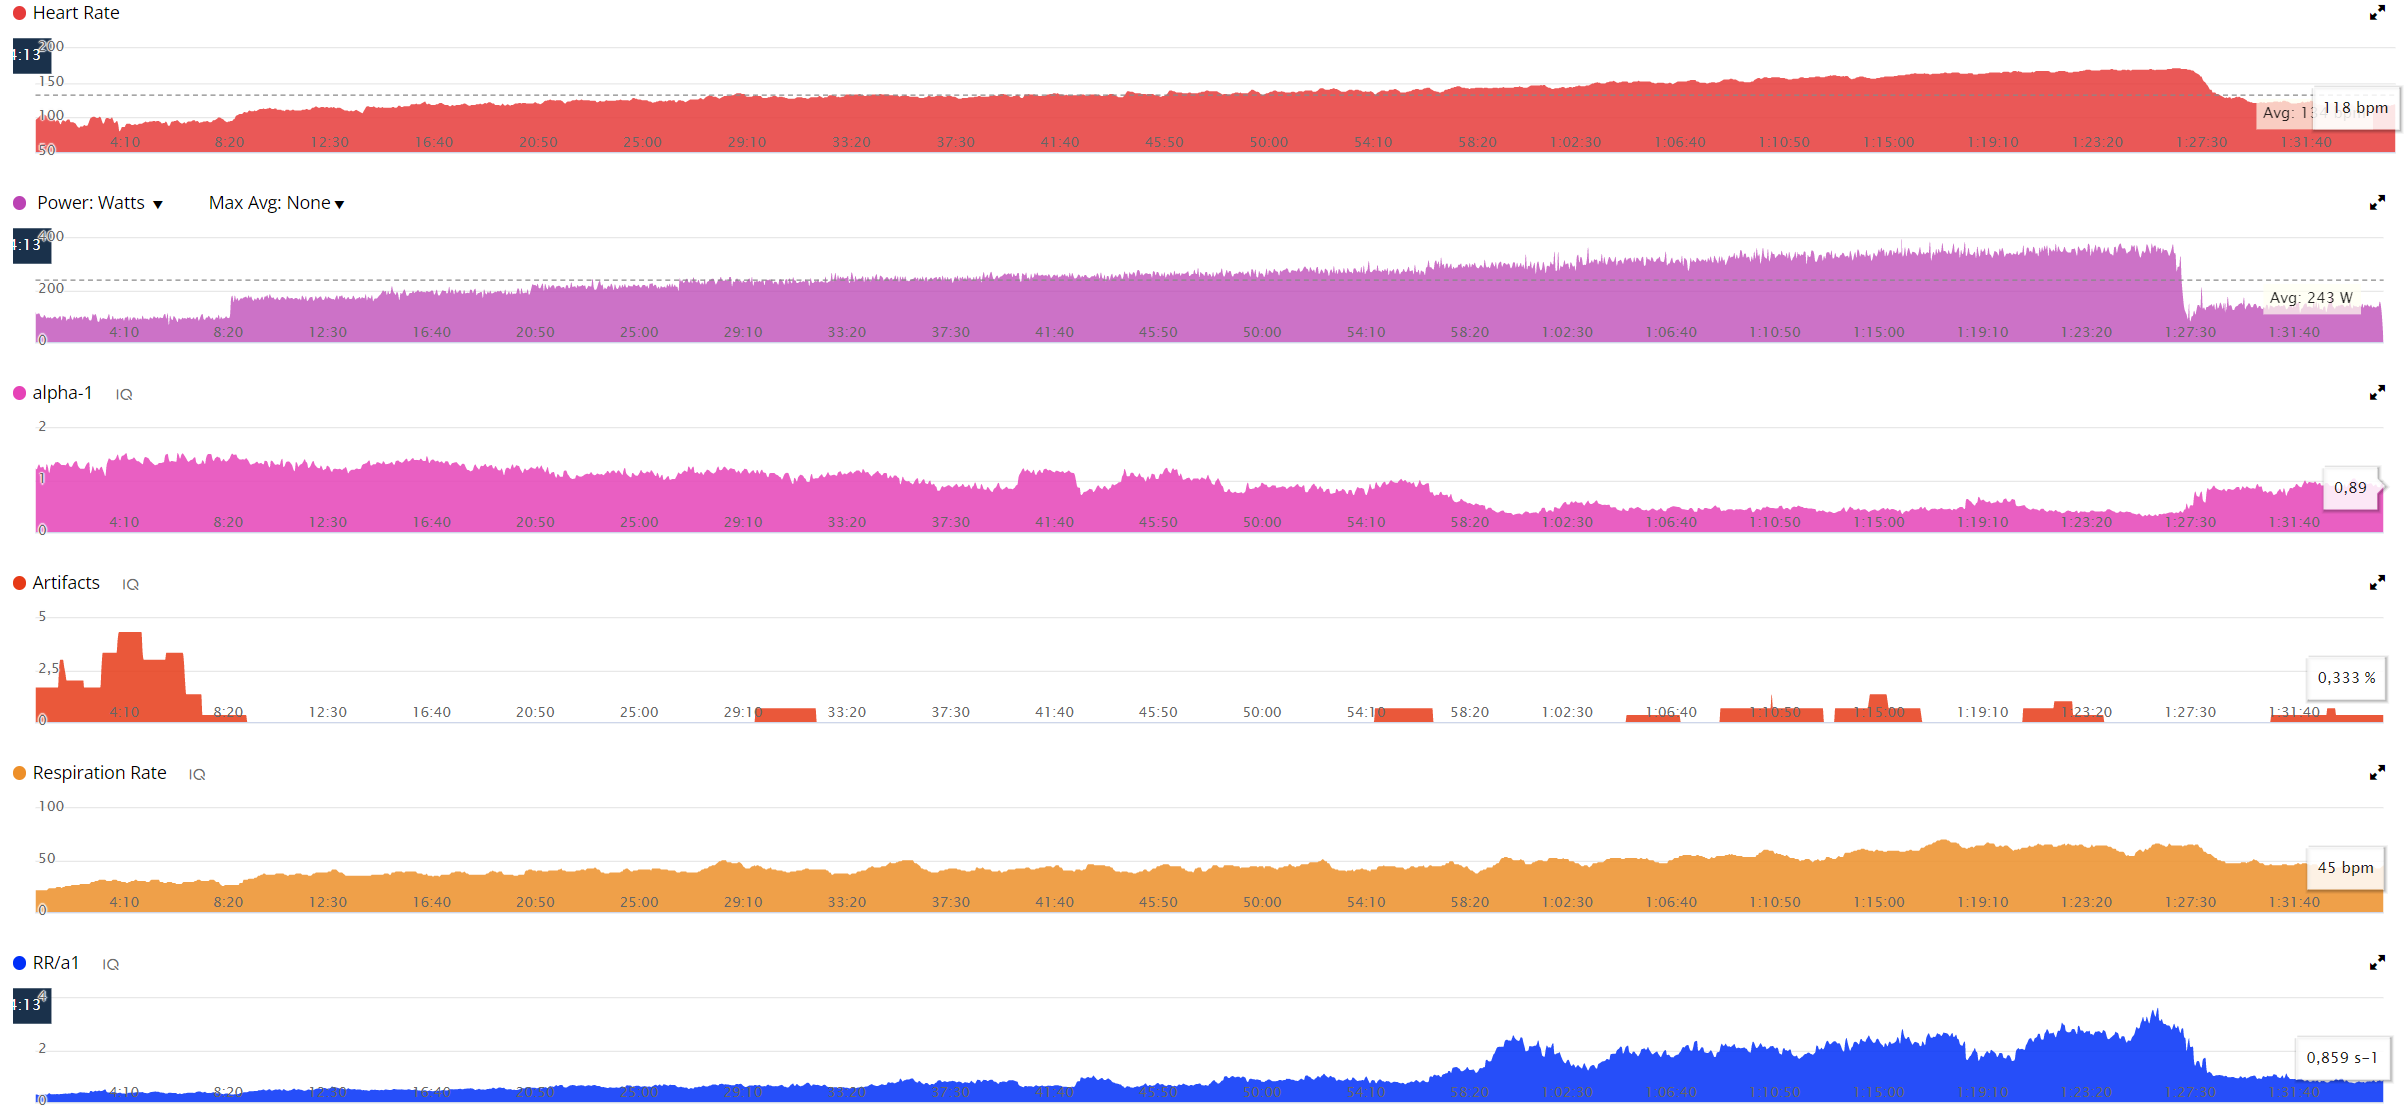
I was a bit tired but HR was coming up nicely up until 165-170 @LT2 so looked good. After 300w dfa tanked but I did feel normal.
No idea where LT1 should be, I do my 5hr rides around 220-230w with avg 130hr or so.
It seems some variation on RRa1 slope happens at 140 ppm. However, from that point results are not well fitted.
Can you share time evolution for a1 and RR? Did you observed artifacts?
What’s your setup (Garmin device and HRM)?
Polar H10 connected to alphaHRV via Ant+
Garmin 830
I had some artifacts, mostly during warm up. I had to drink due to the length and that created some artifacts.
How do I do that? Is this enough?
I tried Garmin Connect graphs but they are not very clear.
The data field stops working, if you stop an activity, put GPS in sleep mode (whilst you stop at a cafe), then wake, and restart activity after stop.

Is there a post on how to interpret RR/A1?
1 Like
This one explains in a very basic way:
But reading through this thread should give you a better understanding.
Really interesting work! I did a ramp according to the protocol above (15m 40%, 6m 50%, etc.)
Is it save to assume my LT1 would be at 154 bpm?
This is probably one of the cleanest examples I have seen yet!
I would even think that LT2 is somewhere around 172-175 bpm. Is that possible from your experience?
If you can reproduce this after a couple of easy days, the value for LT1 is surely a very close proxy.