I hour zone 2 endurance ride

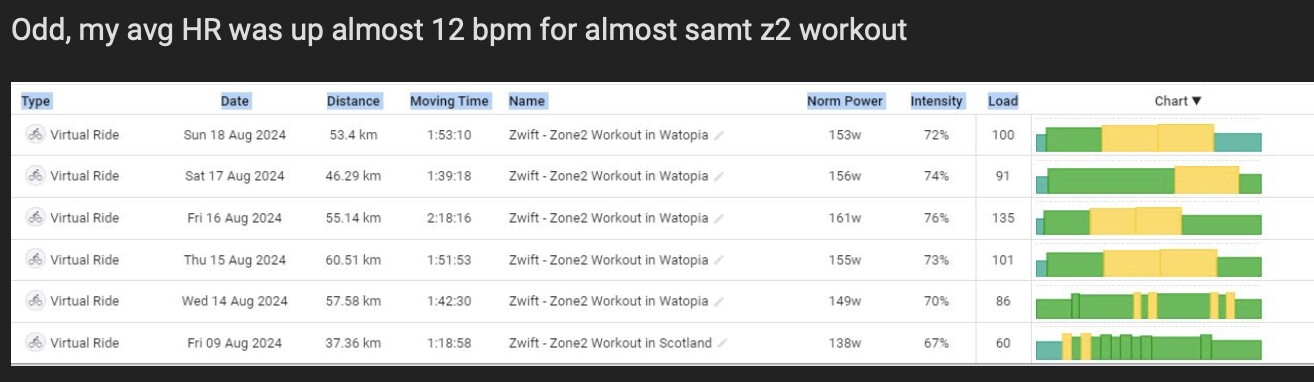
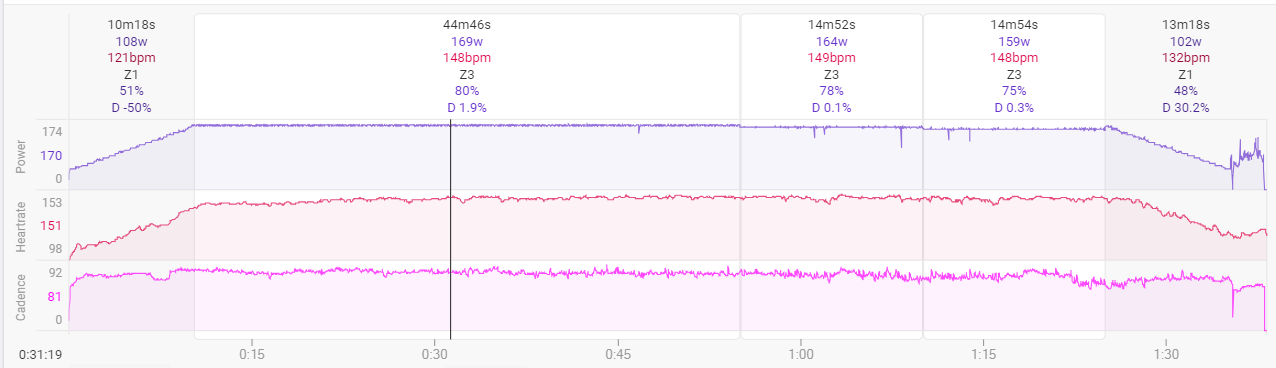
Not the same. Last one had a load of 100. Only reason the normalized power was close was due to the extended rest pace at the end. Overall times, distance, and power of the workouts were very different. A difference of 7 cadence is significant.

Consistent rides outside are definitely challenging for comparison due to terrain, traffic, roads, etc. but are more consistent if you pick same route on flat road with few interruptions. Inside on the machine I would suggest you keep everything the same.

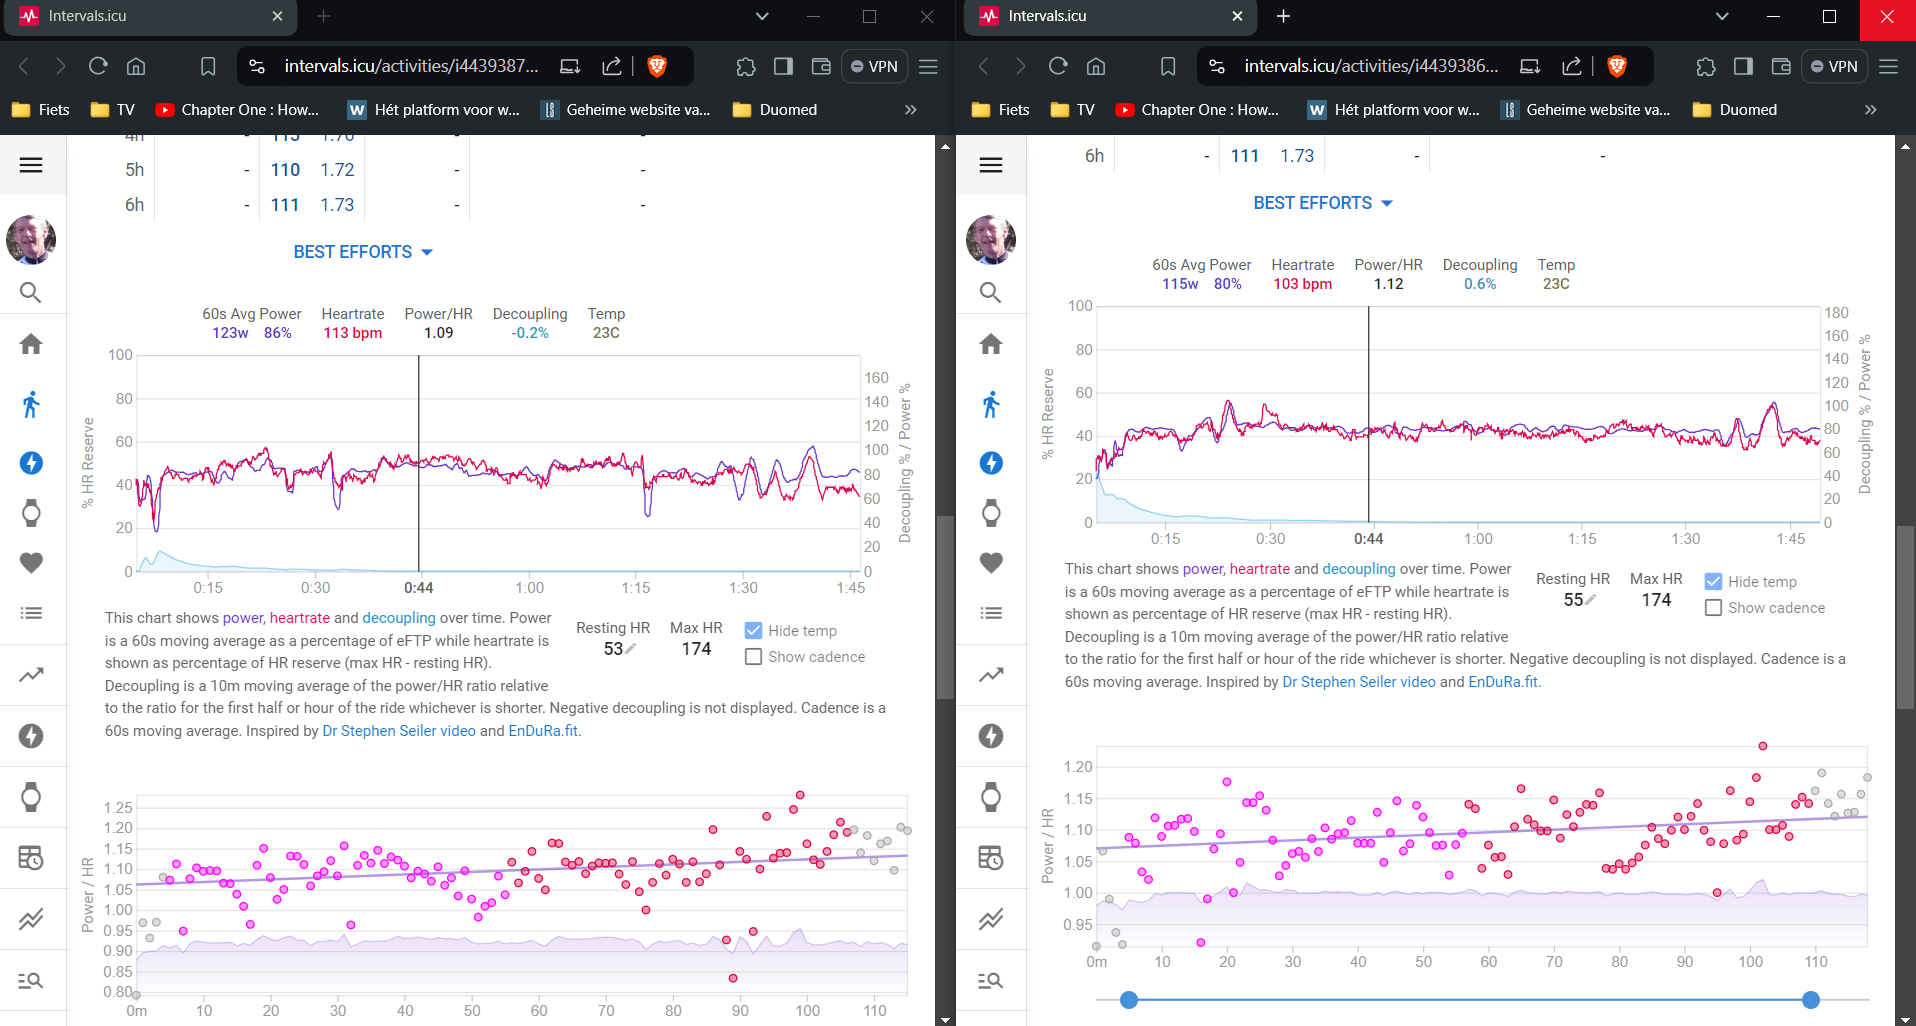
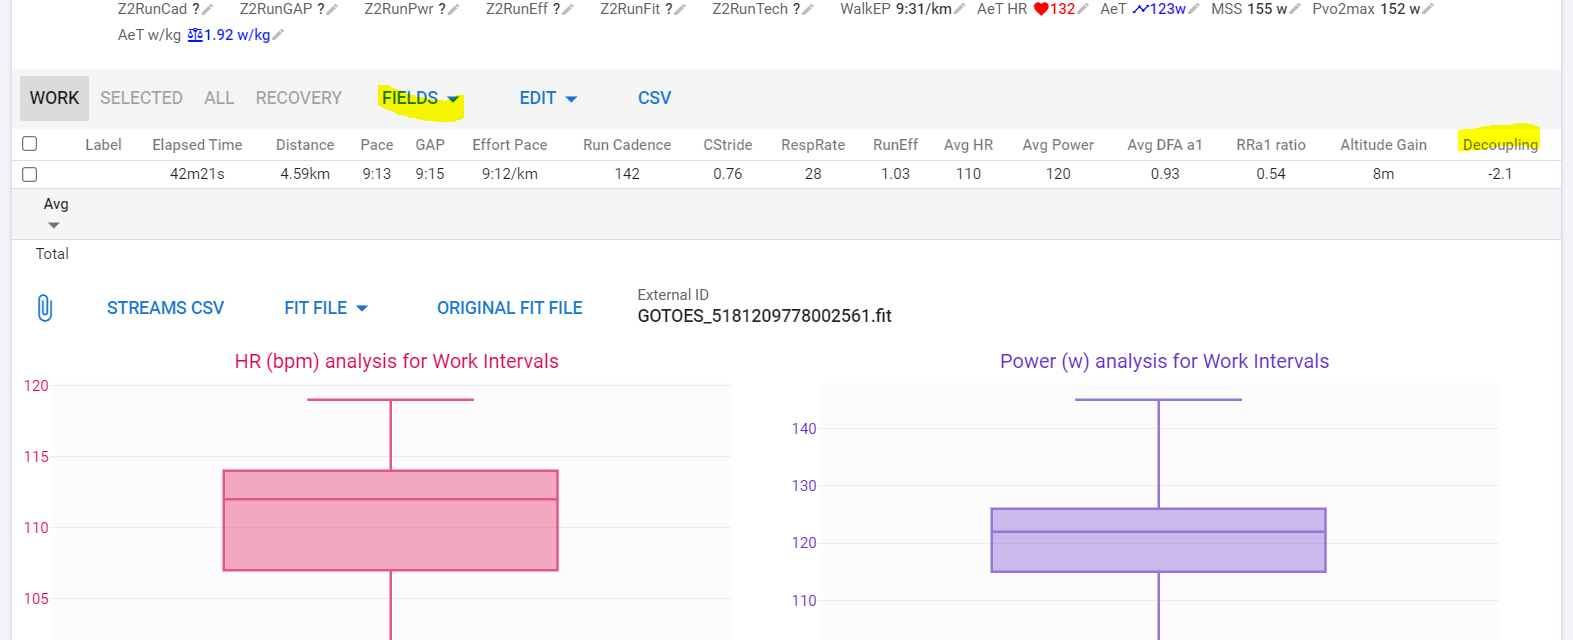
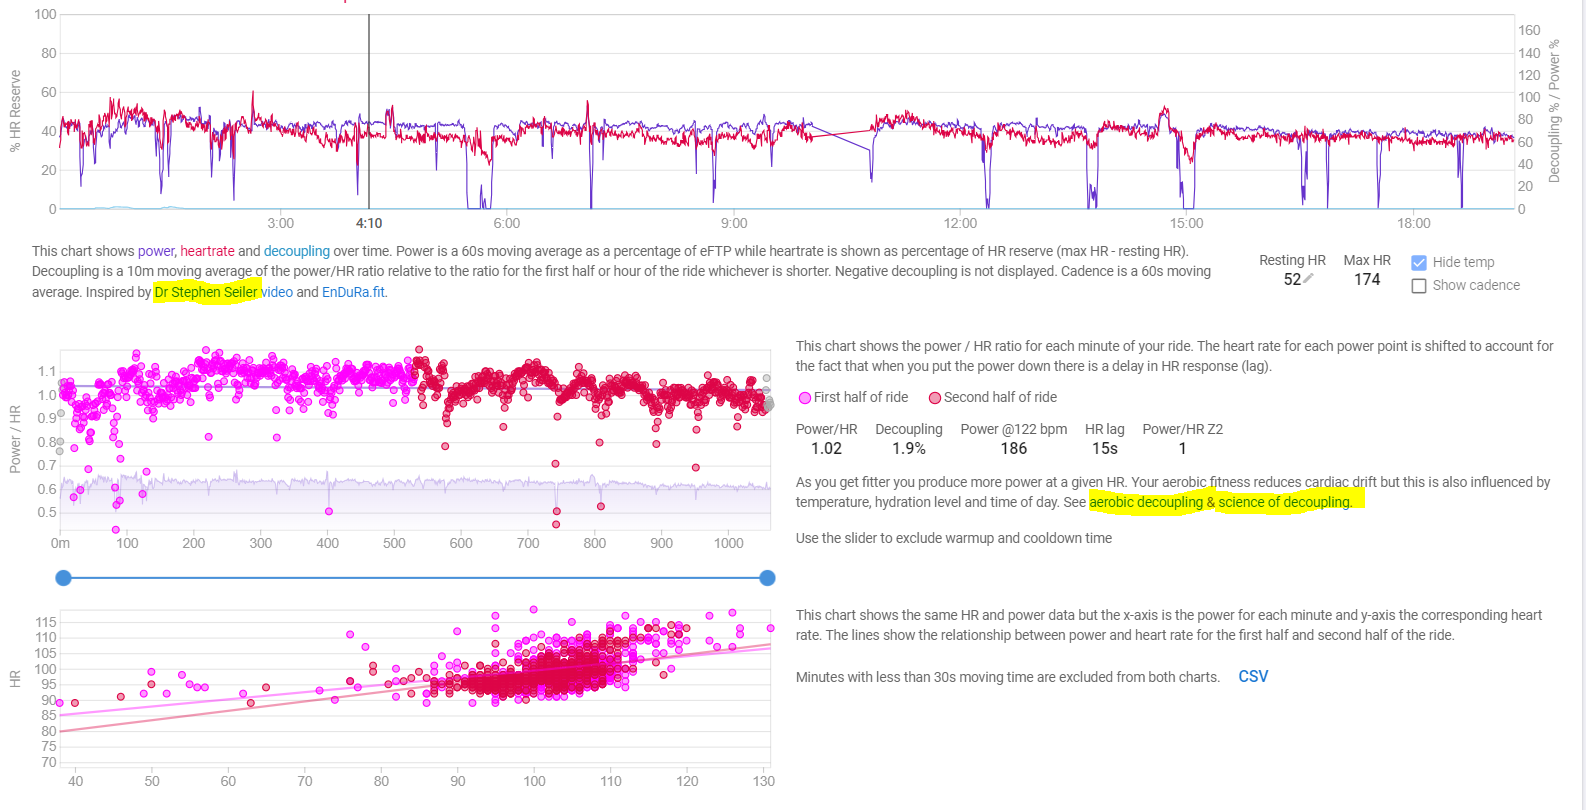
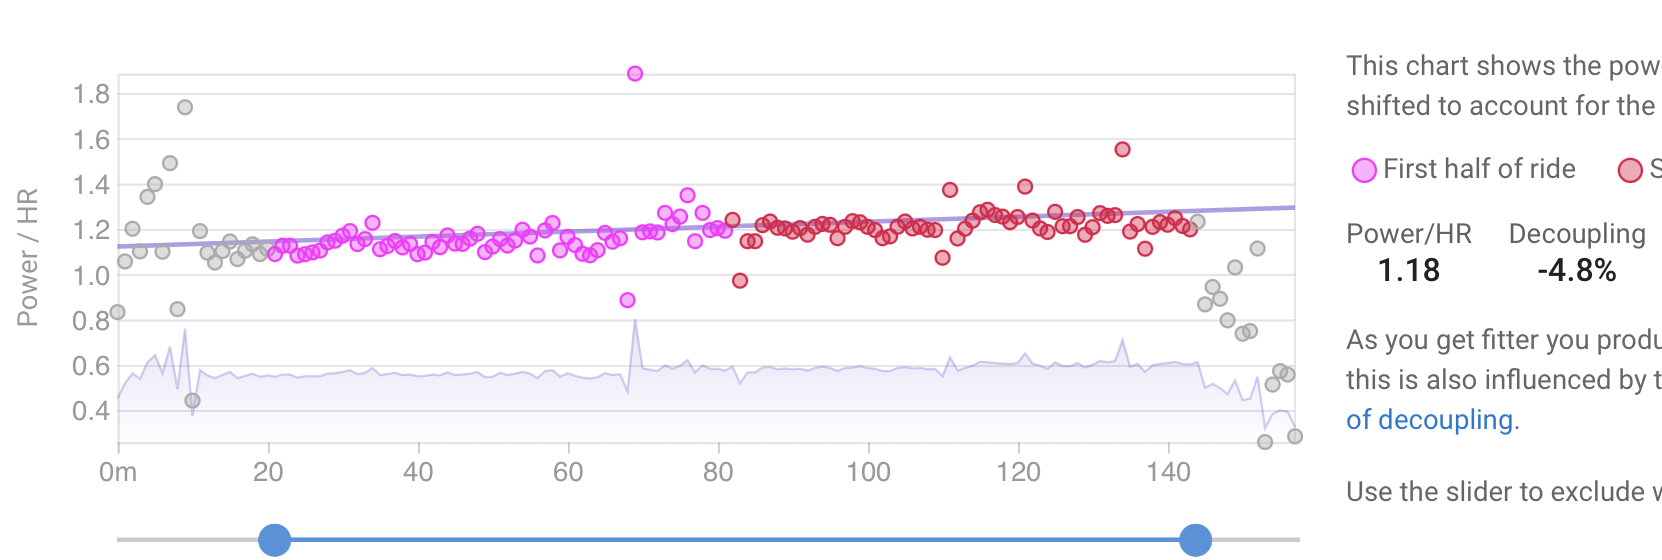
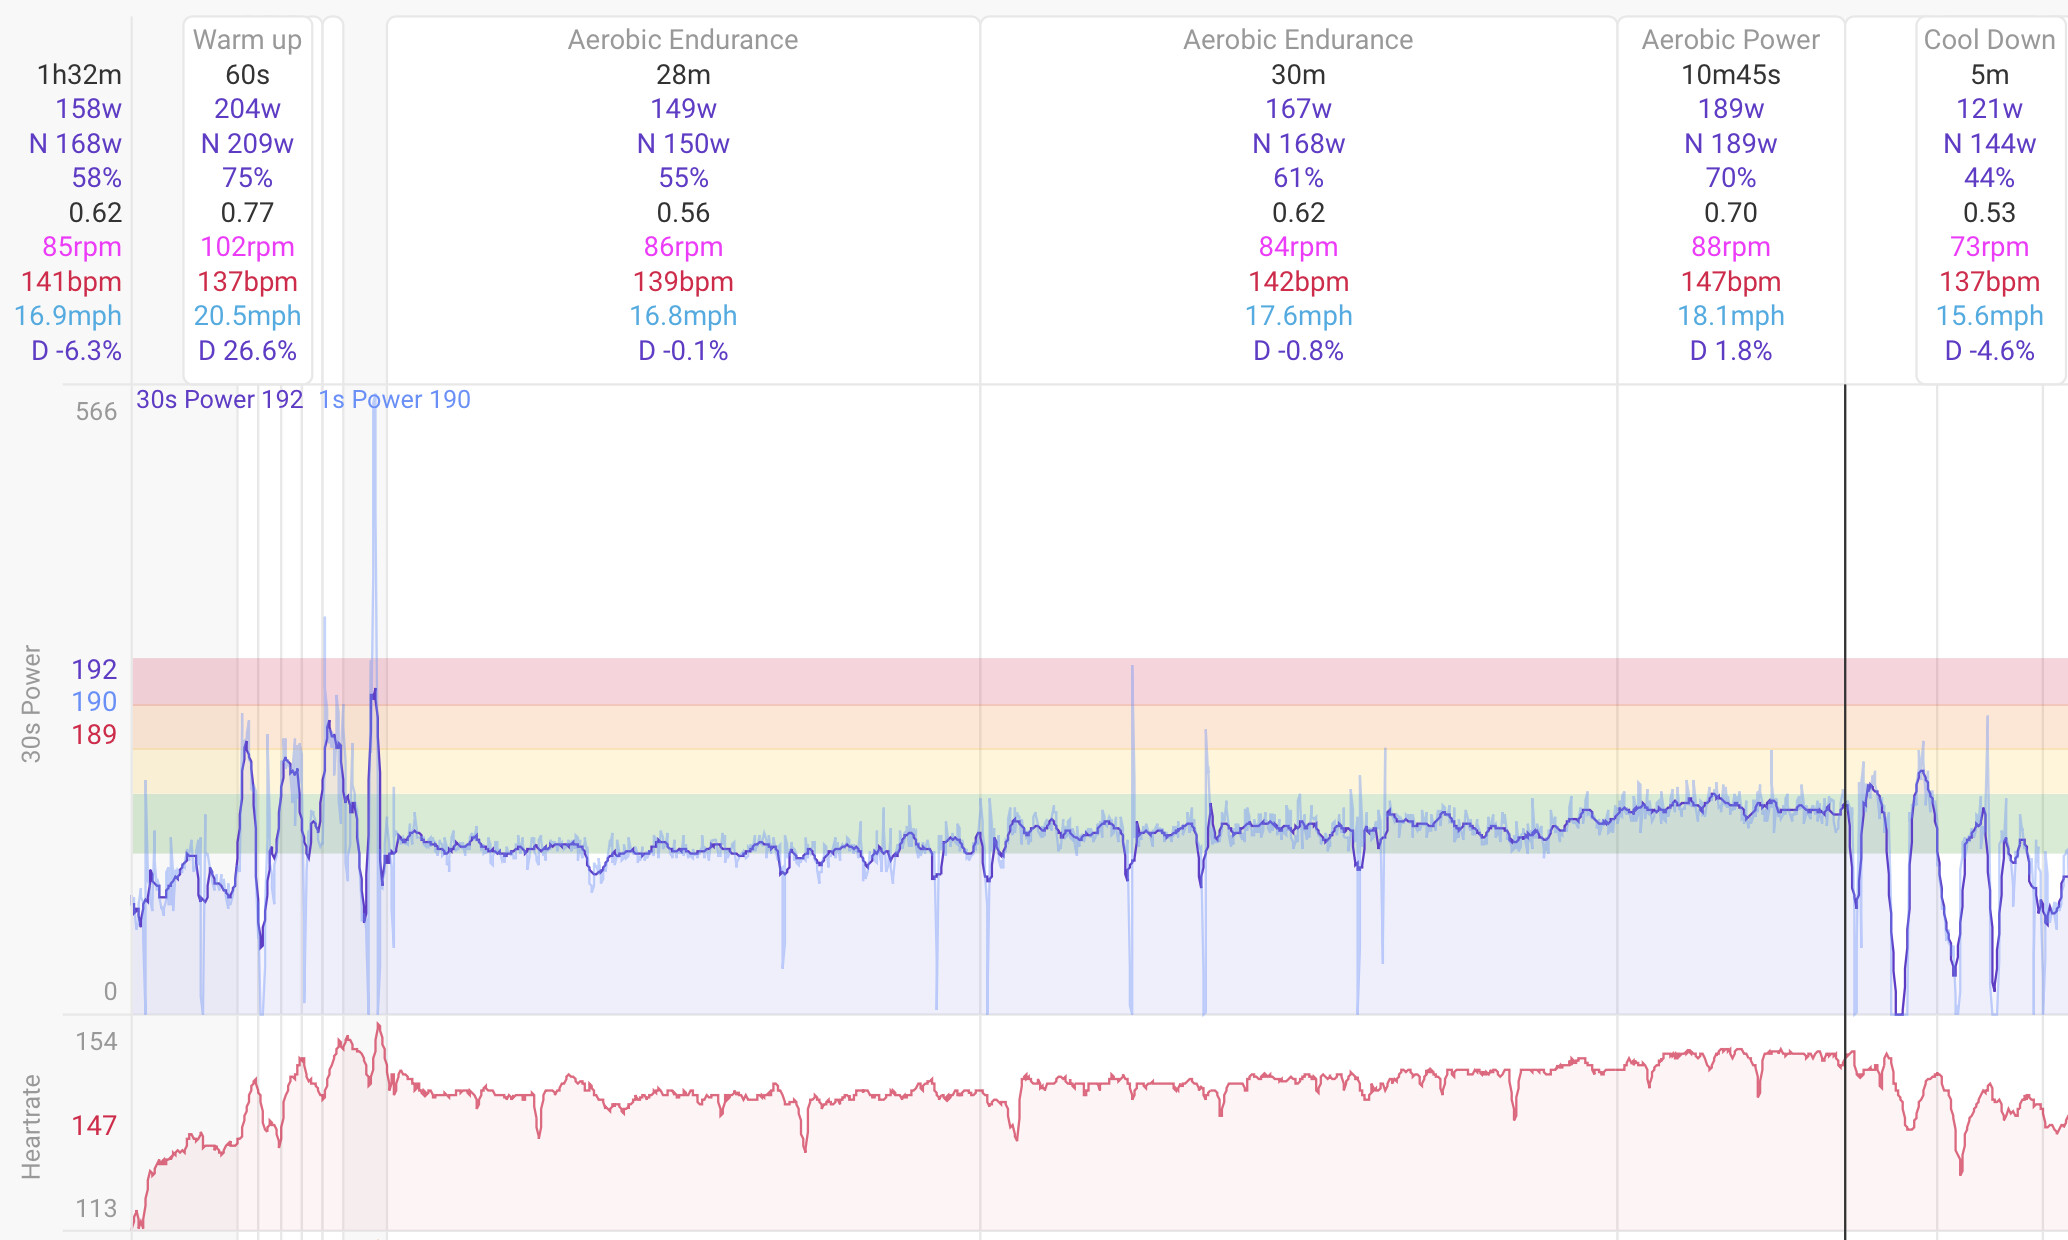
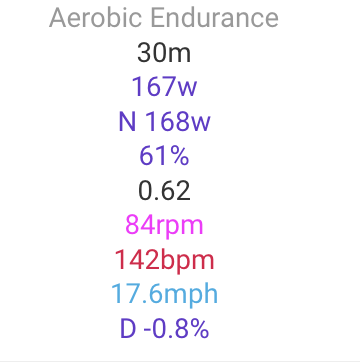
After warmup, settle in at a cadence, set your resistance, and keep that cadence throughout. Rides are best at the same length. Heart rate will rise but that’s the decoupling you want to measure and compare ride to ride. Then on the Intervals power page for the activity, review and compare the decoupling chart at the bottom for progress from ride to ride. Improvement takes time. At a point when your decoupling is under 5%, bump up the ride.

These kinds of rides are best done over 2 hours but in my experience a good hour plus warmup and cooldown time, so 1 hour 25 minutes for me, can give useable results.

Imo anyway. I’m not a coach.

And of course what @MedTechCD says. :+1:

1 Like

Thank you

This part I don’t understand. Should I look in the “compare activities” and compare last 2 rides?
In the “power” page I don’t know how to compare individual activities.

This I also don’t understand how to see/calculate

Thank you very much

Open two browser windows each with an activity on the Activity Power page and compare side by side.

On the second question: make one big interval excluding warmup and cooldown. Then go to the Activity Interval data page and add Decoupling as a table field:

2 Likes

Fantastic! Thank you very much!

Shall I read the decouple value at the “interval data” page as %?

In my last Z2 session, I had a decouple value of -5,4. Shall I interpret it as “<5%” and increase the power a little?

thx

Show a screenshot of the selected interval where power and HR is visible.
Decoupling only makes sense for fairly steady state work. If there are a lot of bursts or pauses, the number is useless. If you included too much of the warmup, it equally influences too much.
Negative decoupling is not very common. I know that I have negative decoupling for anything shorter then 1 hour, often even 2 hours, but for most people the decoupling number is positive right after the warmup. And yes it is a percentage.
Check the hyperlinks to understand what it means.

1 Like

If I do 84min block in ERG mode (28min 150watts, 28min 160watts, 28min 170watts), it’s useless for decoupling?

Useless? I don’t think so.

Keep it simple. Here is a December 2023 example from EARLY base training where I “let the power come to me” aerobic workout:

  • 1 hour at 61% avg power and -4.9% decoupling

You literally can see HR dropping during that first 1 hour, up until the end of the hour when a dog chased me so a big/short power spike to escape the dog.

  • pretty steady & HR for 45 minutes at 66% and 1.5% decoupling

  • pretty steady power with HR rising at very end of 30 minutes at 71% and 0.5% decoupling

After warmup, all the aerobic including a couple power spikes

-4.8% decoupling because power ramps, HR ramps, but power ramps faster than HR.

MY ENTIRE POINT IS THAT POWER AND HR ARE CLOSELY TRACKING EACH OTHER FOR ~2 HOURS. IF POWER GOES UP, HR ALSO GOES UP.

2 Likes

another shorter one

again, no decoupling for each interval by itself. The decoupling is at the bottom of the fields:

image

“D -0.8%” = decoupling of -0.8%

If I use the power page chart, and start at 20 minutes (warmup) and let it calculate decoupling until end of 3rd aerobic interval, I get -11% decoupling. Don’t get excited about negative decoupling. Just say “no decoupling” and all is fine. Go longer and eventually you’ll see some decoupling.

Also your earlier post

shows enough yellow / tempo that I’d call those “Endurance” rides unless you have been lab tested and actually know your zone2. Even then, there isn’t a common definition for zone2 for lab tested data. Someone picks a definition, or you read up and form an opinion on the definition of zone2.

1 Like

Thank you for all the good info about decoupling. Have much more to readup on now.

With regards to the Zones I am a little puzzled. I have created my custom workouts based on what I googled as Zone2. 60-70% of Max HR and 70-80% of FTP.

In Intervals settings I see this Zone definition that is a bit different
Zwift Intervals Zones

Also I think I have found that my performance is quite different based on which Bike setup I am using.
Only looked at power/HR for the 5 min warmup and my 3 x 28min blocks and it seems somehow that it requires much less work for me to do the work on the Zwift Ride. I also notice that in practice. On the Zwift Ride I can sit up and still push the 170 watts comfortably and maintaining cadence. On my Trek/KickrV5 setup it takes more effort when I sit up to do the same power and my cadence drops.
Table shows 6 zone2 sessions between 14/8-20/8, including only the 5min warmup and the 3x28min blocks. I think the difference in HR is quite significant. If I could have a HR at 125 bpm in a race when I draft at 170 watts, I would be able to recover so much better.

image

Easy answer is the calibration of the power devices, but this could also be the bike fit. What else I don’t know.

I’ve a seen a professional bike fitter get a measured decent increase in watts during a bike fit. The rider felt more comfortable and delivered more power without even noticing that they were doing that. I don’t know how or why exactly but paying attention to any differences in your setups may yield clues. Ideally your setups will yield identical posture between the two. One area I especially pay attention to are my glutes. Posture very much affects how effectively those are engaged.

If in the end the two cycles don’t, can’t, give similar results, it’s ok. That’s not so great for record keeping but fine for fitness. Adjust to the machine. My machine can’t be calibrated but gives consistent results. I really don’t care about the numbers. Power pedals are in my future lol. Will be interesting :face_with_monocle:.

1 Like

I’m going to try and help explain what I consider a better approach.

Here is what Andy Coggan said in a 2003 USA Cycling coaches meeting when he introduced power based training:

HR response varies between individuals, even when referenced to Threshold HR (not Max HR).

Any HR zones based on % of Threshold or Max should be treated as loose guidelines. And % threshold is generally acknowledged by coaches as a better system (versus what you’ll hear from researchers).

and the table

% Threshold HR (not Max HR).

Repeating my posted this above, here are my HR-zone2 in various systems:

  • 110-134 bpm Coggan (2 of 5 zones)
  • 131-142 bpm Friel (2 of 7 zones)
  • 116-128 bpm USA Cycling (2 of 5 zones)
  • 114-131 bpm British Cycling (2 of 6 zones)

Going back to Coggan’s “all day pace” description of zone2 endurance riding, here is a 200 mile ride from 2017 with almost 13 hours of riding and 0.67 IF (Intensity Factor = normalized power / FTP):

my self-estimated Aerobic Threshold is 135-137bpm - mouse at 136bpm and you can see the “plateau” is 129-136bpm in that chart. Over time I learned to pay attention and can feel an increase in breathing around 135-137bpm (felt it last night).

Here are two group century 100 mile rides, on in 2020 and the other in 2022:

2020 rode it harder, a lot of time solo and steady upper endurance pace, ended up at 0.7 IF:

and the 2022 rode it easier and ended up at 0.66 IF

All 3 started at sea level with 5000’ climbing for the last two, and 10,000 feet of climbing for the double century.

They all tell a similar story about my HR at “all day” pace.

Going back to the various zone systems, my HR data appears to map more closely to Friel’s 131-142bpm estimate. Thats me.

Some people map better to Coggan’s zones.

The points I’m trying to make:

  • HR zone based systems don’t agree, think of them as guesstimates
  • try to individualize HR zones with either field data, or lab data, and use % threshold HR
  • with sufficient training, you should be able to ride “all day” and if riding at steady pace see a somewhat narrow range of HR that helps you identify your lower aerobic threshold
  • if you pay close attention, and ride steady, you might be able to feel a change in breathing around
  • don’t expect power and HR zones to always match

Hope that helps.

1 Like

For most people, 80% FTP power will be too high for Z2. That´s an intensity that can be reached by pro´s or very competitive amateurs who do 20+ hours a week.
70 -75% is more realistic as max for Z2.
The fact that the Power/HR ratio remains practically linear in your numbers, does mean that you´re still below LTHR.
If you take Z2 seriously, you´re better off being slightly too low. The difference in training effect is negligable if you´re a couple of beats low. If a couple of beats too high, you´re not in the intended zone.
Differences in between different indoor setups are to be expected. 99% of trainer devices use speed/power conversion curve and not real power meters. More expensive trainers are factory calibrated per unit, while the midstream trainers get out of the factory with an average calibration value for the model.

3 Likes

Zero difference physiologically between 2 beats too high or two beats too low. The body doesn’t have zones. There are really no such thing as zones! Each of what we define as a zone is a continuum. If you have a AeT HR for example of 140bpm, you’re going to get the same physiological adaptations whether you ride at 138bpm or 142bpm. Technically one of those rides is might be in the wrong predefined ‘zone’.

The only way you’re going to improve is to challenge the body and force an adaptation of some some sort.

3 Likes

Right, the body doesn’t have zones HOWEVER your leg muscle fibers respond to different types of training.

For whatever reason people get hung up on HR and zones and being precise. And in the process lose the big picture.

Why do we have power zones?

In cycling, power zones are a coaching construct with one primary goal of guiding the metabolic training of the different leg muscle fibers, and also the cardiovascular system that delivers oxygen.

Easy endurance work done consistently and frequently will minimize fatigue while increasing the number of mitochondria, the network of capillaries that deliver oxygen, some important enzymes. It will also cause the heart muscle to adapt and increase the amount of oxygen delivered into the bloodstream.

How easy? Depends on how many hours a week you train… keep it easy enough to minimize fatigue, but not too easy otherwise we could get fit by sitting on the couch LOL. Rate of perceived exertion is likely better than HR or power. Easy enough to not impact your high intensity workouts.

Easy endurance is good but not complete.

Easy endurance - power zones 1 & 2 - the primary metabolic adaptations are with SLOW Twitch fibers.

What about the fast twitch IIa fibers that can be trained to be either more glycolytic or more like slow twitch?

All the power zones help guide training of ALL the muscle fibers, and of course the cardiovascular system.

I’m waving my hands a bit, like the picture below

  • LT = lower aerobic threshold or AeT or LT1
  • CP = FTP practically speaking, and certainly if you use long enough durations for CP estimation (in my experience, comparing CP from GoldenCheetah to my FTP estimates)

That picture is from Skiba’s Scientific Training for Endurance Athletes book. Want to know more? Buy the book, read the first couple chapters, and turn to page 80-81 for the more detailed chart that includes his understanding of primary adaptations (with references) for each of the exercise domains.

2 Likes

Soo much great knowledge and insight in this house. Gives me much more understading of what is behind and the purpose of things. From being the guy that didn’t like structured training, I start to like it and enjoy it much more. Haven’t raced since last Tue, doing workouts instead :rofl:

Tried to get some idea of my Aerobic Decoupling. 45 min@170w, 15min@165w, 15 min@160w, then it was enough. Felt it harder to keep cadence up. I guess I never reached the state of HR drift? and the D of 1.9 for the first 45min would indicate that I can maybe redo this but at 45min@175w next time?

I will also adjust my Z2 power into 65-75% range instead of 70-80% and see how that changes things :+1:

1 Like

You have no decoupling. I would ignore it as a metric on such short endurance rides.

After having two top tier coaches I have other comments.

1 Like

I agree on both of these, but the goal of training for performance is to evoke continuous adaptations and stack them. If the cost (needed recovery time) for one of those adaptations is so high that you miss a training session, the total outcome may very well be lower compared to 2 consecutive sessions with lower cost. So the ‘Zones’ are helpful for planning to maximize adaptations.
The bigger picture is adaptations on multiple layers:

  • Cardiovascular (mainly volume)
  • Muscular (mainly intensity)
  • Neurological (mainly technique)
  • Recovery
  • Fuelling
  • … and I’m sure I’m forgetting a couple of important others

What we can’t deny is that our body’s, at some point that is intensity related, promote certain chemical reactions. Like the Resp Coefficient, where you are blowing off more CO2 then you’re breathing in O2. Meaning that our body ‘found’ O2 somewhere else but needs to activate another chemical reaction (which was already at work), in a more dominant way. This reaction causes other waste products, and those, in turn, demand more recovery time to get rid of them.
What I mean is that the Zone borders are not hard points where your body switches from one system to another, but they are markers indicating that one or the other is more dominant.

At this moment in time, when it comes to Physiological markers, three ‘zones’ with two markers is about all we can sort off explain. I never was a fan of 5-7-9 zones and in practice I only use 2 like in the next picture.

https://x.com/StephenSeiler/status/1698271737870229802

2 Likes

Everybody has to find what works for them. Seiler’s “2 zone” model is about nervous system stress and impact on recovery. For myself on 6-10 hours/week, the 2 zone model has NOT helped my training for performance.

Everyone should experiment and find what works best for YOU!

@PerBack some additional comments based on what I learned from a handful of top-tier coaches:

  • decoupling was originally conceived around 2-4 hour steady endurance rides and when to move from early base (base1) to base2
  • its no surprise you are seeing no decoupling on short rides, monitor it but you really need to see what happens on a 2 hour or 2.5 hour or 3 hour steady state ride
  • on your 1.5 hour rides, ignore decoupling, and don’t play around with power. Work on progressive efforts (below) and cadence versatility.
  • for what its worth, when I get in a 30 minute warmup, I generally see less than 1% decoupling on 1-2 hours @ 85% tempo efforts and 35-45 minutes at 95-105% threshold. At least for myself, decoupling is relatively insensitive to % ftp and more about duration - I use decoupling to look at endurance out to 3-4 hours, tempo out to 1-2 hours, and threshold out to 35-45 minutes
  • look at decoupling on your next longer 2-4 hour ride
  • you posted examples of starting at higher power (80%) and then decreasing (75%), thats backwards! You want to let your body warmup and practice finishing stronger than you started
  • make your power progressive and “let power come to you.” One coach assigned 2-hour workouts with 10 minutes warmup/cooldown, and 100 minutes at a wider 66-79% range… and coached me to ride by feel and start lower and end higher. There is more context to give but I’ll leave it at that. The other coach assigned 1.5 hour endurance+ for example 30 minutes at 60-70% then slightly more power for 30 minutes at 66-72%, then slightly more power for 15 minutes at 70-75%. A 2 hour endurance (no “+”) would be 30-min at 55-65%, 45-min at 58-68%, and 30-min at 60-70%

hope that helps!

3 Likes

Thanks. Gives me a lot to think about.

How I am thinking.
Since my target now is Zwift scratch races tha are typically <45min, I was thinking just to testmyself, to make 45 min at X power to see at what power, I start to break apart (decouple). Seems I can hold 170watts OK. Next time I do it with 175 watts, then 180 watts…until I get a decouple of >5% . I have found “PowerX”.

Then I go back to base-building 80/20ish and at times I redo the 45min@PowerX to test if I have got a stronger aerobic engine, until I get decouple <5%.

I am now at around 3.6wkg@20min and my goal is to get to +4wkg@20min.
I have never done any base-building my whole life so I am hoping it can make me a little stronger over 20min. My FTP is now around 3.4wkg. I have approx 7-10hours/week for cycling.

Is my target unrealistic? and do I approach this totally the wrong way? :slight_smile: