Tks! What an idiot I was. Funny is that I thought I was ahahah.
Nonetheless I’m getting an error message.
One doubt I have is what name should I use? Any?
athletes = {
‘Name’, ‘ID’, ‘APIKey’;
};
Tks,
PS: I’ve double checked ID and APIKey
Tks! What an idiot I was. Funny is that I thought I was ahahah.
Nonetheless I’m getting an error message.
One doubt I have is what name should I use? Any?
athletes = {
‘Name’, ‘ID’, ‘APIKey’;
};
Tks,
PS: I’ve double checked ID and APIKey
Correct atheletes by athletes and use whatever name
Tks. Always “the details” …
Have you already measure today’s HRV and sent to intervals?
There is a trace path. Your last points are concentrated close in the same region. Zoom in and you will see the trace line. This line only considers last 5 days
I have find out that perhaps I can use my Garmin SDRR metric as a kind of sDNN:
Measures of overall variability (e.g., SDRR and TP) are considered to be influenced by both parasympathetic as well as sympathetic cardiac activity, although these measures tend to be associated with cPNA-HRV measures (Tulppo et al., 1996; Warren et al., 1997; Hautala et al., 2003; Martinmaki et al., 2008), suggesting that parasympathetic activity is the primary influence.
Other problem I have is that I think Garmin is uploading to intervals.icu the rMSSD that get over the night (or even all last day) and overrides my previous manual input on the Wellness Data fields (that I am filling all my mornings after taking a Health Snapshot, since you point me out that it is more convenient).
I’m keeping track of my morning readings in a custom field. That way I can compare it with the nightly rMSSD from Garmin
Olly,
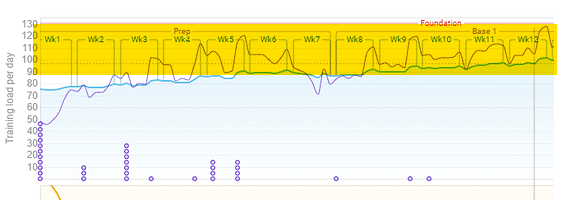
How did you get the Wk1 - Wk11 ranges to show up on the Training Load Per Day chart which I thought were un-customisable?

They a notes. I add them for all weeks across the season/year for ease of reviewing.
Ah, ok. Thanks
Olly,
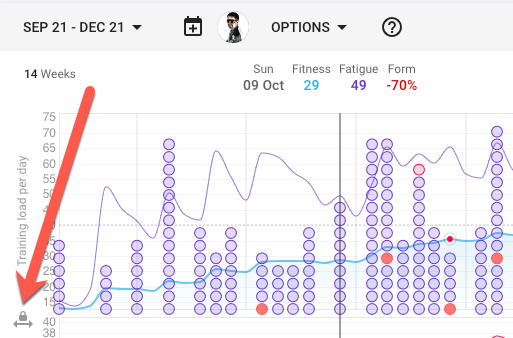
I have tried to edit the TL per day graph, using Notes, as you said, however notice that it has a LOCK symbol showing. Does this mean this graph is a system graph and therefore un-customisable?

You need to add the notes on the activity page. Click on start of your week and add a note for 7 days and name it WkX. Make sure the box at the bottom left is not ticked to say “show on fitness chart” or similar
Don’t want to stray off topic too much so happy for your to message me directly if still not working 
Eg.
Thanks, that worked a treat.
ah, not really. I thought it was picking up from the HRV somehow. Thanks, it looks a nice graph
The graph picks up on the 1-4 score, which would be based on either manually entering it after getting the HRV result, or uploading via the CSV upload, or MedTechCD’s script (coming soon).
But this matlab script relies on the actual standard fields, so if you use a custom field it is not the one the ImReady4 tool will check, right?
It’s not that difficult to replace the name of the standard field by the name of your custom field in a copy of the script. Simple Find/Replace in the script text. If you mess up, start over with a new copy of the script.
Seems the free EliteHRV export text files only provides the individual R-R values for a reading and not the other HRV metrics such as RMSSSD and SDNN… I can get all this exported for $8 it seems, or I could manually go through each reading on the app and create a spreadsheet…I know which way I am leaning!
If it is a one time fee, I wouldn’t doubt a minute. If it’s monthly, that would be excessive.
Recently donated 10$ (one-time) for Gotoes and I can assure you that it is a magnificent tool for merging, cropping, appending… FIT files. Even with the special IQ fields from Garmin.
Its monthly…but I only need to get the data once to retrospectively populate the SDNN values really, so I would export and then cancel sub. I can then revert back to manually populating both (to date I have only manually populated the RMSSD values…which was silly of me).
I have been using EliteHRV free for over 18 months so I ought to give back anyway!