HRV-Guided Training

I´m running a small vba script with a curl command getting all wellness data (including user fields) in a csv file. Then refresh a query pulling the CSV data in excel.
The possibilities for calculating and charting become endless…
You can also run a batch file with the following cURL command (valid for Windows):

curl.exe -u API_KEY:xxxxxx https://intervals.icu/api/v1/athlete/ixxxxx/wellness.csv?oldest=2022-07-18^&cols=weight,ActiveEnergy,Steps,restingHR,avgSleepingHR,SleepingHRrange,HRduringBP,DayAvgHR,DayHRrange,MeanRR,sleepSecs,REMSleep,AwakeTime,LightSleep,DeepSleep,systolic,diastolic,sleepQuality,stress,soreness,fatigue,mood,motivation,hydration,hrv,hrvSDNN,baevskySI,RespRate,readiness,PNSIndex,SNSIndex,LFPower,HFPower,LFPowerNorm,HFPowerNorm,RatioLFHF,PoincareSD1,PoincareSD2 -o test_ixxxxxx_wellness.csv

Edit the custom field names for what you have as columns.
When you make a cURL for the complete wellness.csv, the custom fields are not included in the returned data, that’s why I listed all column names.
1 Like

I can’t find the origin of this matrix ( @Olly_Thomas or @Howie ??), but this is exactly the next thing I had on my Todo list for the HRV4 interpretation. Nice job!
I would just brake it up in three trends, a long term for RHR and HRV (60d), an actual values trend for baseline RHR/HRV and CV (acute changes) and a ‘recent’ trend (14d RHR/HRV/CV + evt subjective scores).
Then use all those results in an algorithm to come up with an advanced automatic interpretation.
If anybody wants to start playing with an algorithm, the Slope function in Excel is the way to go to mathematically detect trends. This function gives you a slope value for a linear trendline drawn on the selected data range.

3 Likes

Thanks @MedTechCD

In excel I just navigated to GetData from Web and inputted the data source address I found in the ithlete file and bingo, the data popped into excel for me.

I’m pulling in my data using only my athlete id and not my API? Is this OK? Still trying to work out how to omit certain columns. Edit – Figured this out now :blush: No clue what I’m at so apologies @MedTechCD for not understanding what you told me

Pretty much set except I seem to be pulling in my data without using my API. Not sure if this is OK? I’m just using my athlete id.

If you used my iThlete file before, the authentication with your personal api-key is stored globally in MS Excel and available for all sources from the same web-adress. You can check that by going to Data - GetData - DataSource Settings and clicking on Global Permissions. If Intervals.icu is listed there, you re-use the same logon credentials.
So nothing to worry about.

1 Like

@Olly_Thomas’s matrix.
@MedTechCD, I thought about trying to incorporate some time of trending information but decided, at least for now and for a quick reminder of the basics, to keep it simple. What you’re thinking of sounds interesting.

Hey
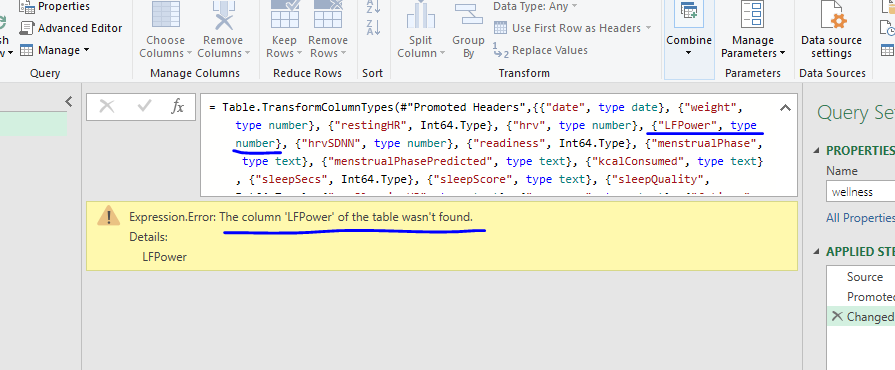
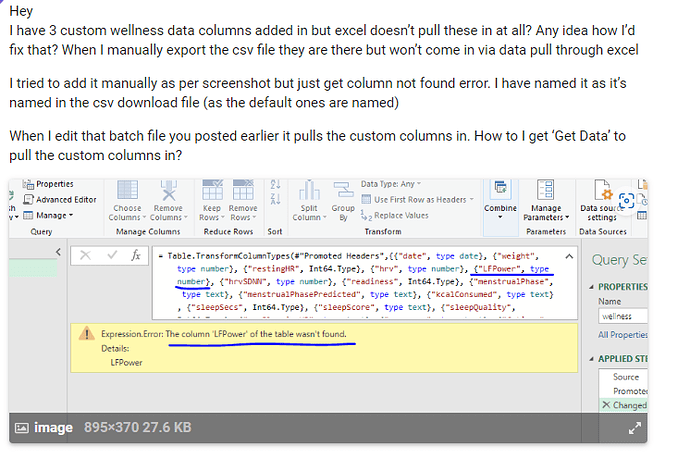
I have 3 custom wellness data columns added in but excel doesn’t pull these in at all? Any idea how I’d fix that? When I manually export the csv file they are there but won’t come in via data pull through excel

I tried to add it manually as per screenshot but just get column not found error. I have named it as it’s named in the csv download file (as the default ones are named)

When I edit that batch file you posted earlier it pulls the custom columns in. How to I get ‘Get Data’ to pull the custom columns in?

Hi @Howie
If I’m reading this correctly one is in a PS Hyperactivity condition if the following conditions are met:

  • HRV 7 day average is above the 60 day average,
  • rHR 7 day average is below the 60 day average
  • HRV CV% is rising?

2 questions:

    • What if those first 2 conditions are met but the CV% is decreasing?
    • I could see it as perfectly normal that your 7 day HRV would be higher than a 60 day average and your 7 day HRV would be below a 60 day average, especially when getting back fit after even a short break.

In the situation you describe the body may initially be coping. But Marco and Andrew were very clear with me that any acute change (Base outside of Norm) is a warning sign.

At some stage or another as fitness and overall wellness increases then the acute readings (7 day average) are going to be outside a 60 day base.

Marco refers to a large deviation. That needs to be defined. What is a large deviation?

I think an acute large deviation is just that. A one or 2 day big jump. Not a 7 day average. 7 day average is probably too long a time frame to describe the acute change he’s talking about.

EliteHRV, HRV4Training and the ithlete excel sheet from here all reported train as normal all week long. Not even close to a PS hyperactivity situation.

I think a 7 day window needs to be narrowed when talking about acute changes.

1 Like

If the trend upward is slow enough then the 7d won’t exceed the 60d + SD since that will trend upwards as well. IIUC, “large deviation”=7d outside of 60d SD. Dr. Flatt’s meta-analysis states that 7d is more important than daily.

3 Likes

Exactly!
@nasatt makes some mistakes in his interpretation. But I completely forgive him, because this is al so complex.
Never ever make the mistake to reference anything to a baseline ar long term average. All values within the band (avg +/- SD portion) are to be considered “normal” fluctuations. Only when you go out of those bands, a meaningful change has occurred.
HRV going up in the long term means that you have a better lifestyle and not that you are getting fitter. You probably will be fitter but that’s not because the HRV number indicates that. It’s because the better lifestyle and general health condition makes you cope better with higher training loads.
Regarding CV: a rising CV is usually the first sign that things become more difficult to cope with. It is almost always the first parameter announcing a change in your ANS.

The goal is NOT to chase higher HRV, the goal is to stay in a balanced, stable state because stable means that you are handling well. This is probably the biggest mistake made by people not familiar with HRV. Every time your readings are within the normal values and your CV is low, means an excellent condition to go on with what you’re doing. If you are outside normal, wetter it be above or below, something is disturbing your normal routine.
A long term falling rHR is much more an indicator of better fitness.

3 Likes

I never chase a high HRV. All I’m saying is that a natural consequence of improved fitness and health will be a higher 7 day average than the previous 60 day average. I’m coming back from COVID infection that knocked me for six. Of course my 7 day average 3 months post infection is going to be higher than 60 day average. I’d be concerned if it wasn’t.

So if the 7day SD is 3% then you’re within the normal range if the 7 day average is within the 60 day average +/- 3%?? Is that correct.

Hi @MedTechCD
Have you any idea about this? Post 566?

@Howie
Is my screenshot correct here?
See both yellow highlighted sections.
I’m comparing my 7 day average HRV to the 60 day HRV average +/- 60 day SD ??
I’m in on the upper limit :rofl: if I’m an interpreting what you’re saying correctly?

And another thing? I’m using the EliteHRV ‘HRV score’ for these calculations. Should I be using rMSSD instead? I presume so?

This is data using rMSSD
Marginally outside upper limit this morning (again if I’m interpreting what you’re saying correctly)

As I said, the wellness csv from the API does not contain the custom fields and I don’t know how to get them with the Excel Get Data directly.
Create the batch file with all columns you need/want and then configure Excel to get data from the downloaded csv by going to Get data - from txt/csv.

1 Like

Ah. Sorry.
Ya, I’ve got my batch file sorted. Pulls the data to the csv and then I’ve linked to the csv in another Excel sheet, set to automatically refresh when opened. All works perfectly. Thanks for that batch file. Wouldn’t have had a clue how to write one.

The only time you would want something like you are describing is after a long sickness period because that long period with low HRV would influence the normal values to become low. The iThlete chart is even more prone to that because it uses a 30d average +/-1SD. The HRV4 chart uses 60d +/- 0.75 *SD.
I have absolutely no idea where you are getting the % values from and I can’t follow what you are trying to prove. Just post a screenshot of the unmodified HRV chart and it will be much more informative. What are you trying to do with a 7d SD??
Keep the chart as it was mentioned to be:

  • 60d avg +/- 0.75*SD for normal values
  • 7d avg for baseline
  • 7d CV as extra info
  • Daily values as is

The original chart from Marco uses 2*LN(rMSSD) but that shouldn’t really influence the overall view of the chart. It’s just a way to get results on a scale of 0-10.

Yes, use rMSSD values.
Remember, parasympathetic hyperactivity is HRV 7d average exceeding 60d avg +/- 0.75*SD for normal values AND RHR 7d average below 60d avg +/- 0.75*SD for normal values AND increasing CV. Use all three to inform decisions.

1 Like

Oh don’t mind the % values. That’s just 7 day CV%.

I was really just asking about the acceptable ranges @Howie was talking about and how to calculate them.
Are you comparing your 7 day average to the 60d avg +/- 0.75*SD?

Edit - Ignore. @Howie answered above as I was posting

Thanks! I’ll have to edit my sheet to use 0.75*SD. I