HRV-Guided Training

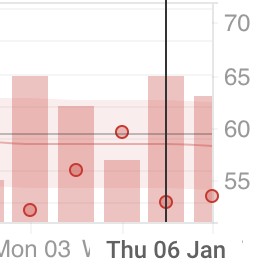
These are the settings for the Resting HR chart:

The bars show your daily value and the “normal” band shows your 60d avg +/- 1 std deviation.
Remember that a Resting HR outside your normal values usualy is the result of an acute stressor. Longer term changes in resting HR can show modified fitness or life style changes. There is also a slight influence by the seasons, that should become clear with multiple years of data.

And these are for the morning HRV measurements:

Yellow bars are the daily values. Similar to RHR, a daily value outside of the normal band can reflect an acute stressor.
Blue line is the 7day avg and gives you a good idea how well you are coping with multi-day training load and life stressors.
Blue band is the 60d avg +/- 0.75*SD and considered your personal “normal”.
Daily values and baseline values within the normal band are considered a stable condition and everything is going well. Values outside the normal band need to be evaluated. This evalution takes RHR, CV and subjective scores into account to make some decisions.
I have added 7d CV to this chart but I’m still thinking on how to get the best use out of it. For now the simple thing to remember is that a low CV is usualy a good thing. Just as anything in this domain, stable is good.

Disclaimer: Nothing about this is my own work. It is all based on the magnificent info found on Marco Altini’s blog. I have done nothing more then reading a lot and putting things to practice in this equally great software suite developped by @david. They are the ones to thank for their tremendous work.

11 Likes

@david perhaps we can crowd source a how-to guide, that should save you time to develop.

Perhaps a review before posting would help.

I don’t mind assisting, but would require help from the many others who know much more than me. I would certainly let benefit from the many different view on interpreting the data.

2 Likes

Tx a stack for publishing this! I need to implement “copy and paste” for these charts soon to make them easy to share. I am going to create resting HR and HRV presets from this thread soon. Need to add a “link” or similar to charts to link back to this forum post etc…

@Gerald It might be sufficient to add to this thread …

2 Likes

Thanks!! I just (re)started taking morning HRV using the HRV4Training app. Will see how committed I am to doing it every day.

This just came into my twitter email digest. I’m presuming of course that nocturnal sleep == night-HRV (as in measuring HRV all thru the night sleeping time)

TLDR: “HR and RMSSD obtained during nocturnal sleep and in the morning did not differ”

1 Like

I put this together quickly based on the excellent work and blog by Marco Altini (https://medium.com/@altini_marco) as a quick reference when I am reviewing my HRV data in intervals…

6 Likes

How does your HRV data trend compare to your ATL? Specifically when you had a big week.

This is what my HRV tend is looking like during my season to date (base period) - I would suggest generally “coping well with training” but looking at the plots, I did have a decrease in 7 day HRV, an increase in 7 day CV% and a slight spike in RHR after wk8 which was my biggest week to date (845TSS) and my current week is looking like another 850TSS week so will see if I have the same trend again next week…

2 Likes

First of all thank you to all the contributors to this topic, you are a fabulous mine of information.
I have a little problem with the display of my graph, in fact my values for the day are displayed on D + 1 which is annoying because I cannot see my values for the day on the classic 14 week display.
Could someone please help me?


14 weeks display


14 weeks + 1 day


However, as we can see the values are recorded on today’s date (Friday).

this question is probably silly but I block completely and cannot find the solution.

I’m not sure if I understand what your problem is but it looks like you want to see the values of today at the top of the graph?
The values displayed at the top of the graph are the values for the day that your mouse cursor is on. So move your mouse cursor fully to the right of the graph to see the most recent values.

Thanks for sharing.

A lot of lesser experienced cyclists I know like to use the daily suggestion instead of looking at the trends relative to the training load

1 Like

In some ways I think this can be the problem with “over-simplification” with a “readiness” metric or similar. I do log this, but if I based my training on a daily basis of this metric or a single change in HRV I would not create the consistency I need to enable longer term gains.

Also, the metrics don’t always align to how you feel in yourself necessarily and so need to be considered with wider metrics and/ or trends. If I do plot my “readiness” (cyan line) on the same plot there is a decrease in the numbers which correlates with the trend, but I wouldn’t make fundamental training interventions based on the metric alone.

That being said, I do quite like the following that was outlined by Alan Couzins (https://twitter.com/Alan_Couzens) when looking at daily HR and “wellness” (readiness?) trends and how to adapt your training loads/ ramp…

2 Likes

The bars are a bit offset from the marker especially if you are not showing a lot of days and they are quite wide. Anyway I have fixed this. Day bars are now centred on the marker:

Screen Shot 2022-01-07 at 18.08.43

Thanks. I was recently noticing the marker offset .

Regarding avoidance of “over-simplification” due to a “readiness” factor, coach Couzens weights wellness factors for each individual based on which of the factors is more/less influential in their wellness and adaptation.

1 Like

Nice delineation in your graphs. What are the lines in your Load graph?

Thanks! As follows:

1 Like

I’d love to be able to have two metrics for HRV—nocturnal and morning. Nocturnal data gathered from Polar watch. Morning data gathered via HRM & an app. This would allow tracking of correlated trends and comparison of differing absolute values.

2 Likes

As always : you’re the man ! Thank you !

1 Like

Hi David,

I just looked into the “Streams CSV” data of the Interval tab and found these entries for the hrv:

time,watts,cadence,heartrate,distance,velocity_smooth,temp,torque,hrv
0,119,44,83,5.26,5.263,22,26,
1,120,44,83,10.49,5.225,22,26,731
2,121,44,82,15.84,5.356,22,26,735:731
3,121,44,82,21.24,5.393,22,26,717
4,121,44,83,26.64,5.393,22,26,717

What is meant by the : notation?
Sometimes there are also three numbers:

266,240,73,114,2403.86,8.976,19,31,524:526:524

Thanks! Flo