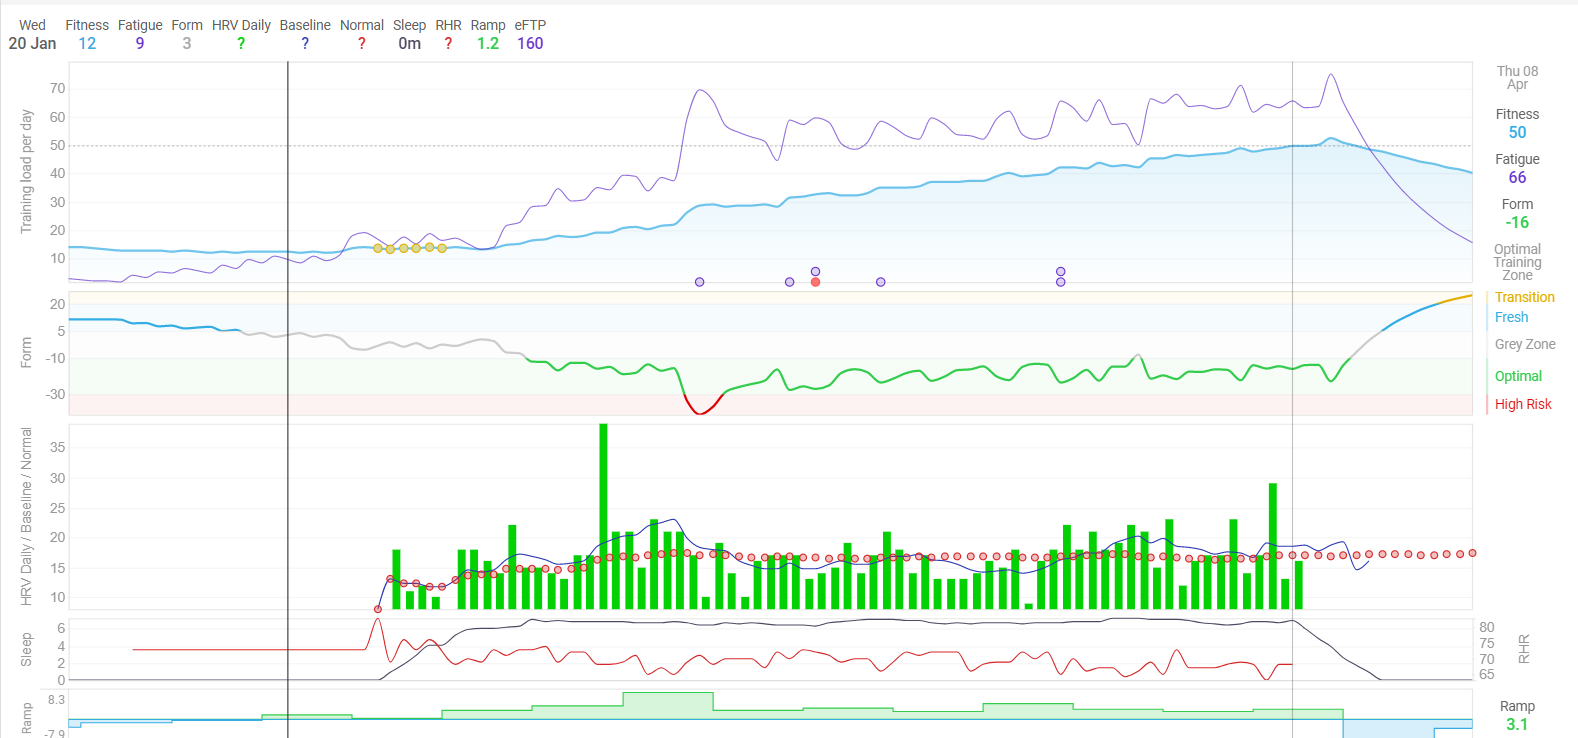
I’ve setup this on the Fitness page:
Inspired on Marco Altini’s way of monitoring rest HRV.
The green bars are daily RMSSD. The dark blue line is a 7 day rolling average of RMSSD and gives you short term trend. The red dots are 42 day average for a long term trend. That last one should actualy be 60 day rolling average with tolerance of 75% of the Standard Deviation but that’s not possible in intervals right now. This tolerance band is considered your “normal values”.
Combined with training load, sleep quantity/quality and other influencers, this chart can give you some insight.